Cooling Noise and Power
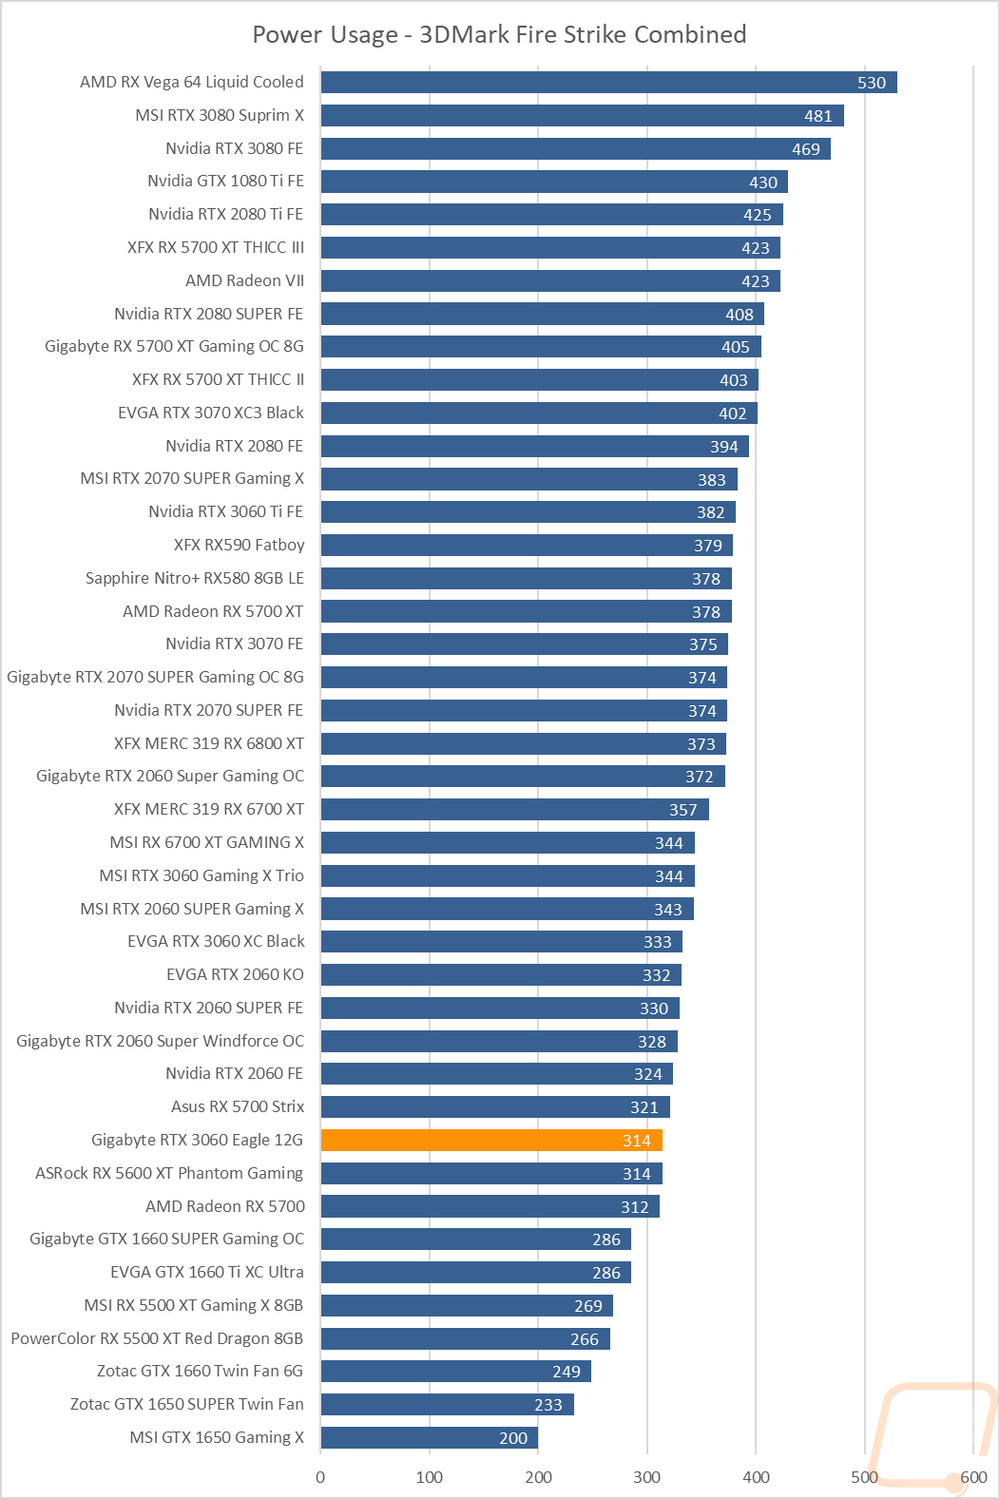
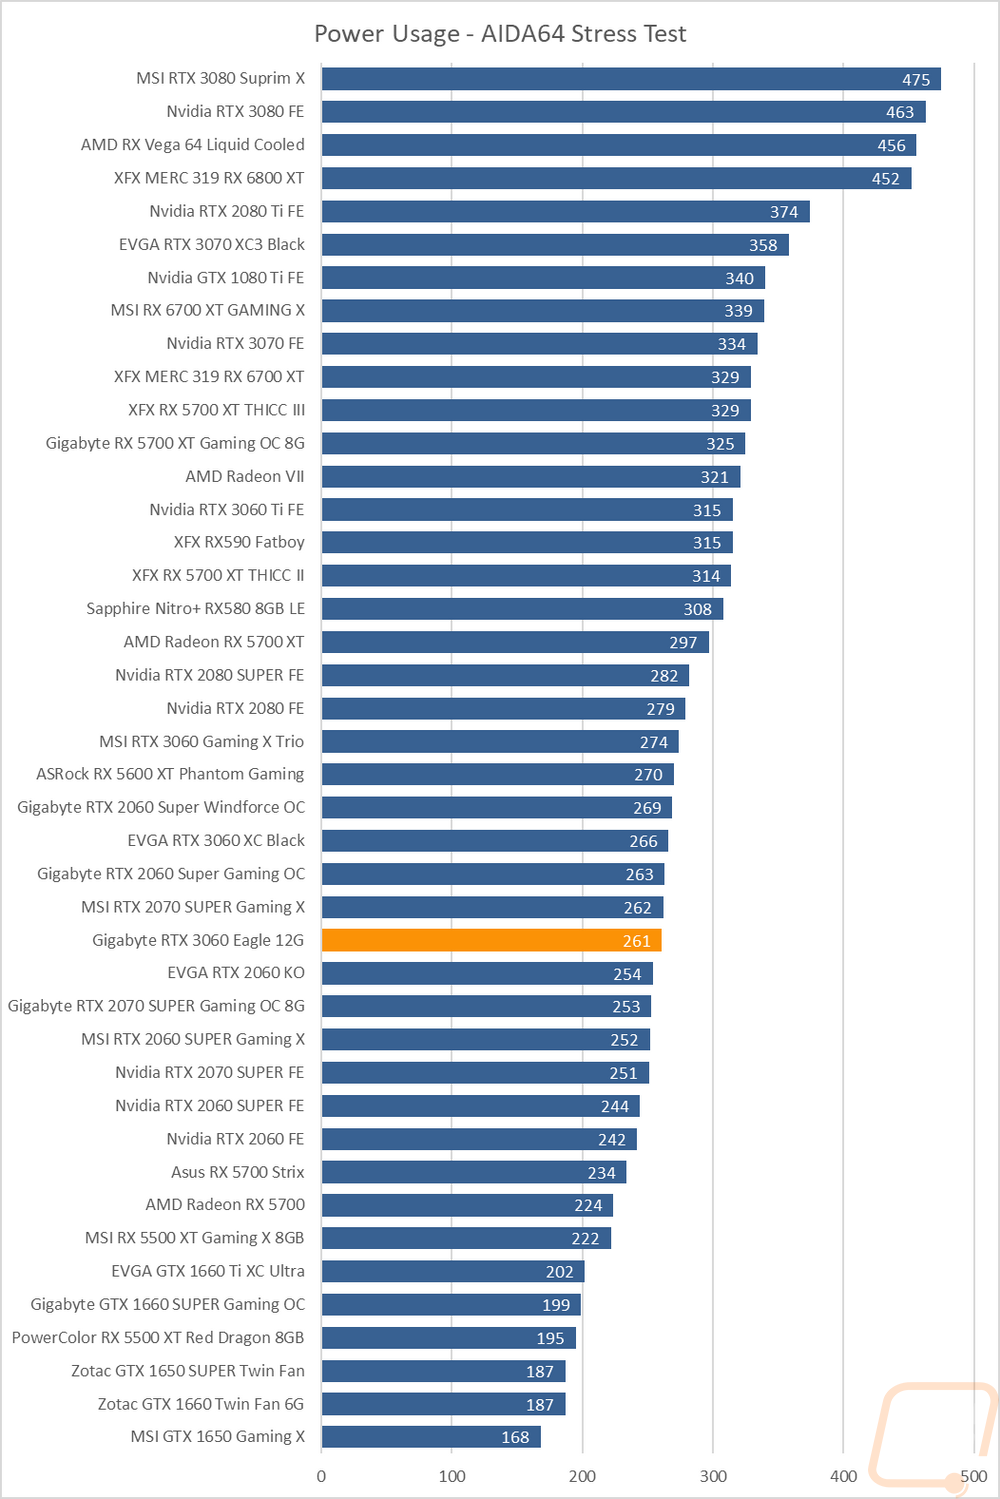
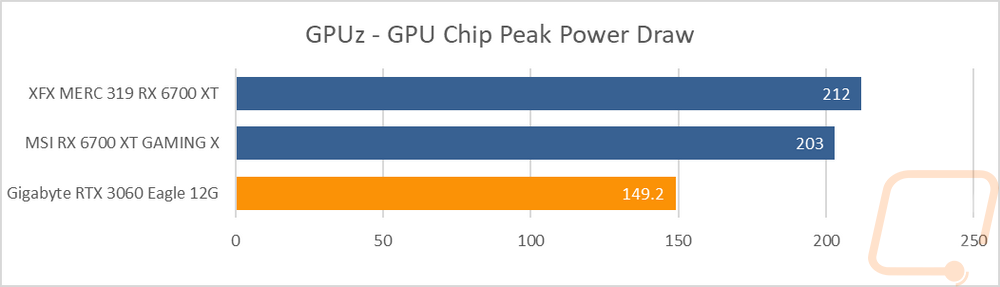
For my last few tests, rather than focusing on in game performance, I like to check out other aspects of performance. These are also the most important ways to differentiate the performance between cards that have the same GPU. To start things off I took a look at power usage. For this, I use our Kill-A-Watt hooked up to the test bench to record the total wattage of the system. I ran two tests with the first using 3DMark Fire Strike to put the system under a load similar to normal in game performance. Here our test system with the 3060 Eagle did better than I would have expected. With the 3DMark test, the system pulled 314 watts which was under both the overclocked and other factory clocked RTX 3060’s by around 20 watts. The AIDA64 workload which is a lot more consistent was a lot closer but even here the 3060 Eagle did come in at 5 watts under the other factory clocked 3060. I took a look at GPUz’s sensor readings while running 3DMark again just to see what they would say for the peak on chip power draw but because this is a new addition we can only see that the 3060 Eagle does a good job of pulling less than the two much more powerful 6700XT’s.
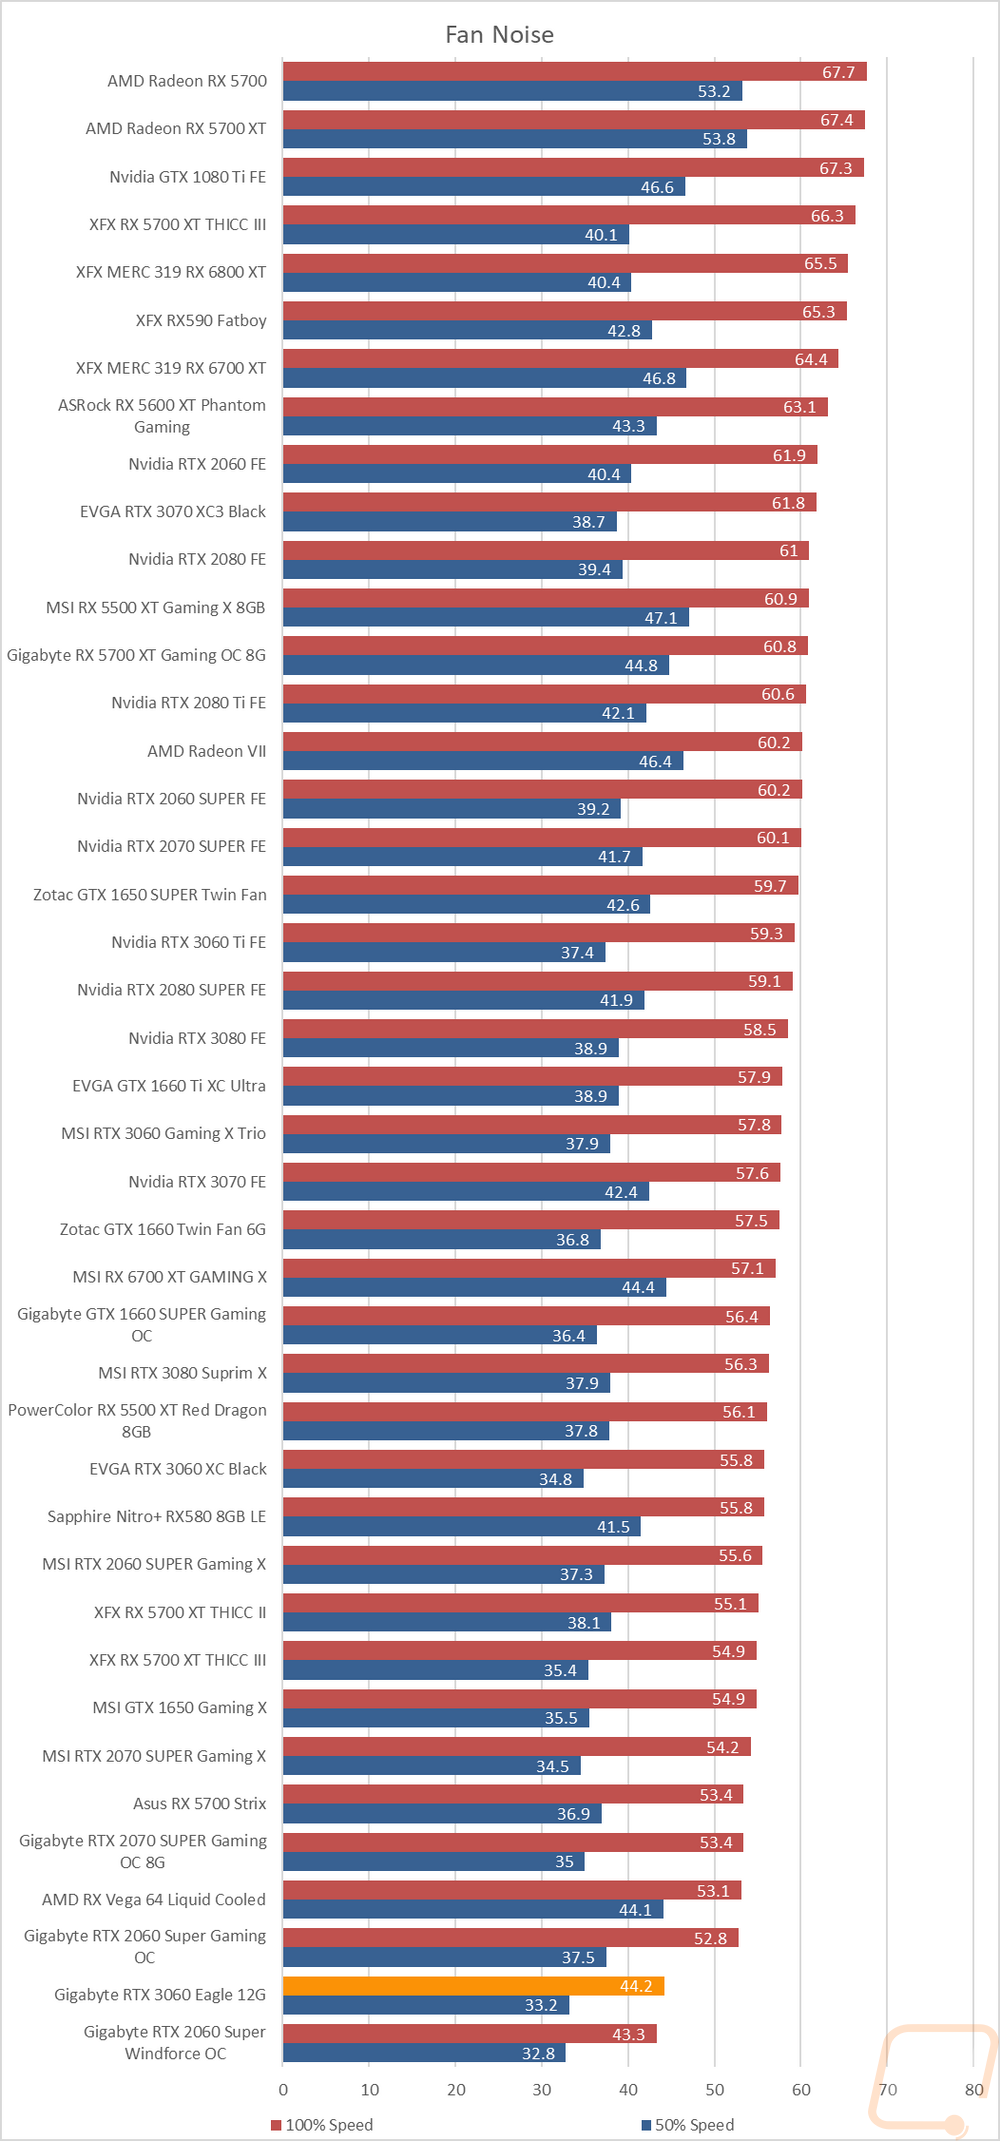
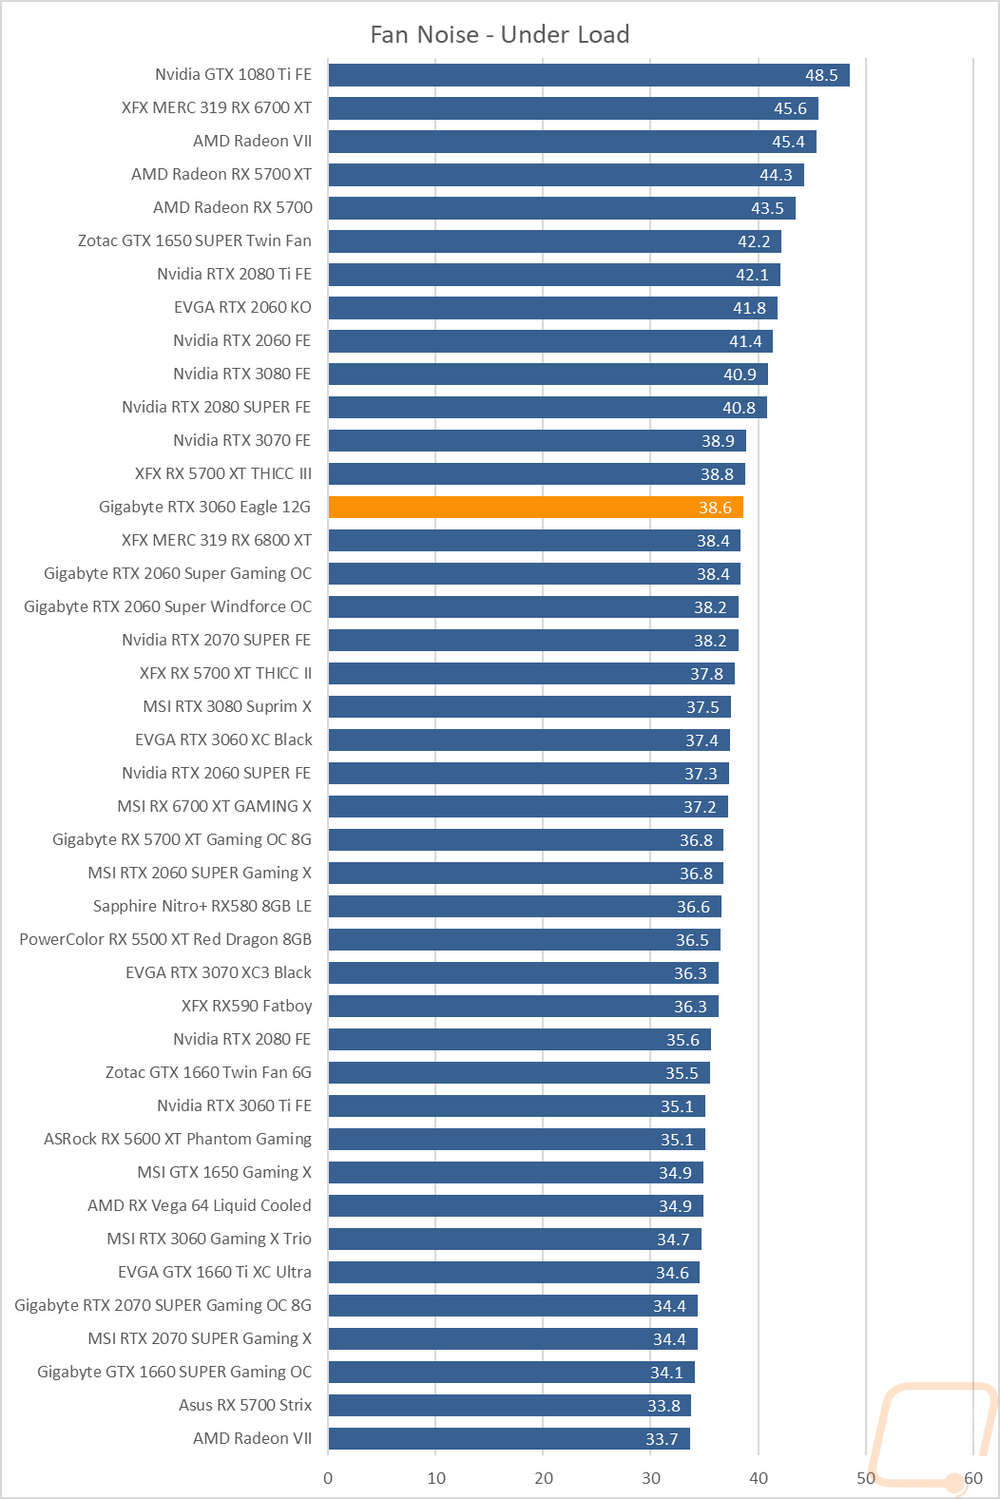
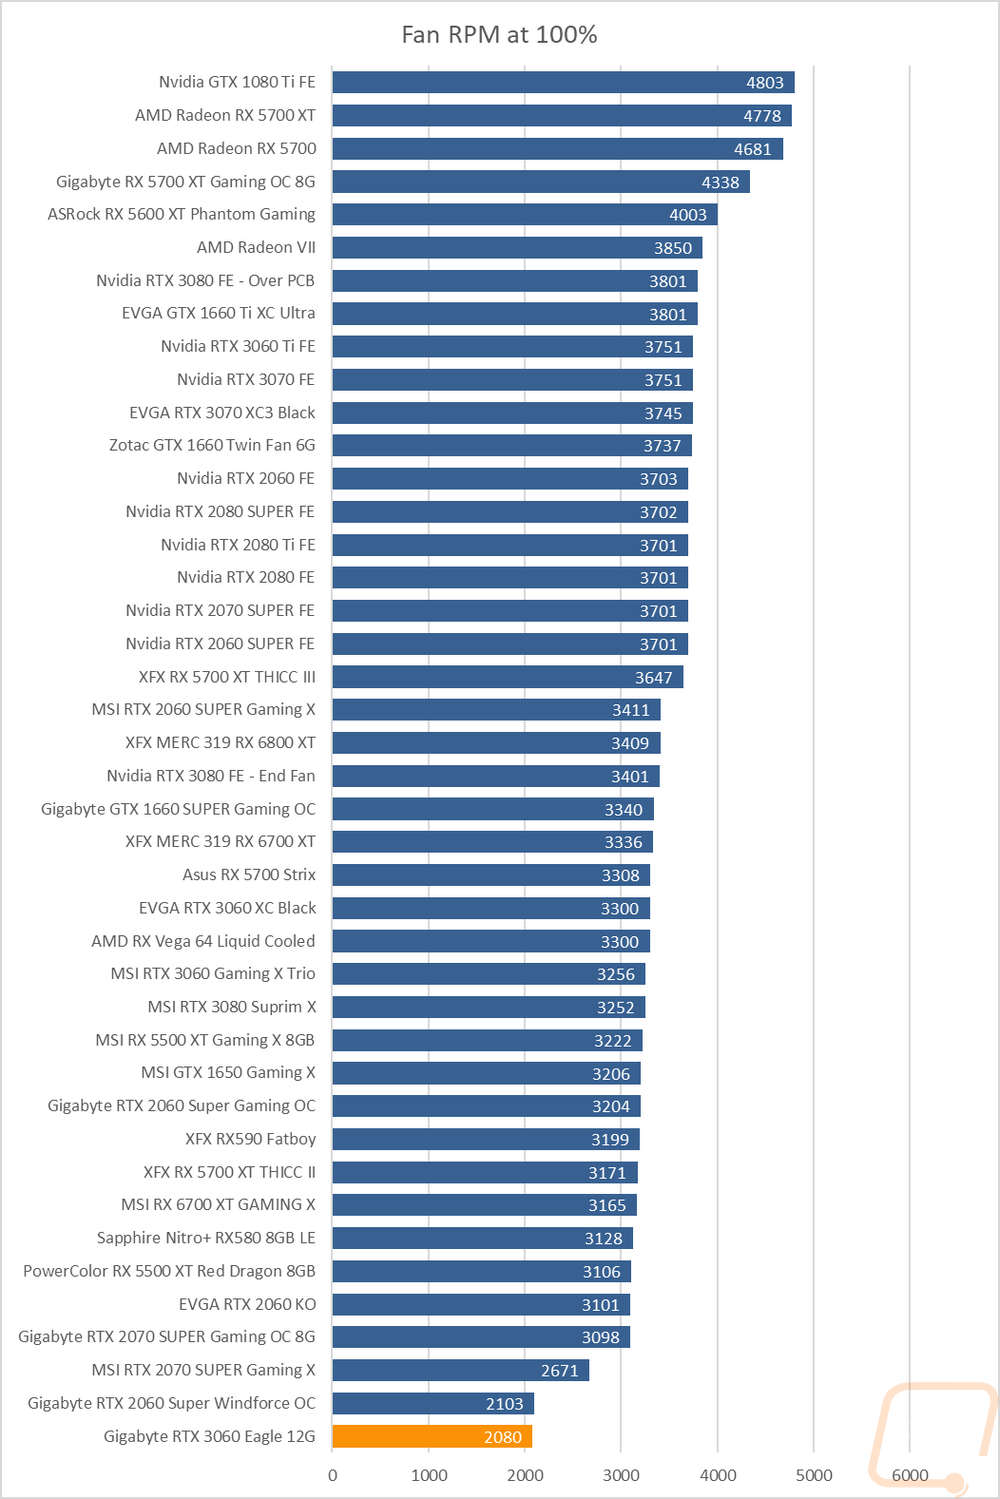
My next round of tests were looking at noise levels. These are especially important to me because I can’t stand to listen to my PC whirling. Especially when I’m not in game and other applications are using the GPU. For my testing, though I first tested with the fan cranked up to 100% to get an idea of how loud it can get, then again at 50% to get an idea of its range. The 3060 Eagle was quiet, both the 100% and 50% fan noise tests had the dual fan card down at the bottom of our charts. A quick look at the RPM chart tells us why with the two fans running significantly lower in RPM than almost everything else tested. The under load test on the other hand tells a different story, with the fans being worked a lot more with the lower RPM fans and the card ends up in the top 1/3 of the cards tested.
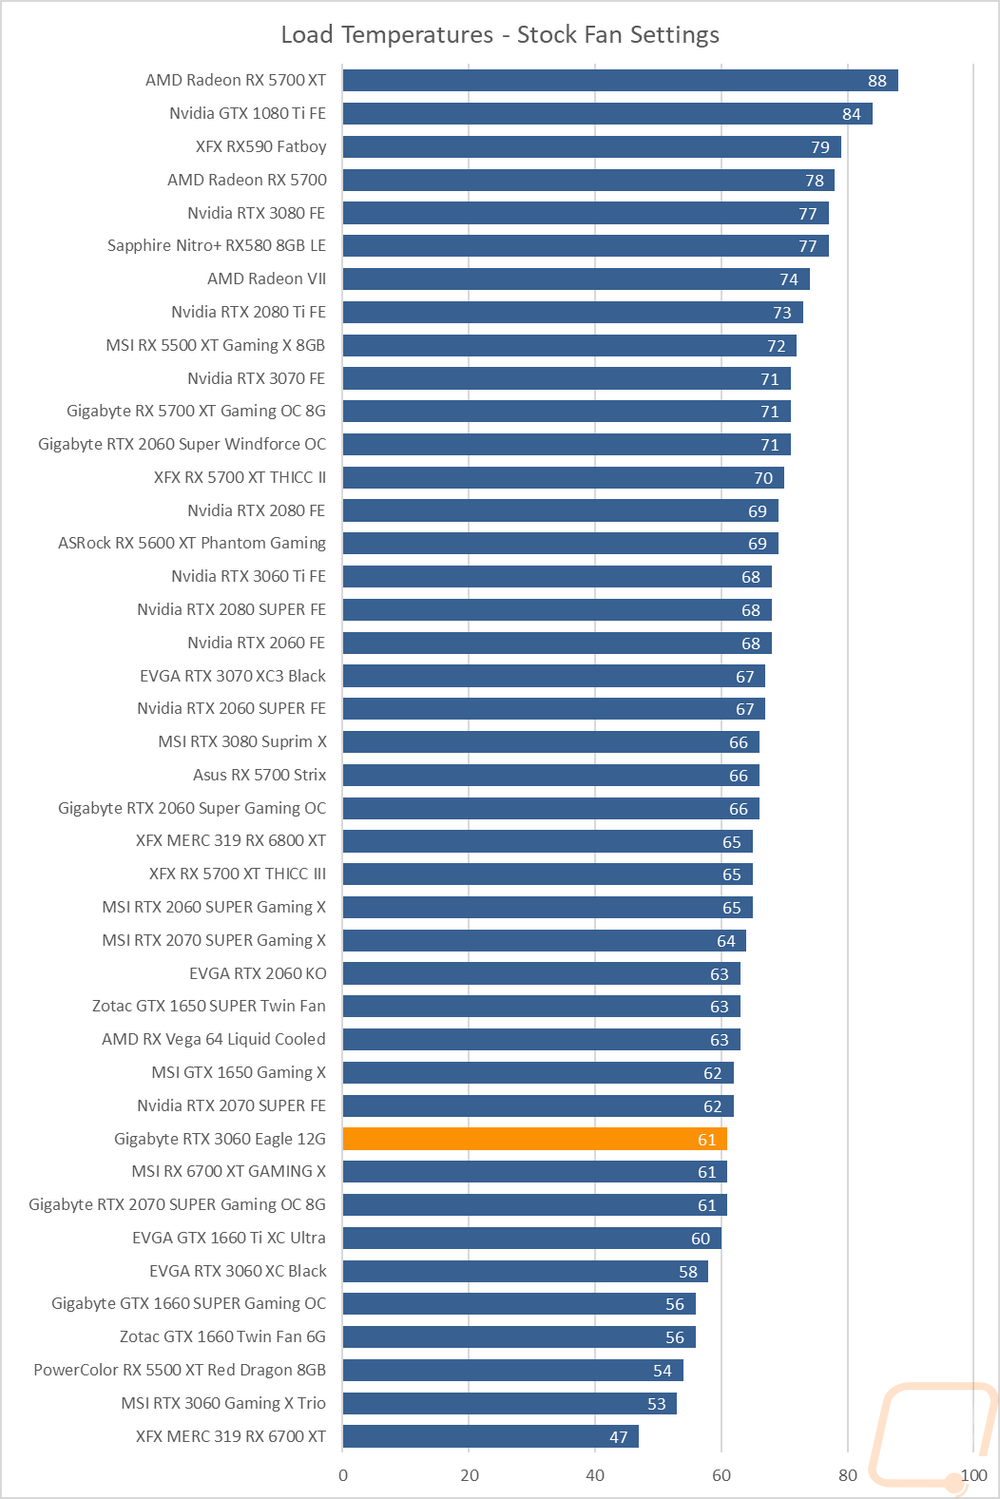
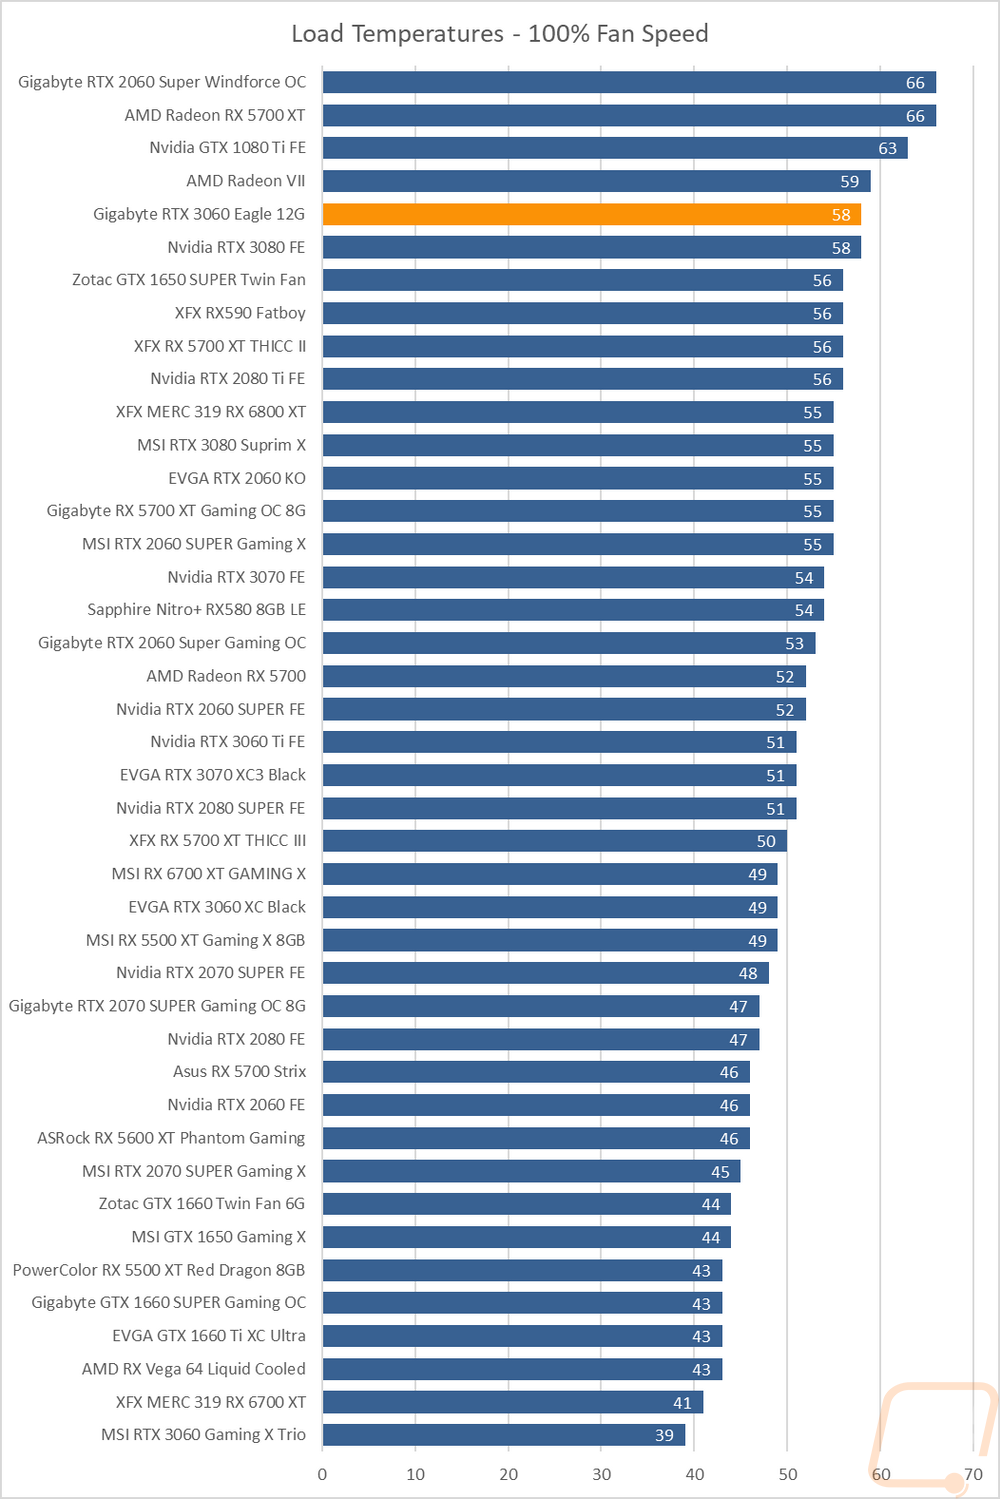
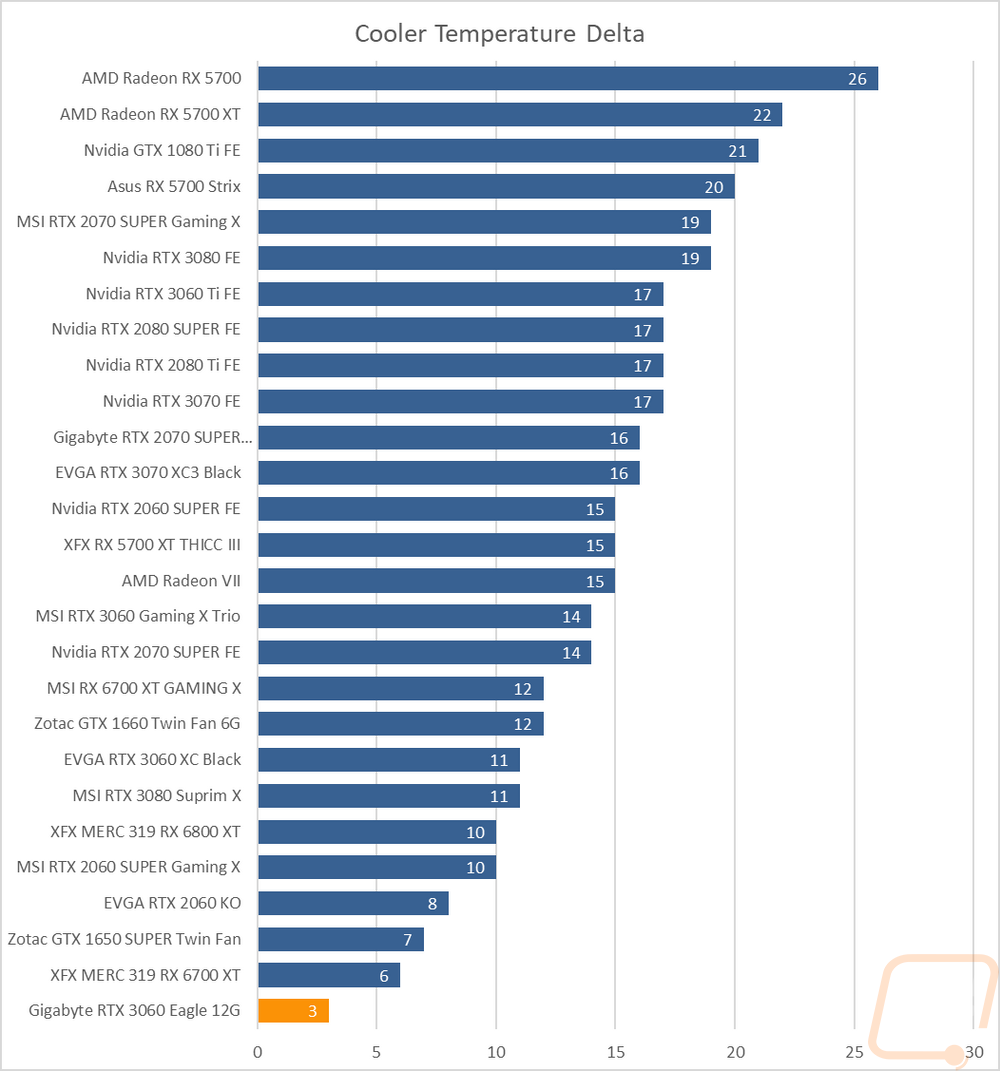
To finish up my testing I of course had to check out the cooling performance. To do this I ran two different tests. I used AIDA64’s Stress Test run for a half-hour each to warm things up. Then I documented what temperature the GPU leveled out at with the stock fan profile and then again with the fans cranked up to 100%. With the stock profile, the Gigabyte RTX 3060 Eagle 12G didn’t do too bad coming in at 61c but this was still warmer than the stock clocked EVGA and the MSI with the huge RTX 3090 cooler was of course even cooler than that. Cranking the fans up to 100% didn’t see the temperatures dropping down as much as you might expect as well with the 3060 Eagle going from the bottom 1/3 to near the top of the chart. The horizontal heatsink layout seems to have its limitations which are also contributing to the otherwise quiet fans running higher in RPM with the stock fan profile not leaving much room for the fans to speed up. The delta between the two was just 3 degrees. This is one of those it cools just fine, but I wouldn’t overclock things. There just isn’t the head room.
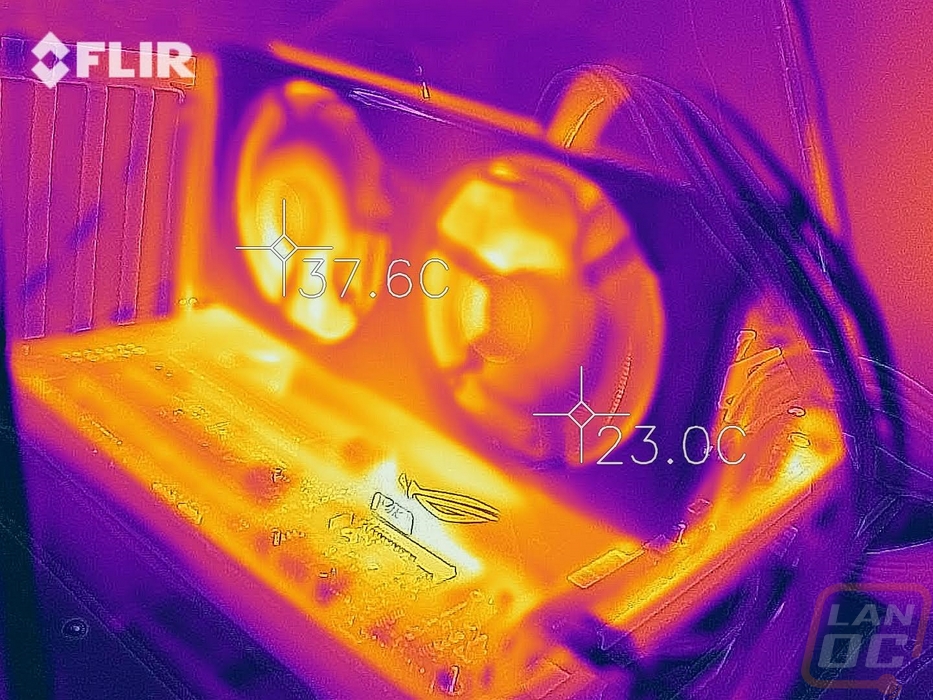
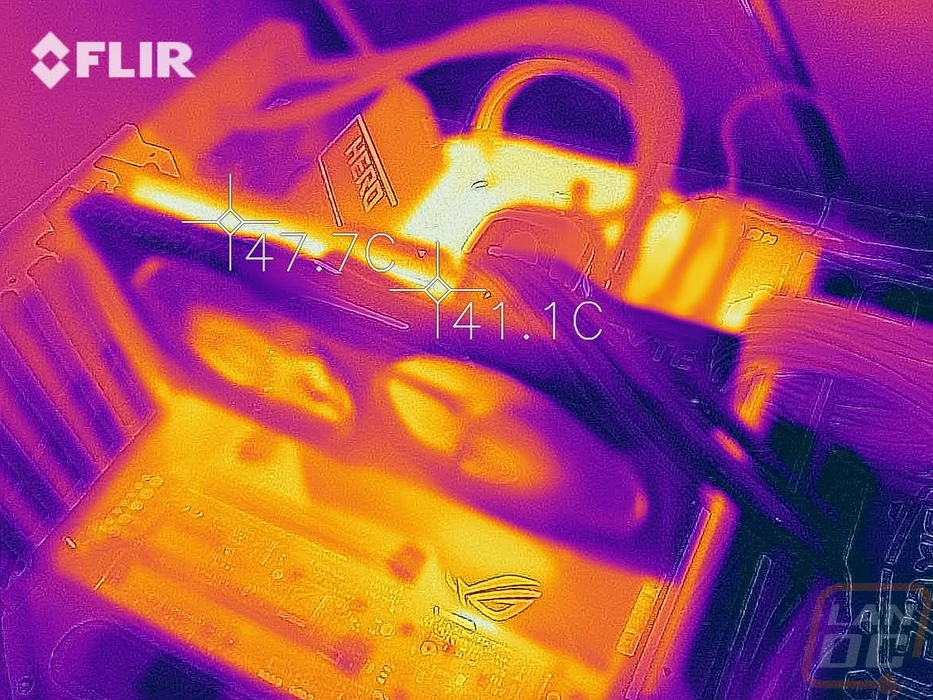
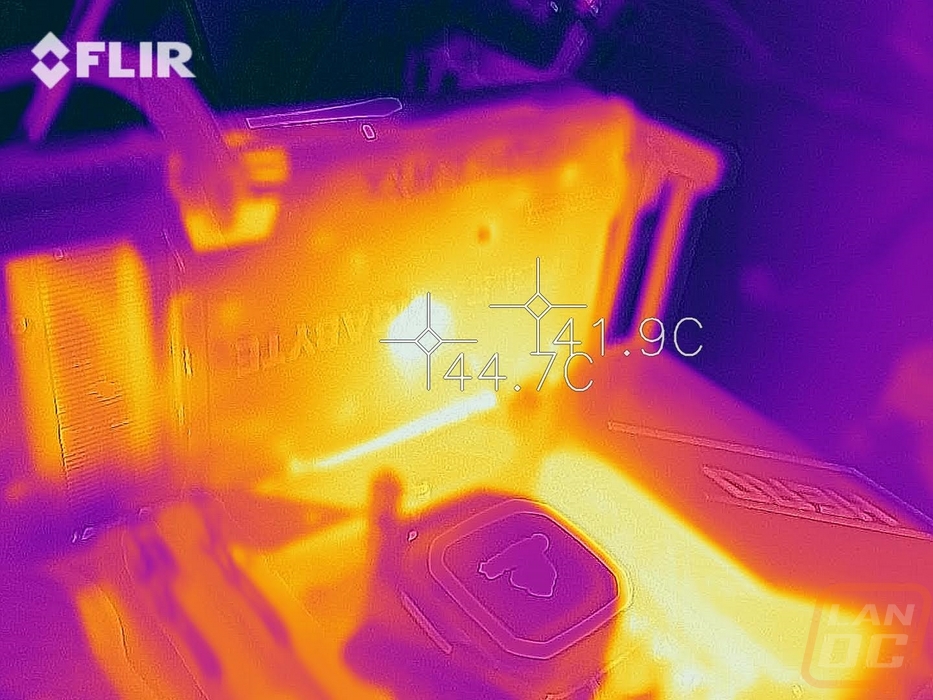
While running the stock fan profile testing I also took the time to get a few thermal images so we could see what is going on. Right away on the fan side, you can see that there isn’t as big of a hot spot up under the card like vertical heatsink designs will have. We can also see that opening in the backplate from the fan side with that area running much cooler. The top edge view lets us look down and see the heat from the heatsink which is much warmer on the left side where the power, GPU, and memory are all at. But we also don’t see the wires up on top of the shroud getting as much of that heat because it doesn’t blow up. The backplate being plastic does insulate things but we can still see a hot spot where the GPU is at.