In-Game Benchmarks
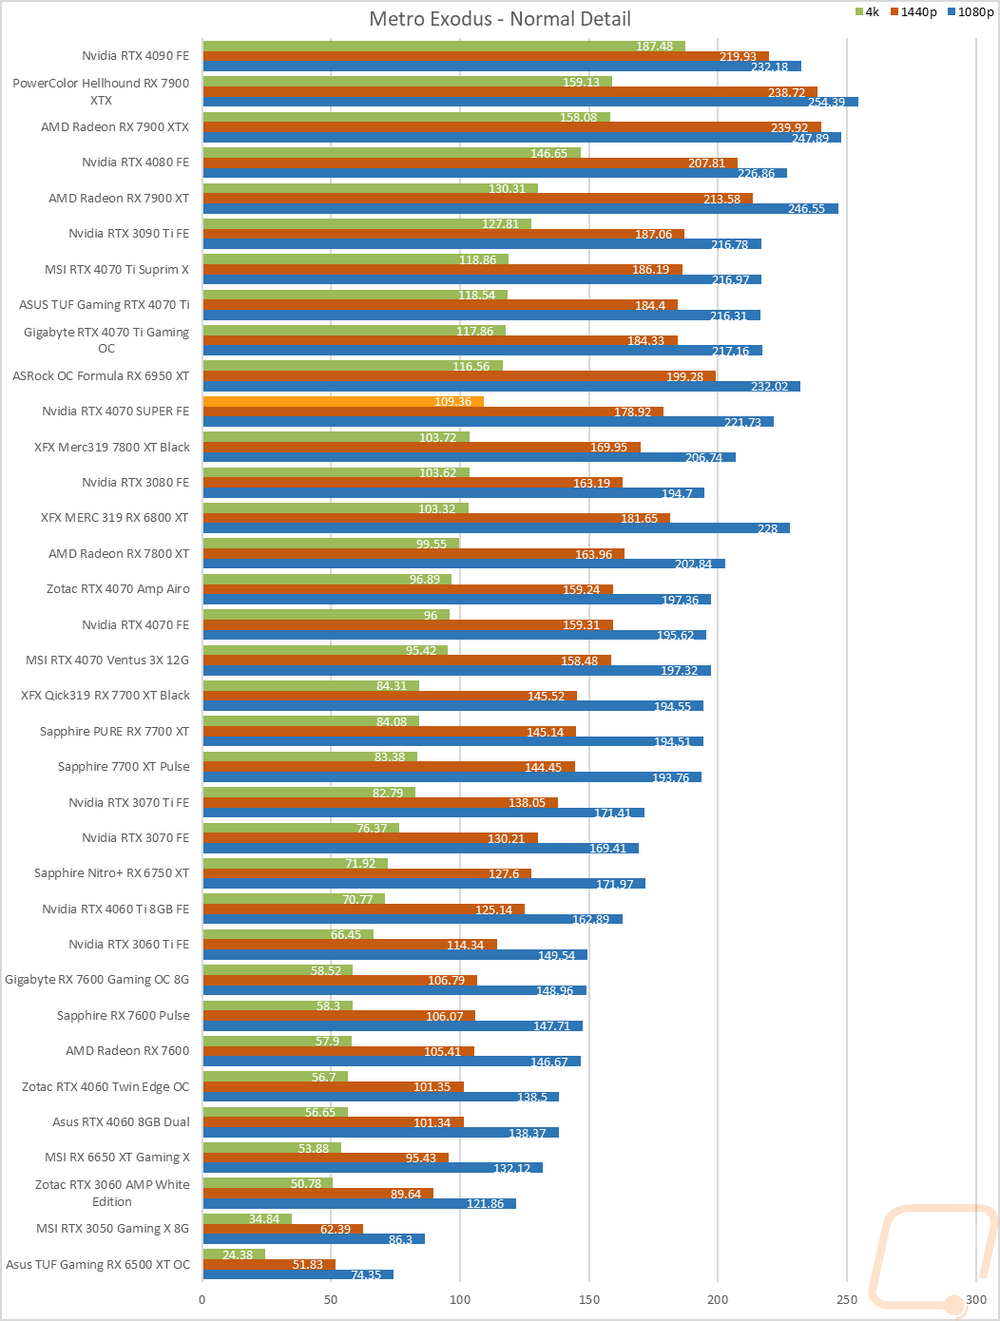
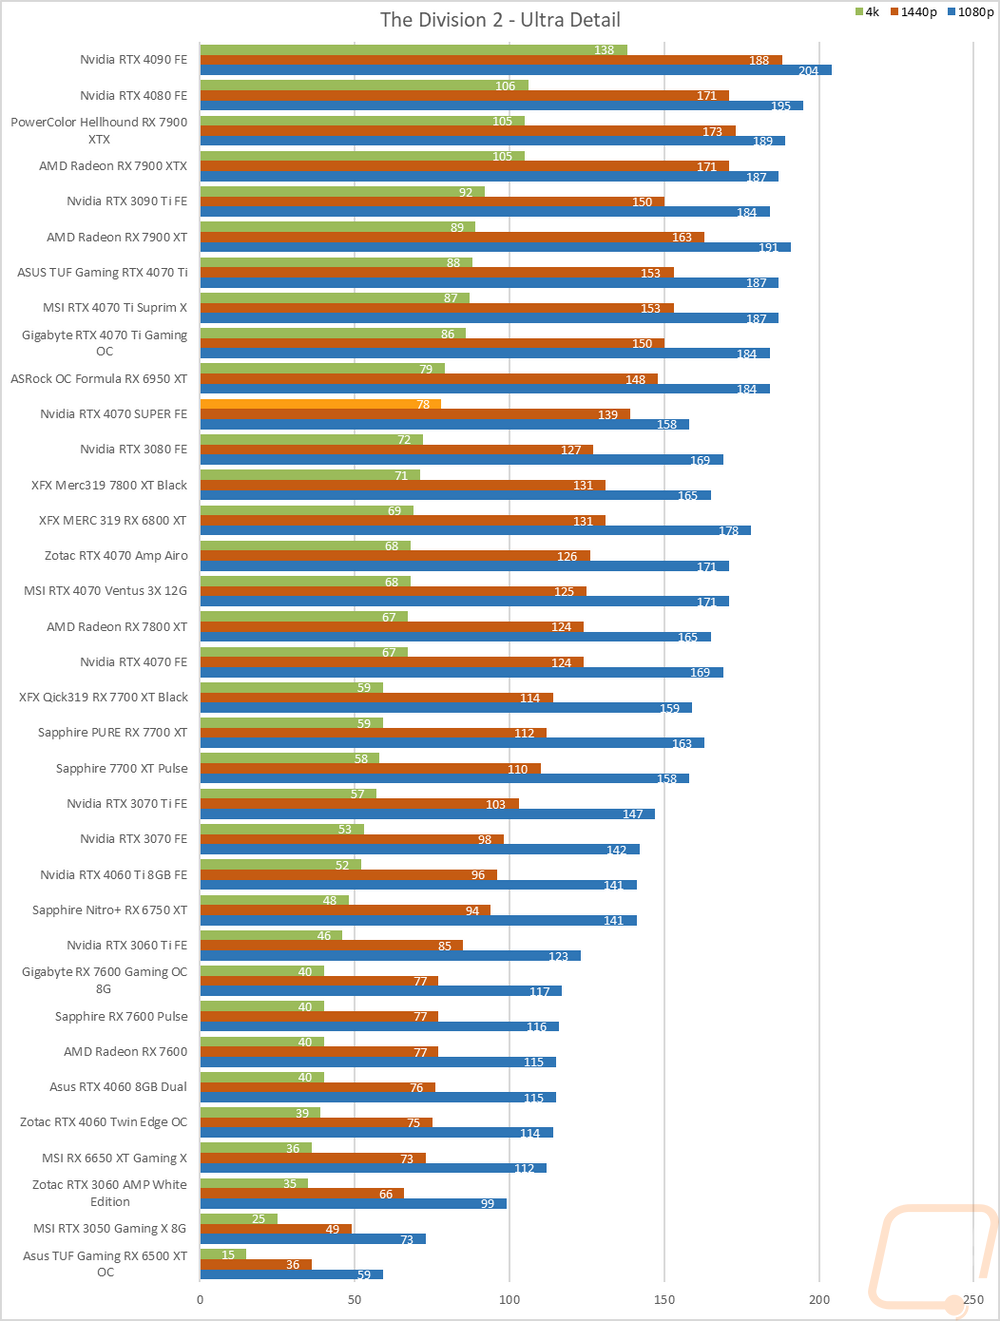
Now we finally get into the in game performance and that is the main reason people pick up a new video card. To test things out I ran through our new benchmark suite that tests 10 games at three different resolutions (1080p, 1440p, and 4k). Most of the games tested have been run at the highest detail setting and a mid-range detail setting to get a look at how turning things up hurts performance and to give an idea of whether turning detail down from max will be beneficial for frame rates. In total, each video card is tested 48 times and that makes for a huge mess of results when you put them all together. To help with that I like to start with these overall playability graphs that take all of the results and give an easier-to-read result. I have one for each of the three resolutions and each is broken up into four FPS ranges. Under 30 FPS is considered unplayable, over 30 is playable but not ideal, over 60 is the sweet spot, and then over 120 FPS is for high refresh rate monitors.
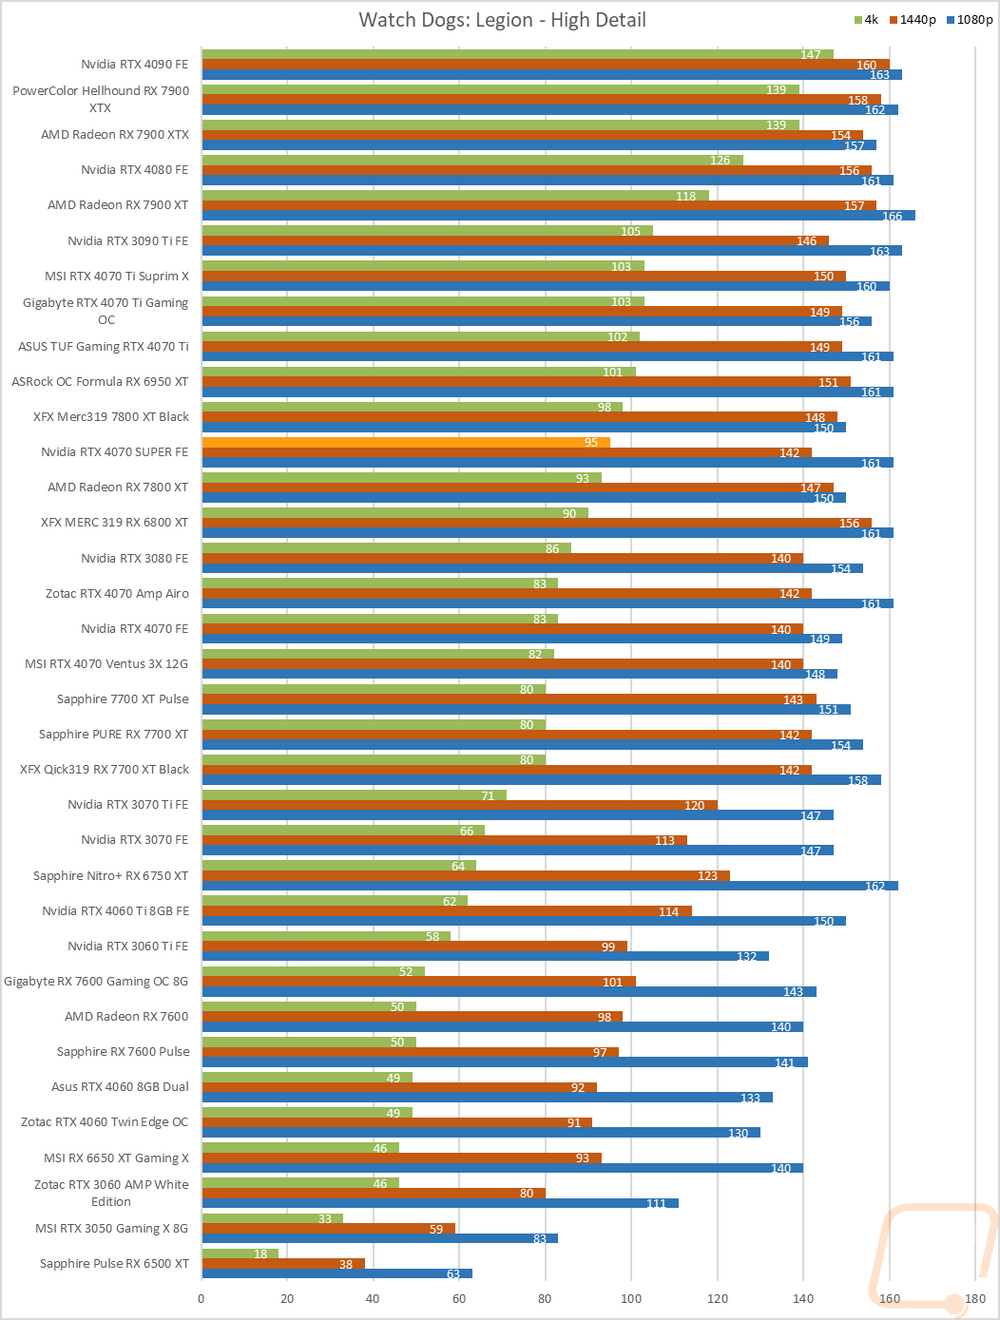
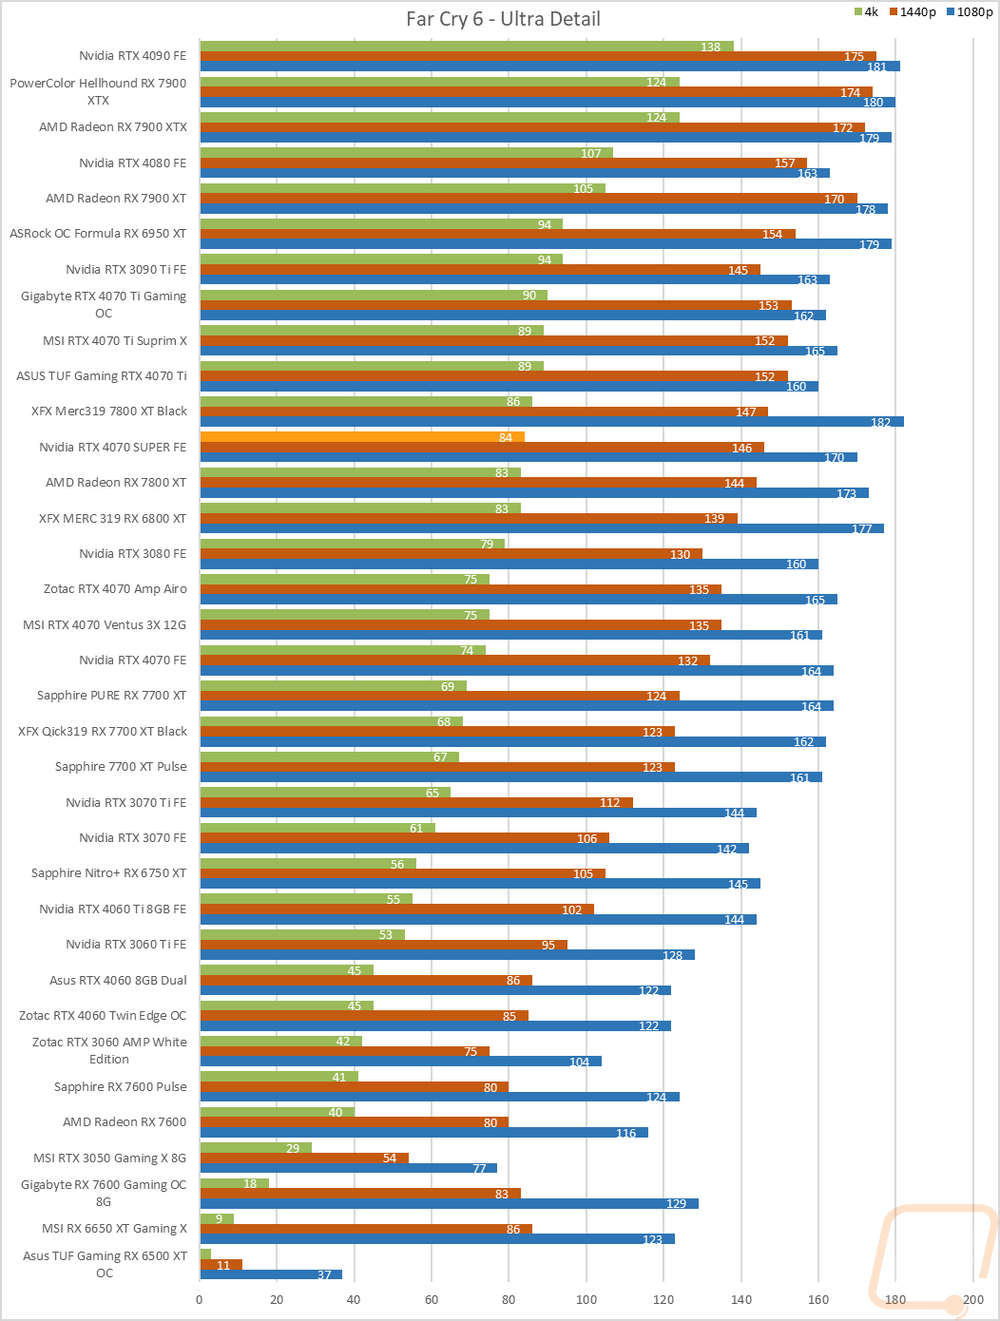
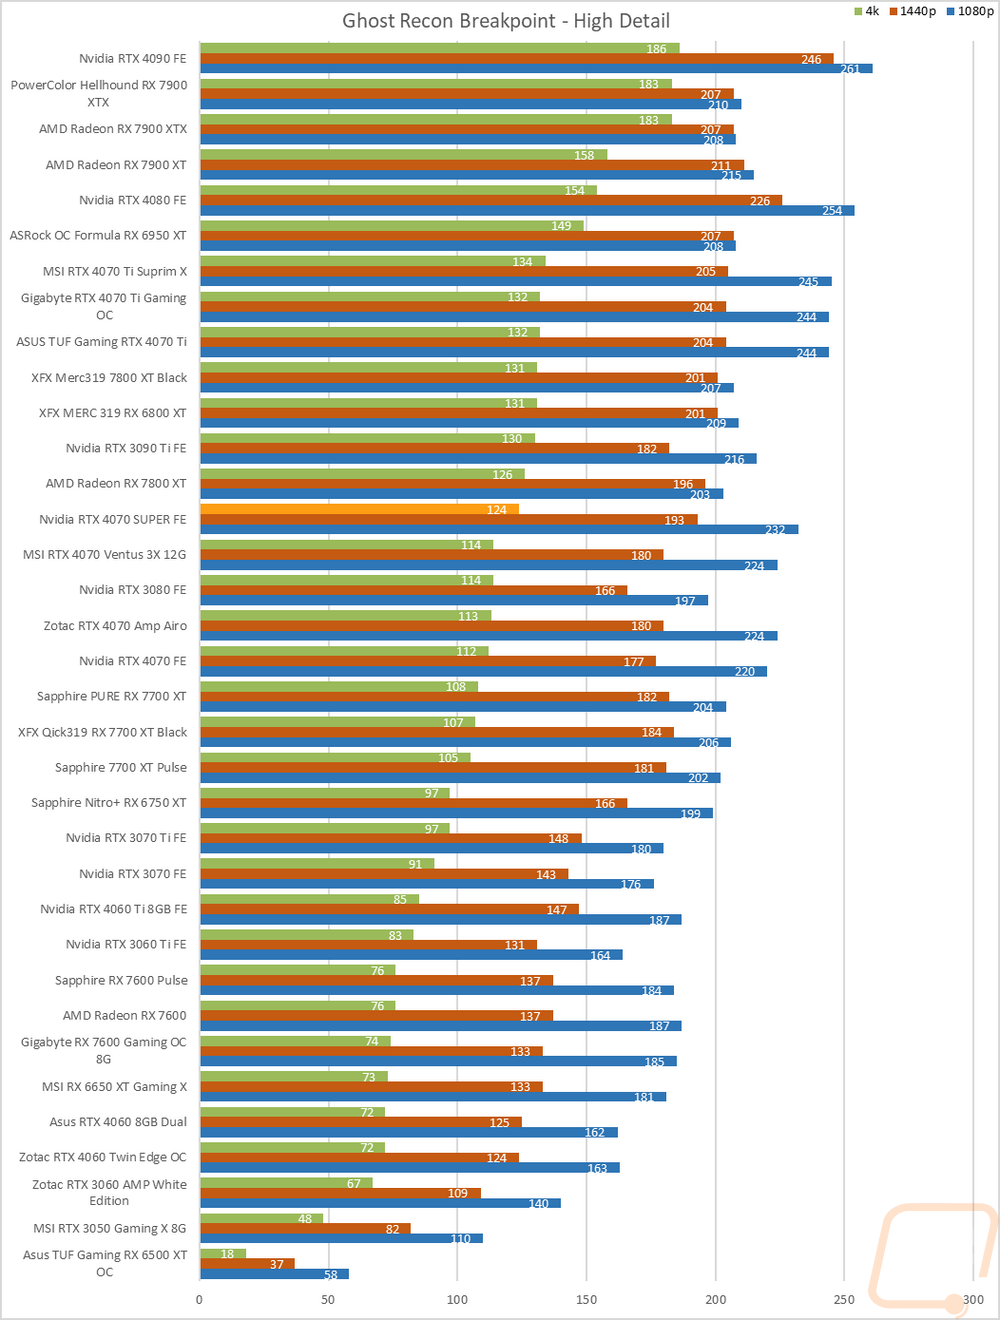
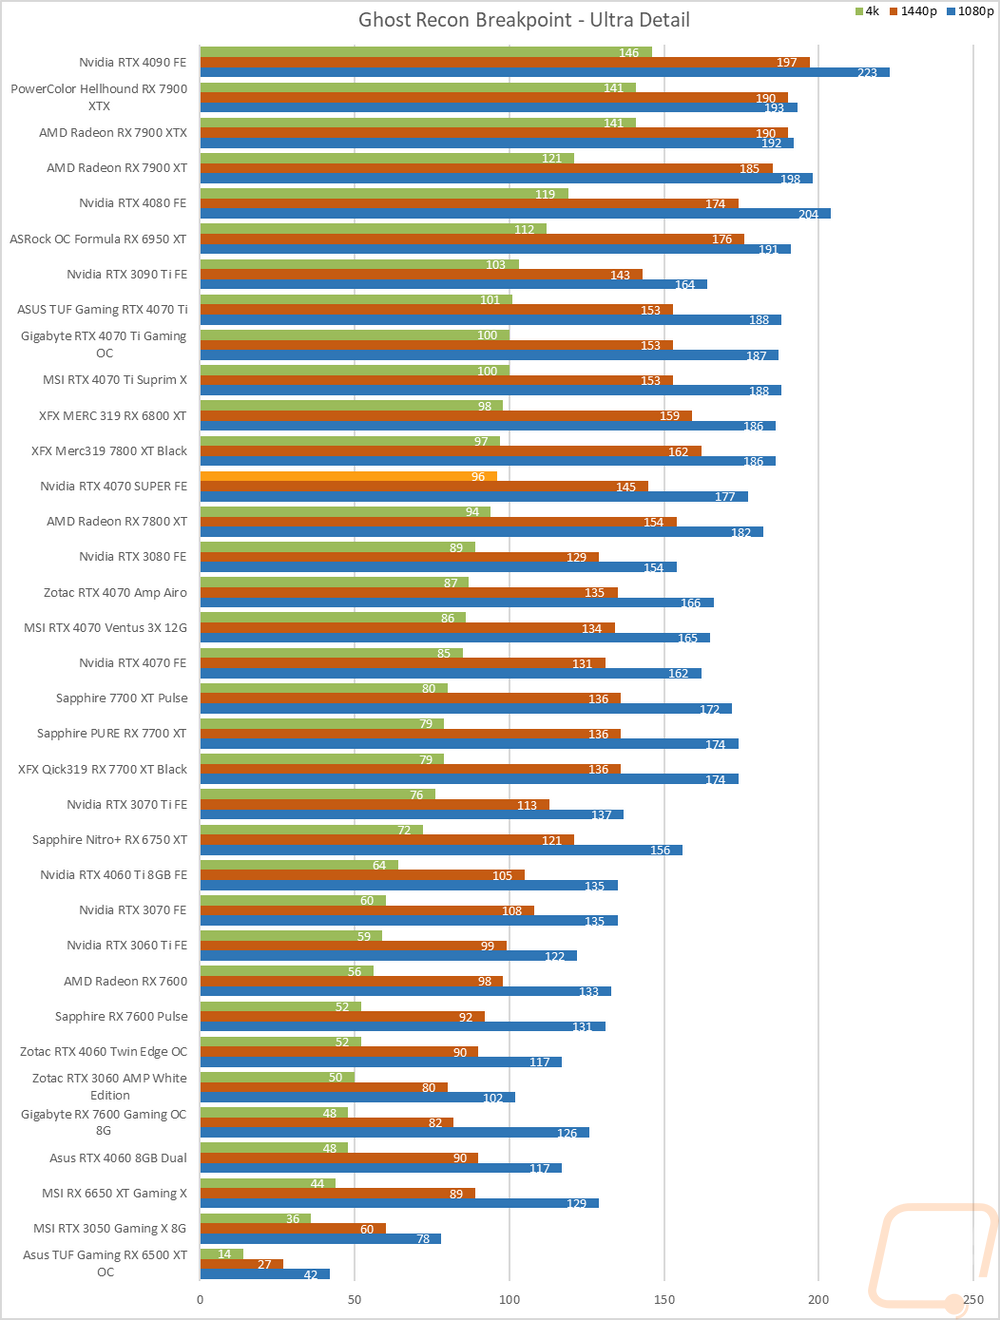
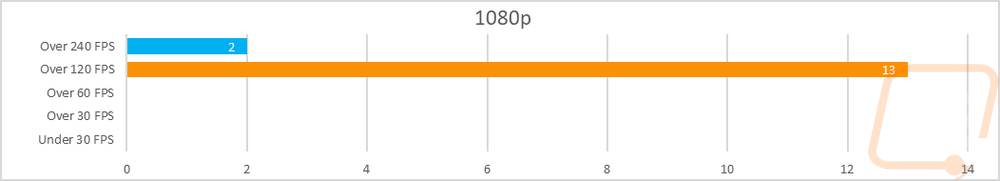
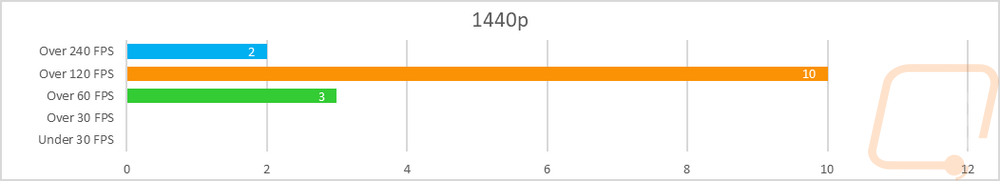
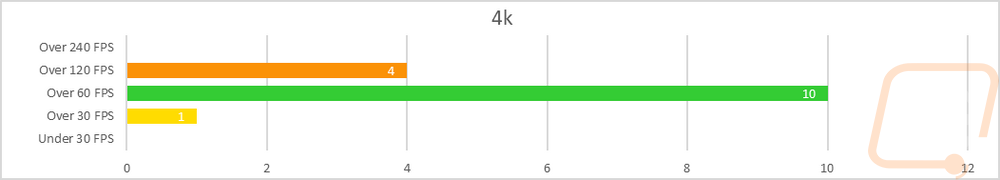
So how did the RTX 4070 SUPER Founders Edition do? Well no big surprises at 1080p, none of the games tested even at their highest detail settings proved to be a problem. Two of the results were up over 240 FPS and the rest were over 120 FPS. At 1440p we see more of a mix but the RTX 4070 SUPER Founders Edition still did really well, everything was smooth and over 60 FPS with 3 results in the 60 FPS range, 10 over 120 FPS, and two again over 240 FPS. Then at 4k, the RTX 4070 SUPER Founders Edition had just one result come in that 30-50 FPS range. 10 results were over 60 FPS and 4 were even higher in the over 120 FPS range. In other words, the RTX 4070 SUPER Founders Edition can handle all three resolutions well with high refresh 1080p and 1440p being its sweet spot.
Of course, I have all of the actual in game results as well for anyone who wants to sort through the wall of graphs below. I also have averaged out all of the results for the RTX 4070 SUPER Founders Edition along with the original RTX 4070 FE, RTX 4070 Ti, and the RX 7800 XT from AMD which is in the same price range as the 4070 SUPER. The 4070 Ti is still out ahead of all of the cards, no surprises there but the gap isn’t too much with just 9 FPS at 1440p and 8 FPS at 1080p, even at 4K the gap is 7 FPS. The 4070 SUPER averaged higher than the RX 7800 XT in all of the tests and is even farther away from the RTX 4070.
|
Average FPS |
1080P |
1440p |
4K |
|
RTX 4070 Founders Edition |
190.6 |
147.6 |
83.5 |
|
AMD RX 7800 XT |
190.7 |
156.3 |
89.3 |
|
RTX 4070 SUPER Founders Edition |
202.7 |
163.6 |
96 |
|
ASUS TUF Gaming RTX 4070 Ti |
210.7 |
174.1 |
103.6 |