Cooling Noise and Power
For my last few tests, rather than focusing on in game performance, I like to check out other aspects of video card performance. These are also the most important ways to differentiate the performance between cards that have the same GPU. To start things off I took a look at power usage.
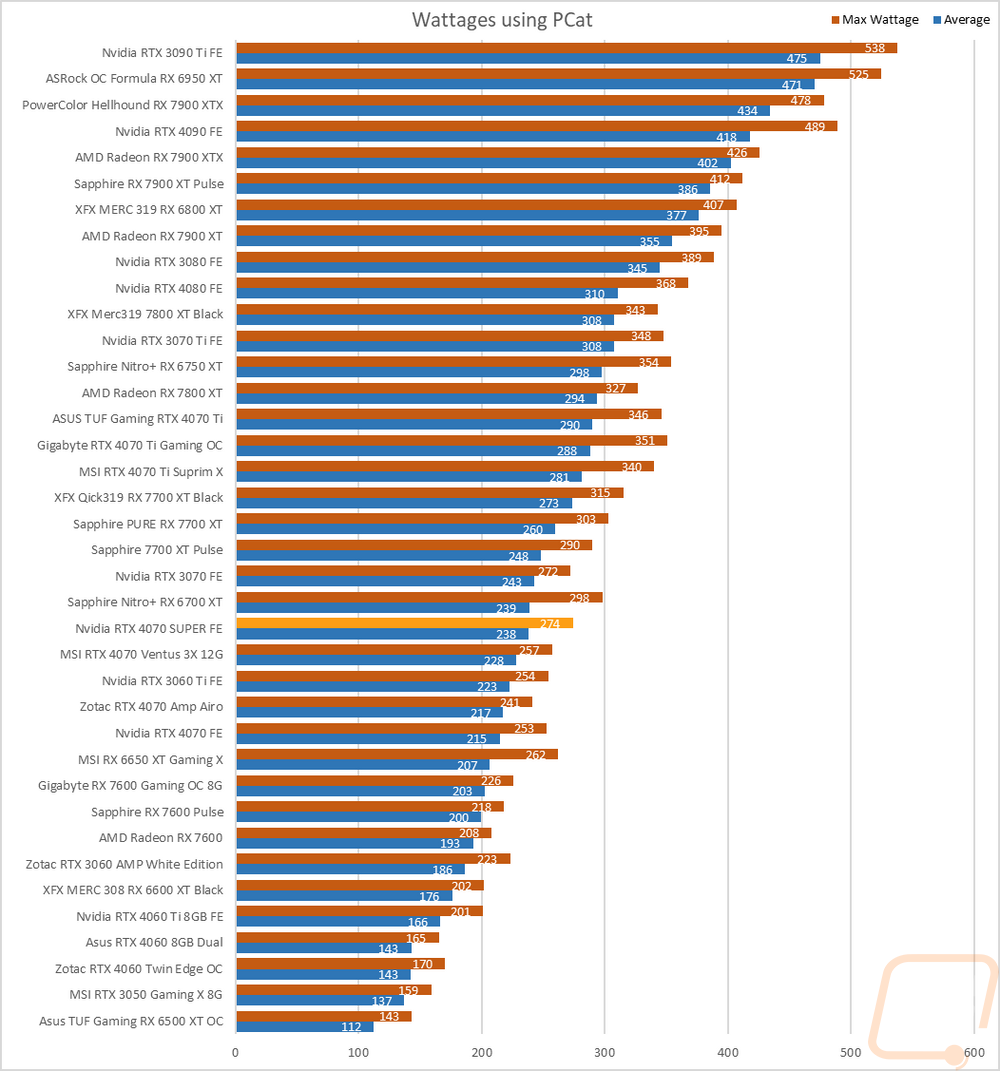
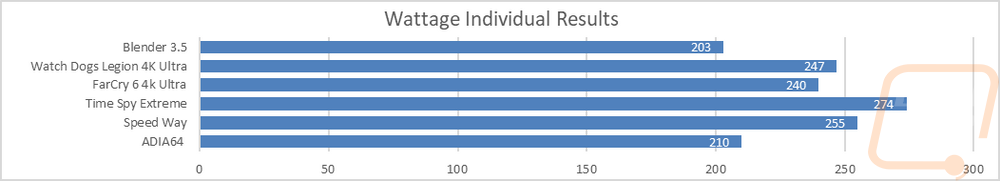
For this, our new test setup utilizes the Nvidia-designed PCat v2 along with cables to handle both traditional 6 or 8-pin connections as well as the new 12VHPWR. The PCat also utilizes a PCIe adapter to measure any power going to the card through the PCIe slot so we can measure the video card wattage exclusively, not the entire system as we have done in the past. I test with a mix of applications to get both in game, synthetic benchmarks, and other workloads like Blender and AIDA64. Then everything is averaged together for our result. I also have the individual results for this specific card and I document the peak wattage result as well which is almost always Time Spy Extreme. The RTX 4070 SUPER Founders Edition has a 20-watt higher TGP than the original RTX 4070 and our average wattage was just about spot on for that. It averaged across all of the tests 238 watts where the RTX 4070 did 215 so it's just 3 watts off from the 20 watts and the peak wattage was 274 for the RTX 4070 SUPER Founders Edition and 253 for the original RTX 4070. For comparison, because I have been comparing the RTX 4070 SUPER Founders Edition to the RX 7800 XT in our other tests, the 7800 XT averaged 294 watts and peaked at 327 watts, 56 watts higher on the average and 53 watts higher on the peak.
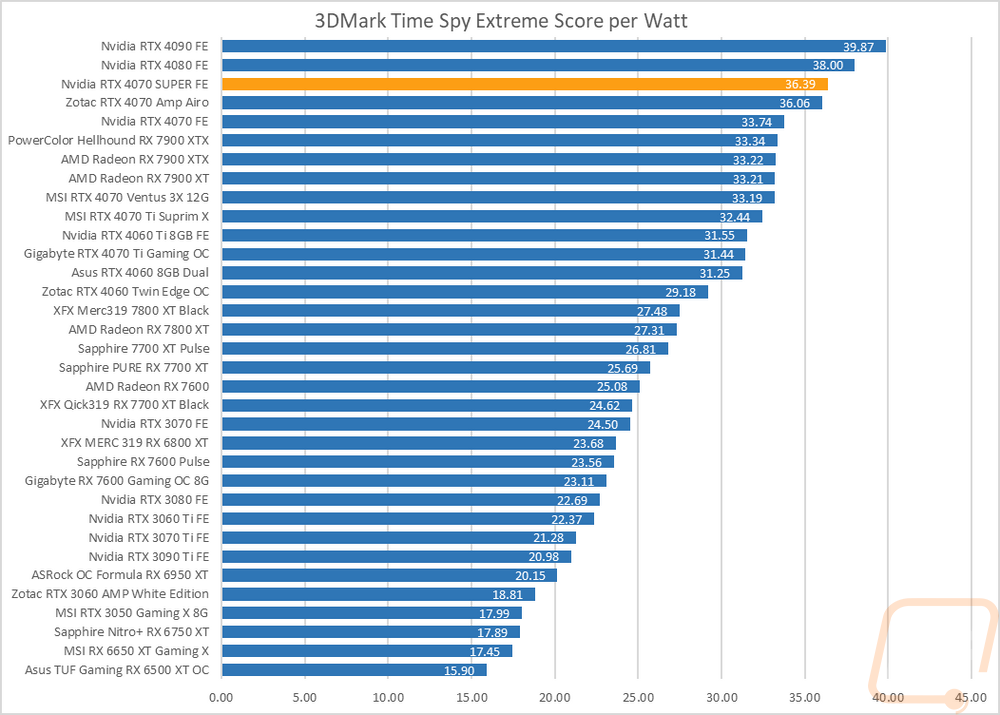
With having exact peak wattage numbers when running Time Spy Extreme I was also able to put together a graph showing the total score for each watt that a card draws which gives us an interesting look at overall power efficiency in the popular and demanding benchmark. The 4000 Series cards, especially when not overclocked have been at the top of our performance-to-watt chart but the first of the SUPER cards with a big bump in cores and not much of a wattage increase did really well here and is behind just the RTX 4080 and RTX 4090. More than anything though it makes me curious to see how the RTX 4080 SUPER and RTX 4070 Ti SUPER will do when both of those cards aren’t changing their wattages with the improved performance.
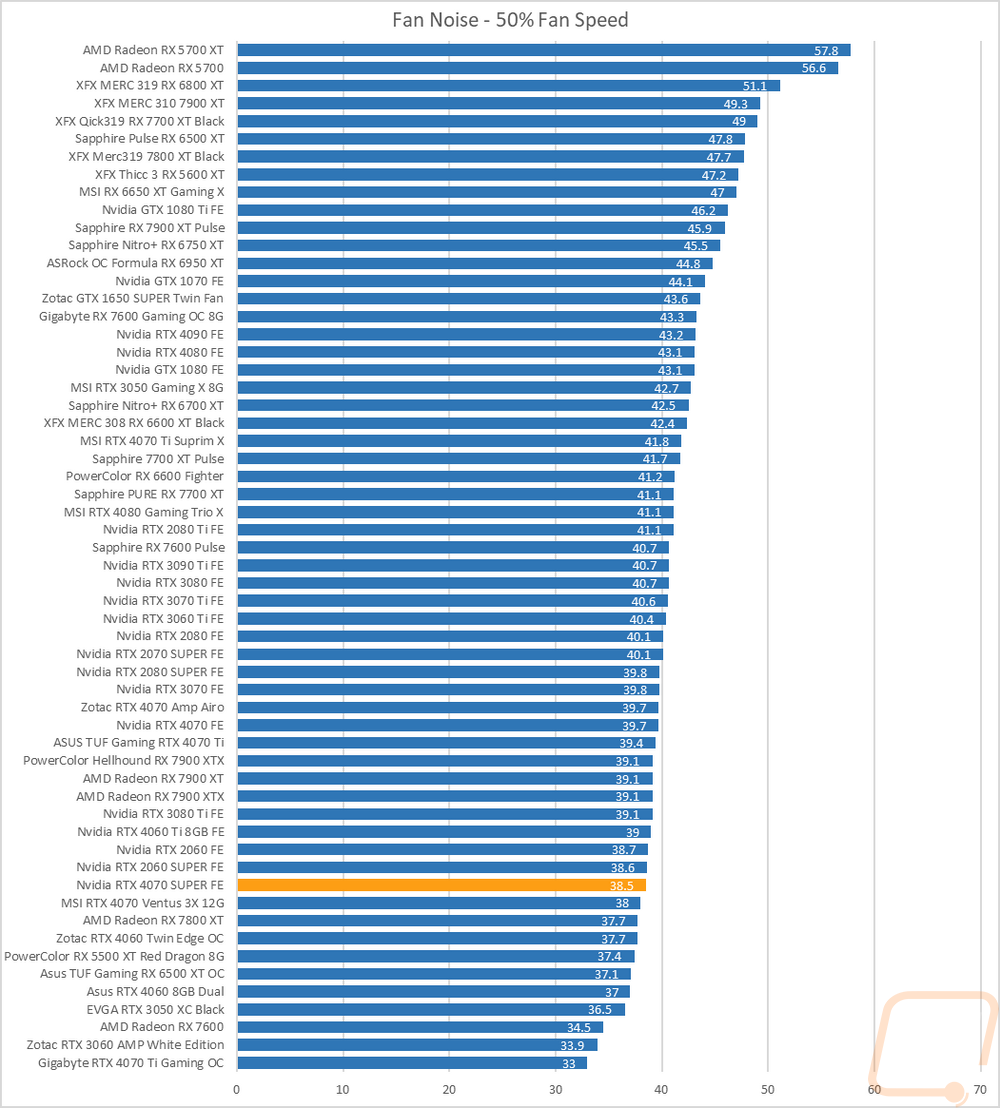
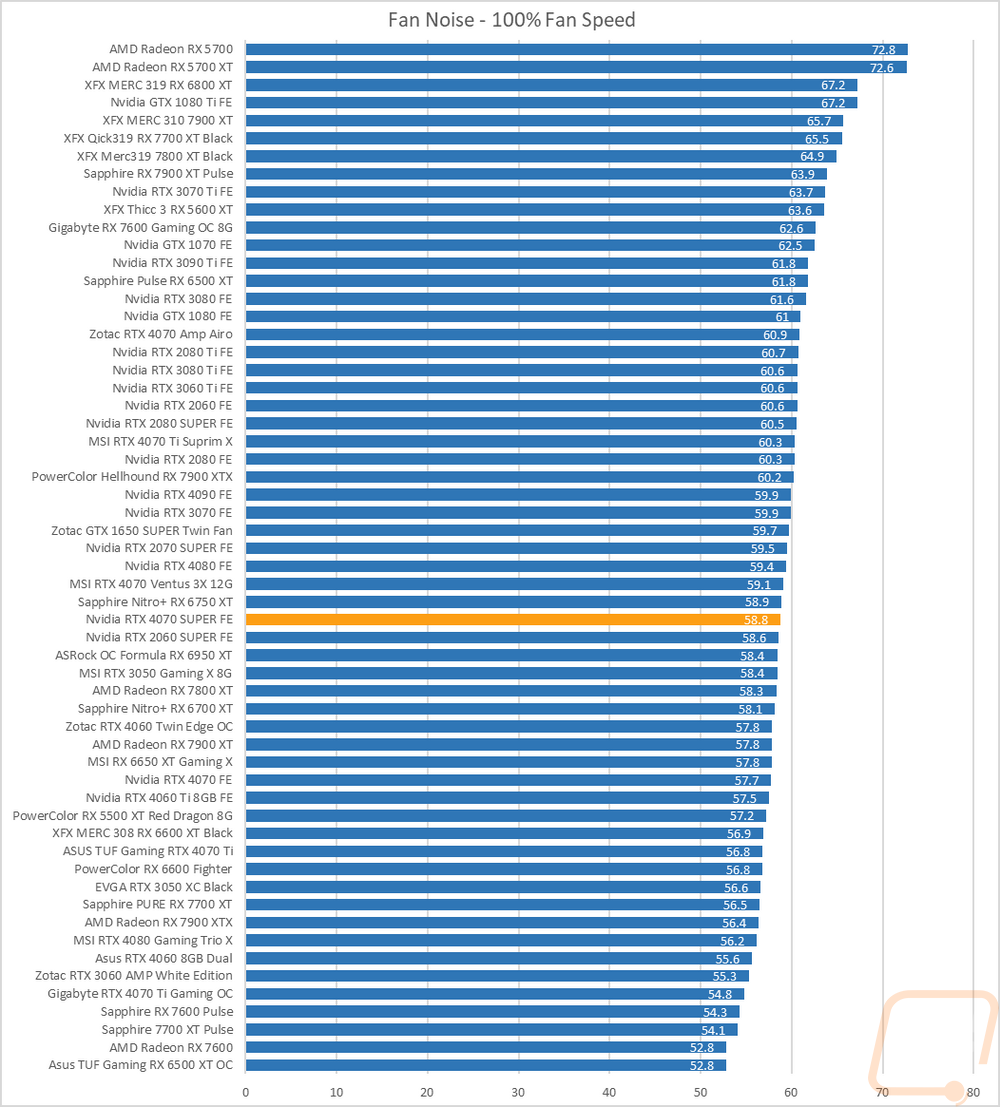
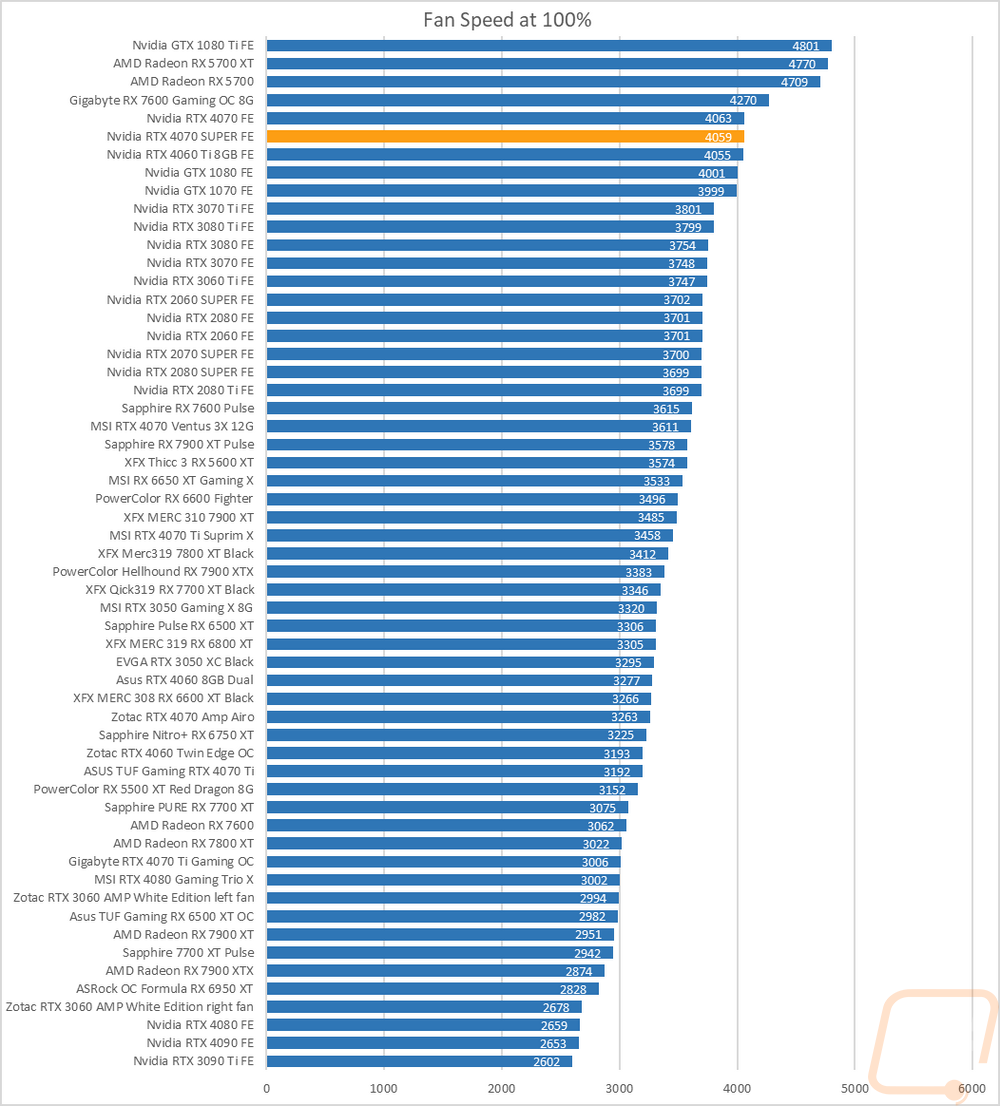
My next round of tests were looking at noise levels. These are especially important to me because I can’t stand to listen to my PC whirling. Especially when I’m not in game and other applications are using the GPU. For my testing, though I first tested with the fan cranked up to 100% to get an idea of how loud it can get, then again at 50% to get an idea of its range. The RTX 4070 SUPER Founders Edition runs at a blistering fast 4059 RPM when the fans are cranked up to 100% which puts it up near the top of the fan speed charts but surprisingly it is in the middle of the pack for 100% fan speed noise levels. It did even better when running at 50% fan speed with it down in the bottom 1/3 in that chart. The card also turns the fans off when under little to no load which helps keep things even quieter when out of game as well.
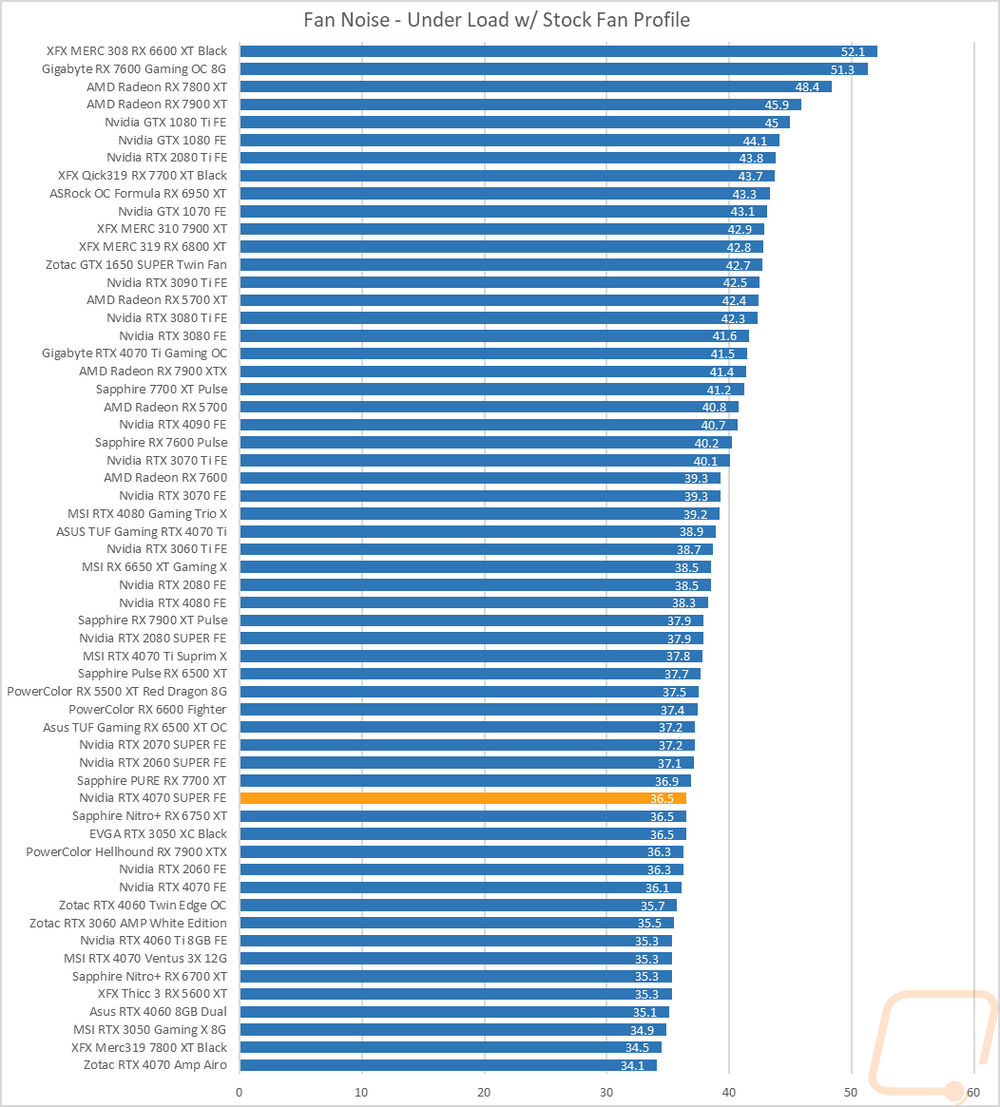
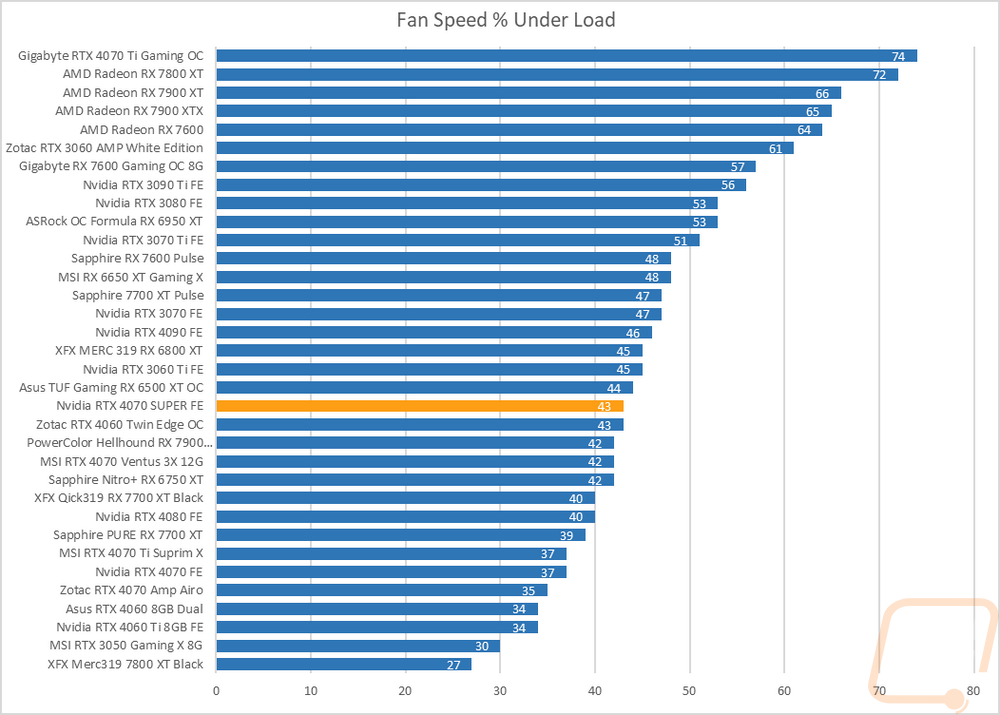
I also take a look at noise performance while under load. For that when running AIDA64’s stress test I wait until the temperature of the card has leveled off and then measure how loud things are when the card is at its worst-case scenario with the stock fan profile. Here the RTX 4070 SUPER Founders Edition came in at 36.5 db which put it in just barely in the bottom 1/3 of the chart but slightly louder than the original RTX 4070 which was at 36.1 db. Under load, the fans leveled out at 43% of their total speed which helps keep things running quiet.
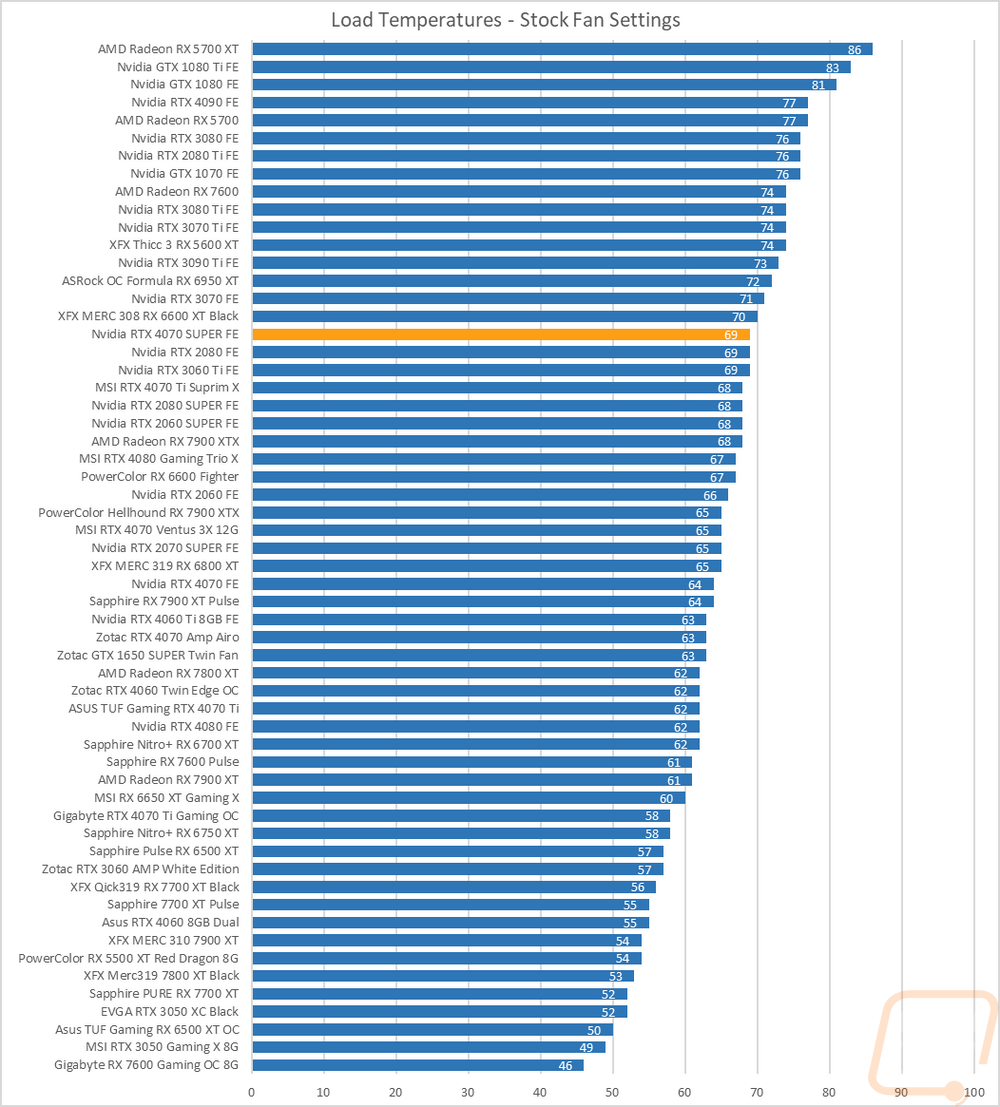
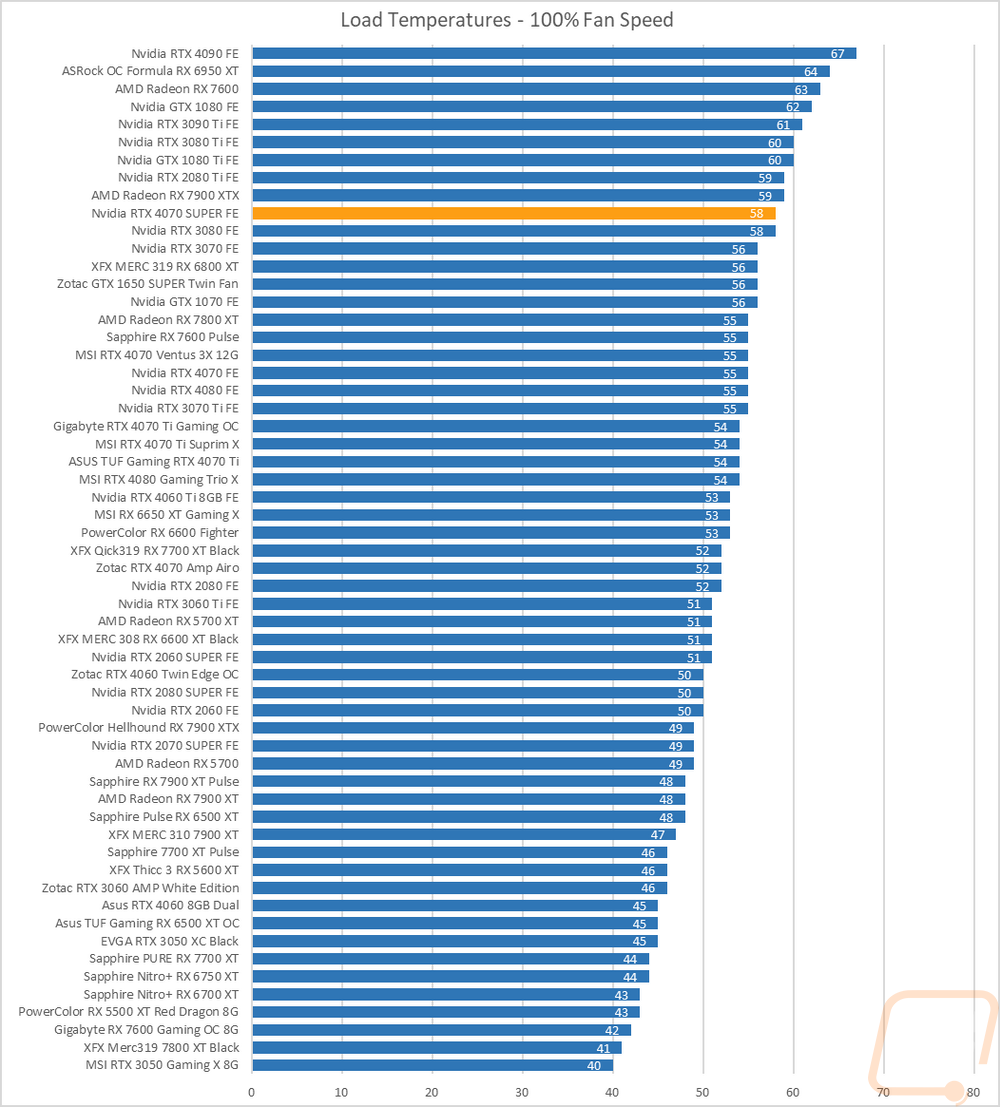
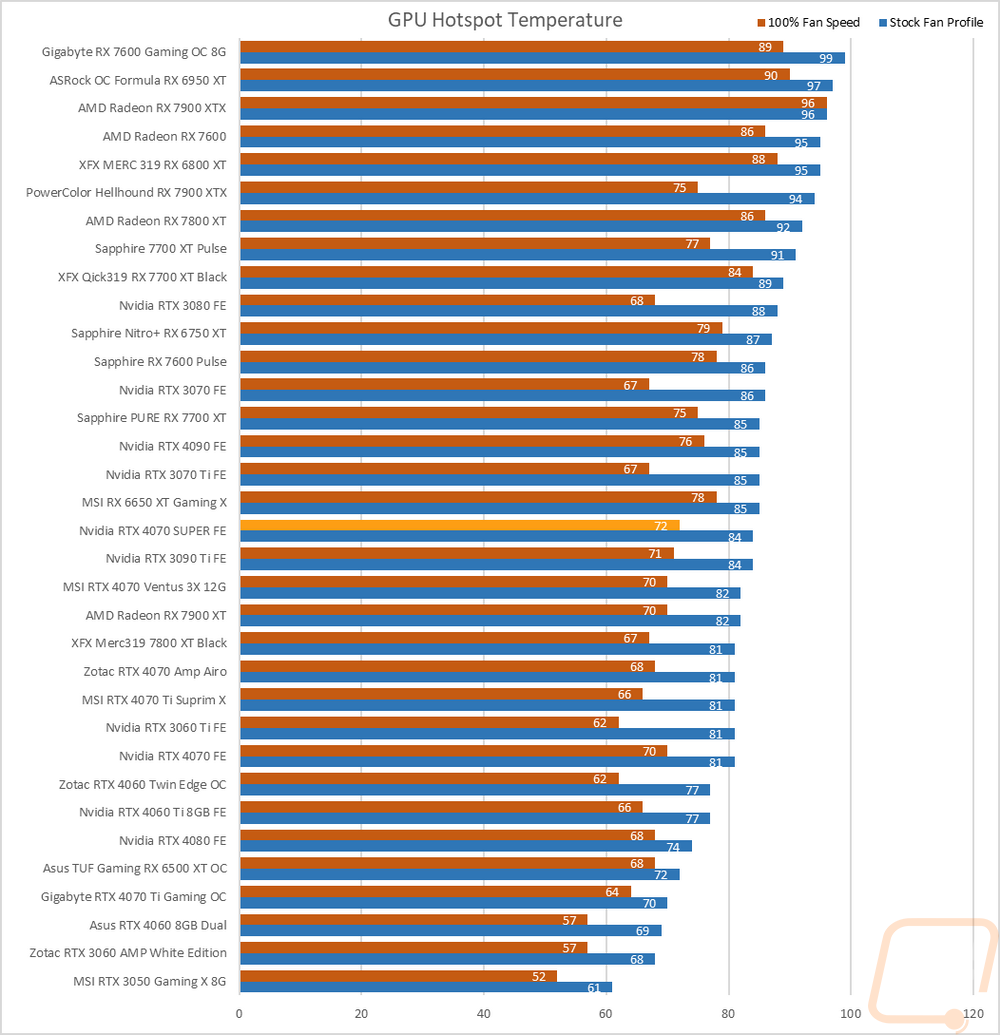
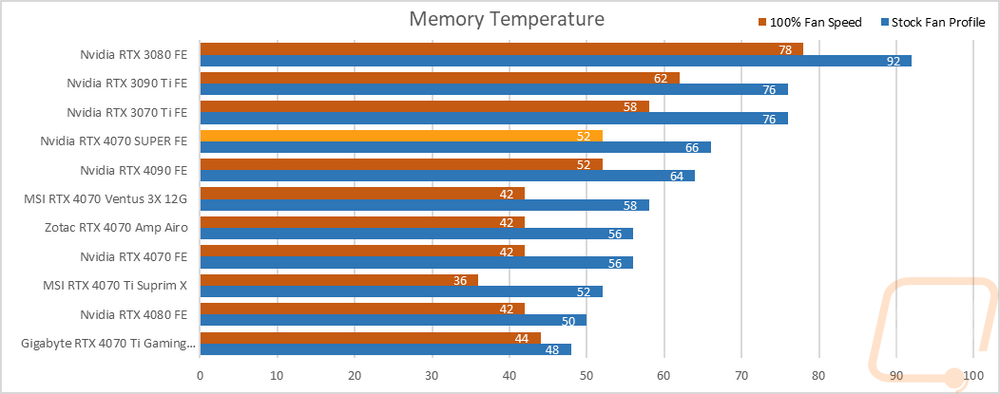
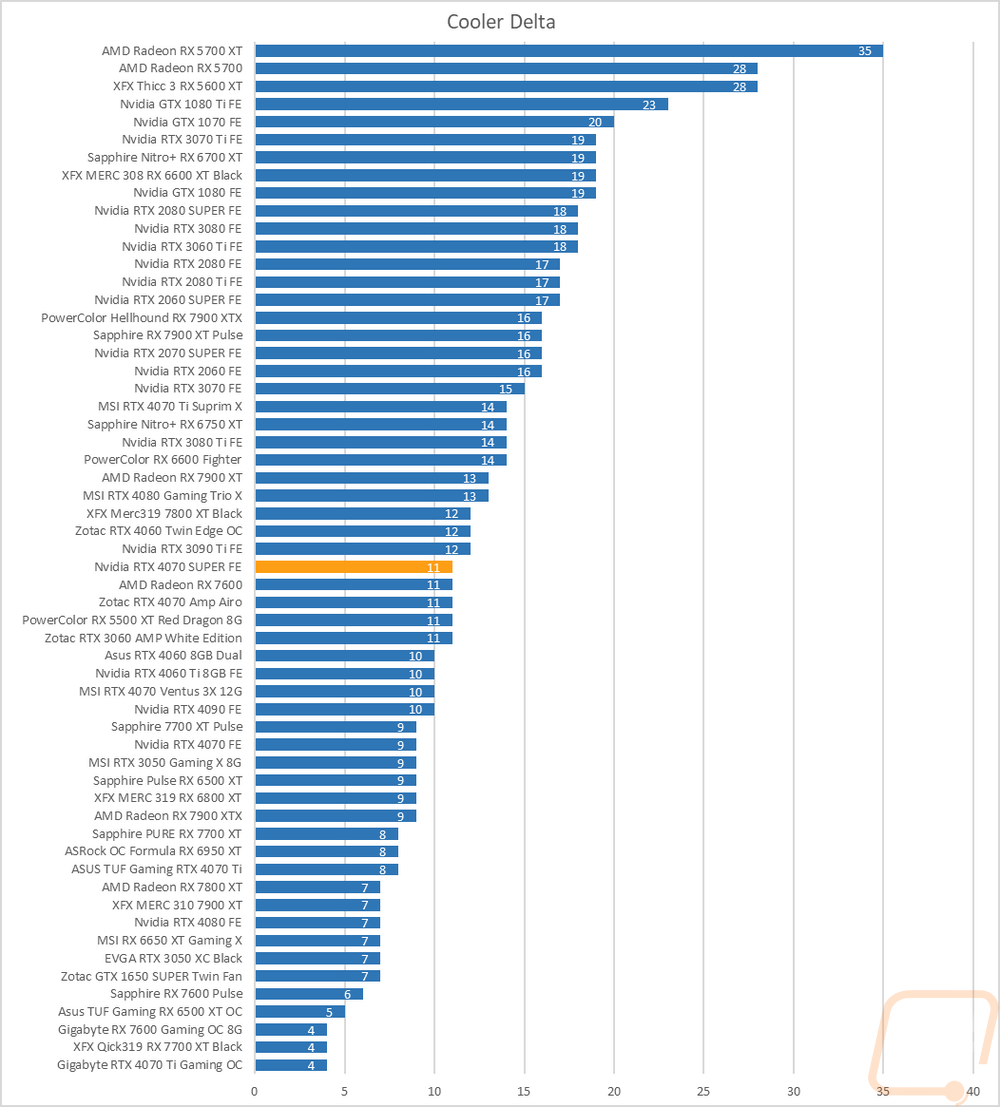
To finish up my testing I of course had to check out the cooling performance. To do this I ran two different tests. I used AIDA64’s Stress Test run for a half-hour each to warm things up. Then I documented what temperature the GPU leveled out at with the stock fan profile and then again with the fans cranked up to 100%. With the stock profile, the RTX 4070 SUPER Founders Edition got as hot as 69c which was 5c higher than the original RTX 4070 but still not too bad. The GPU hotspot was at 84c and memory temps were at 66c. Then with the fans cranked up, the RTX 4070 SUPER Founders Edition is a little higher up in the chart with its 58c result but that is 4c higher than the RTX 4070. The GPU hotspot was cooler at 72c and 52c for the memory temperatures. The delta between the two results was 11c which puts the card right in the middle of the pack and about what you would expect meaning there is still headroom left in the cooler if you plan on doing some small overclocking but Nvidia didn’t waste too much of the cooling even with the new card having the same cooler design as the original RTX 4070.
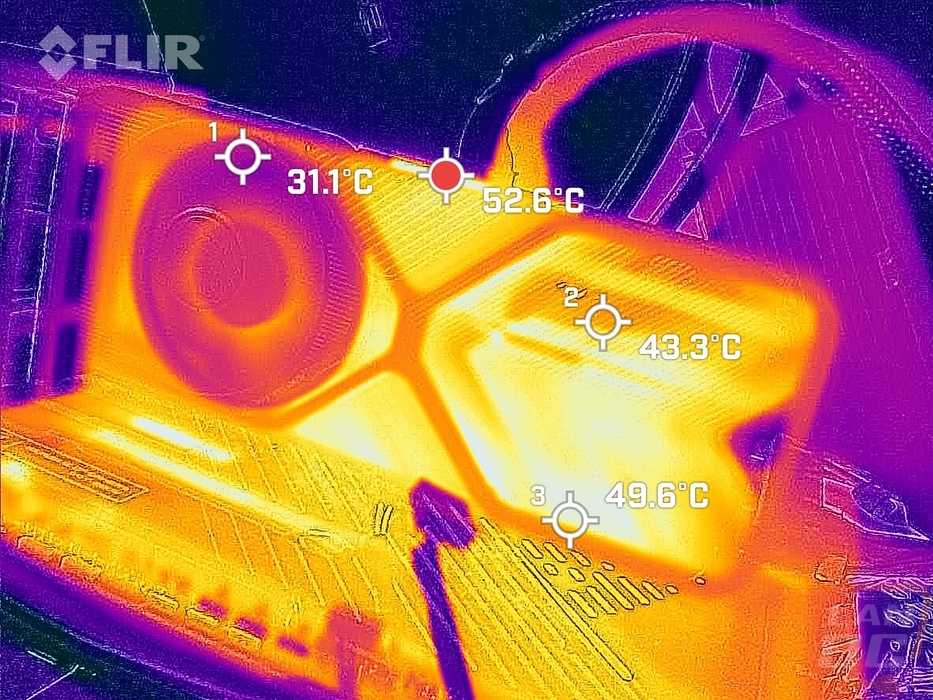
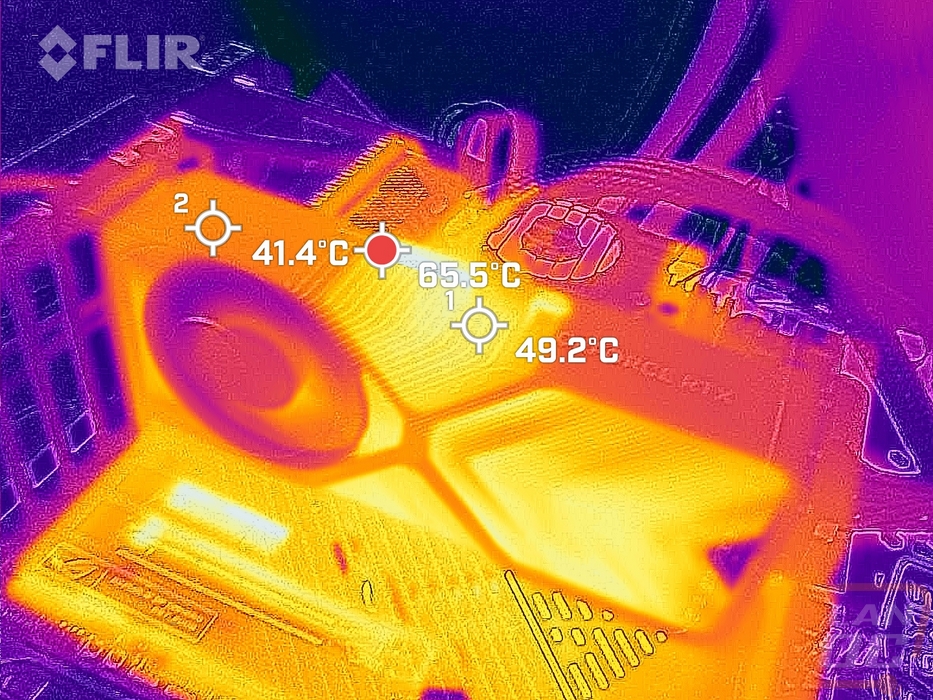
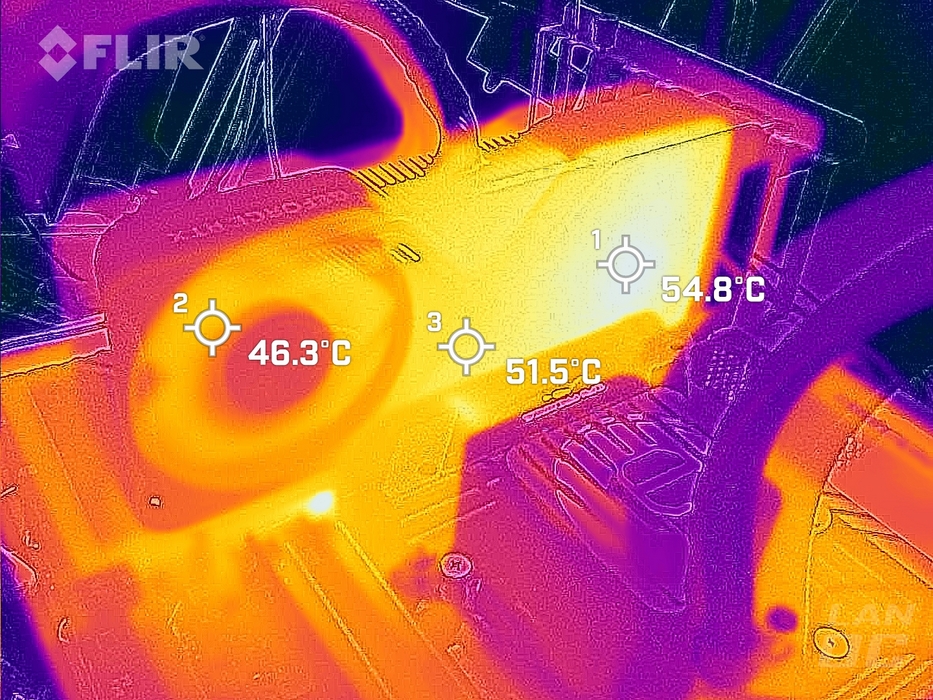
While running the stock fan profile testing I also took the time to get a few thermal images so we could see what is going on. On the left side of the card or the traditional fan side, you can see that the fan end on this side is running cool, there is a little bit of heat in the middle on the underside of the card but that is a normal hotspot that a lot of cards get. The blow-through area shows that it is doing work and with the thermal images, you can see the heatpipes running through there as well. The top edge of the card near the PCB is the hottest area of all of the sides, the small angled heatsink around that is warmer but then the wrap-around shroud doesn’t have any of that heat. Then on the backplate, the fan is warmer than the fan on the other side, this is because we are seeing the back side of the fan, the direction is it pulling air too. There is a warmer spot on the backplate but the temperature difference across the entire back plate is just 3c.