Synthetic Benchmarks
As always I like to start my testing with a few synthetic benchmarks. 3DMark especially is one of my favorites because it is very optimized in both Nvidia and AMD drivers. It's nice to not have to worry about it being favored too much either way and the repeatability of the results makes it a nice chance to compare from card to card, especially when comparing with the same GPU. For the Hellhound RX 7900 GRE, I don’t have any other RX 7900 GRE to compare with but I am curious how it compares to the RX 7800 XT and RX 7900 XT below and above it from AMD as well as the 6800 XT from AMDs last generation of cards as well. Then from Nvidia, I want to keep an eye on how it compares with the RTX 4070, RTX 4070 Ti, and of course both of the new SUPER versions of those cards as well.
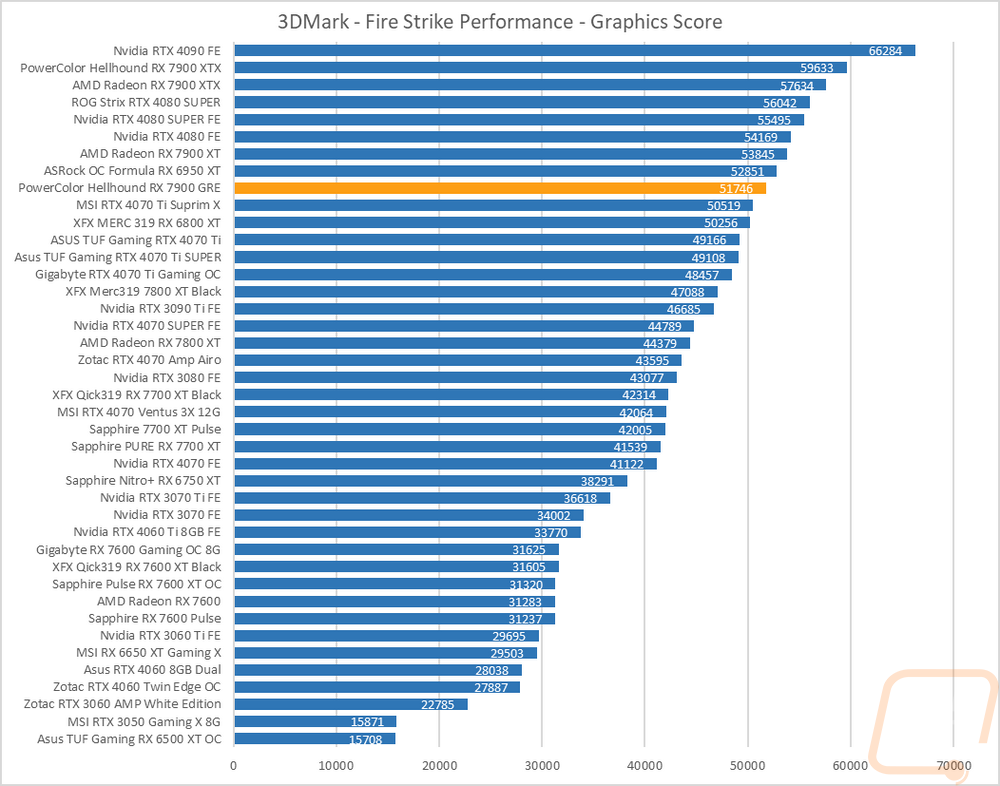
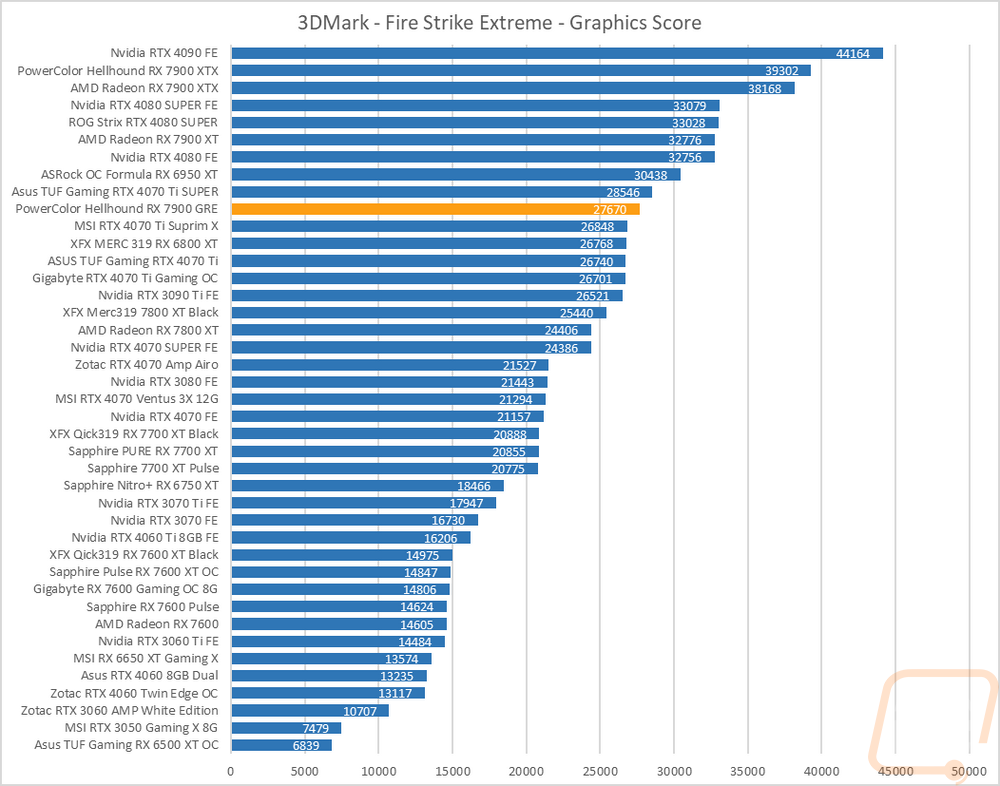
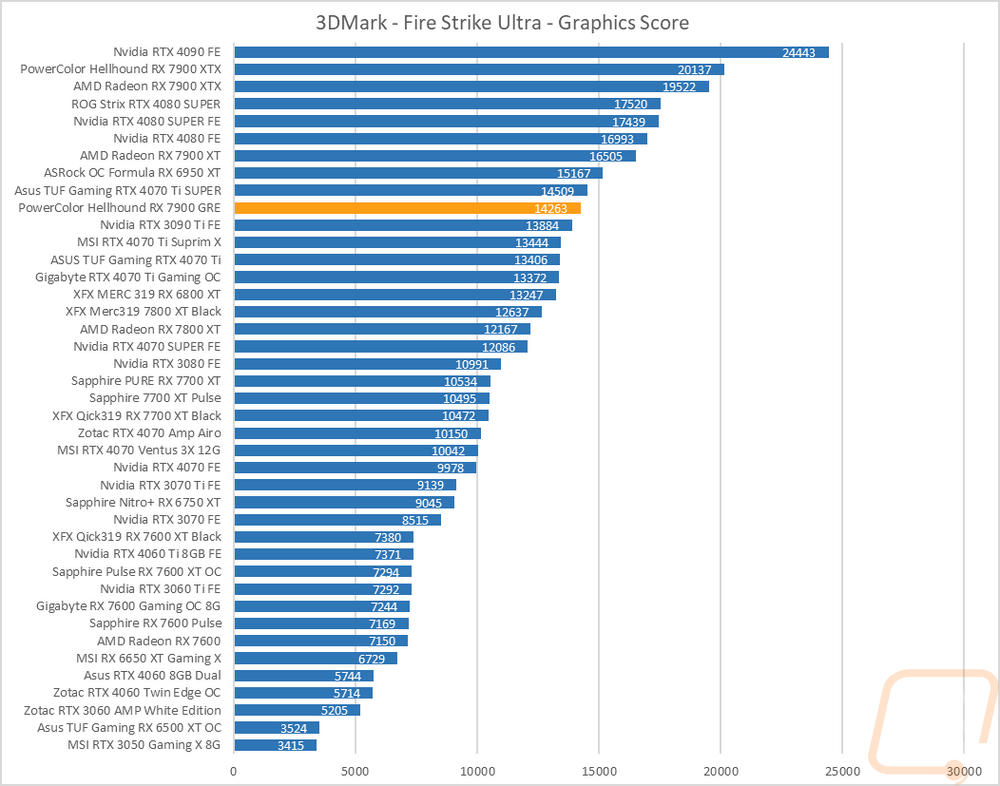
The first round of tests were done in the older Fire Strike benchmark which is a DX11 test. There are three detail levels, performance, extreme, and ultra. The Hellhound RX 7900 GRE scored a 51746 on the base Fire Strike benchmark which put it sitting below the 7900 XT and 6950 XT but more importantly it was above the RTX 4070 Ti. In Fire Strike Extreme the Hellhound RX 7900 GRE scored a 27670, sitting right under the new 4070 Ti SUPER and above the old RTX 4070 Ti overclocked cards. Then in the Fire Strike Ultra test, the Hellhound RX 7900 GRE was just below the 4070 Ti SUPER again and even ahead of the 3090 Ti as well as the RTX 4070 Ti’s. The gap between it and the 7900 XT widened here because of the bigger memory bus and larger VRAM but that gap is smaller in the base Fire Strike and Extreme tests.
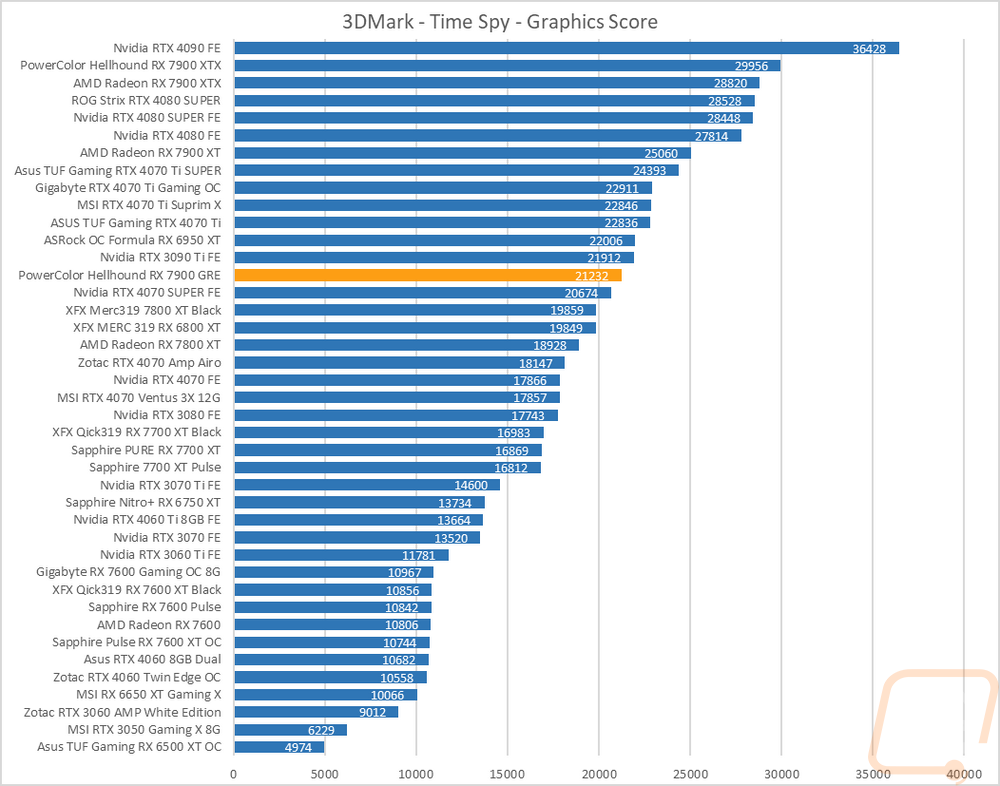
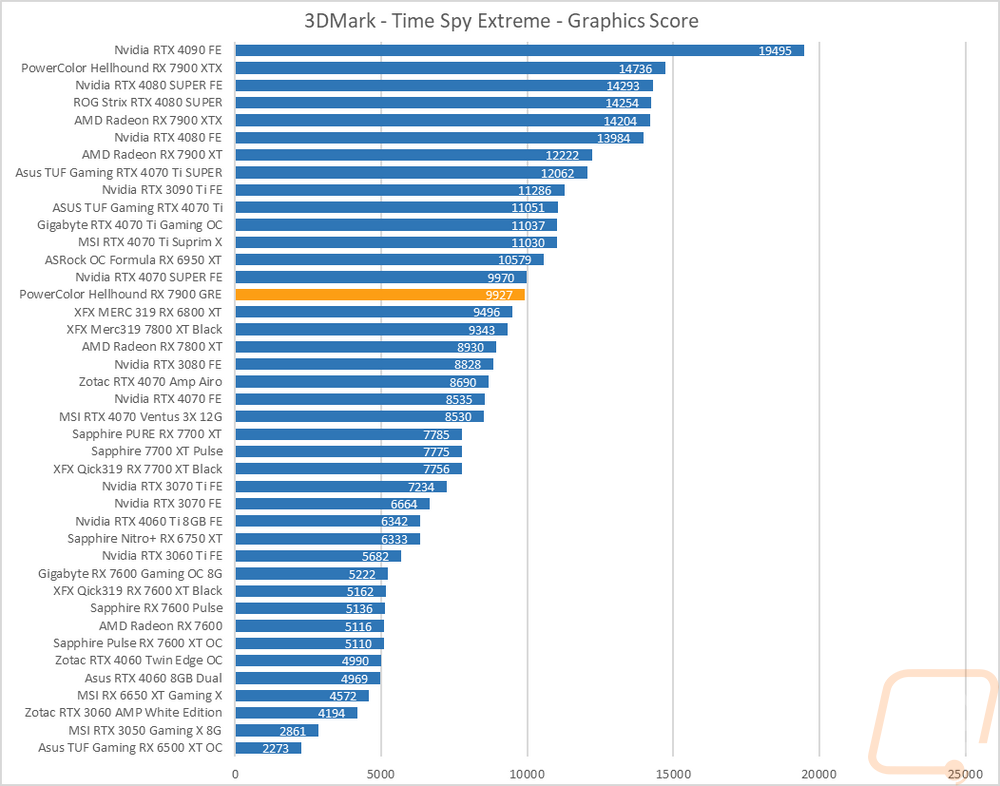
The next two were both based on the Time Spy benchmark. One is the standard test and then there is the extreme detail level. Time Spy is DX 12 based and in this test, the Nvidia cards jump back up in performance and compete a little more. Where the Hellhound RX 7900 GRE was ahead of the RTX 4070 Ti in Fire Strike it is behind it in Time Spy but sitting ahead of the new RTX 4070 SUPER. In Time Spy Extreme the Hellhound RX 7900 GRE and 4070 SUPER are almost at a dead tie with just 43 points between them.
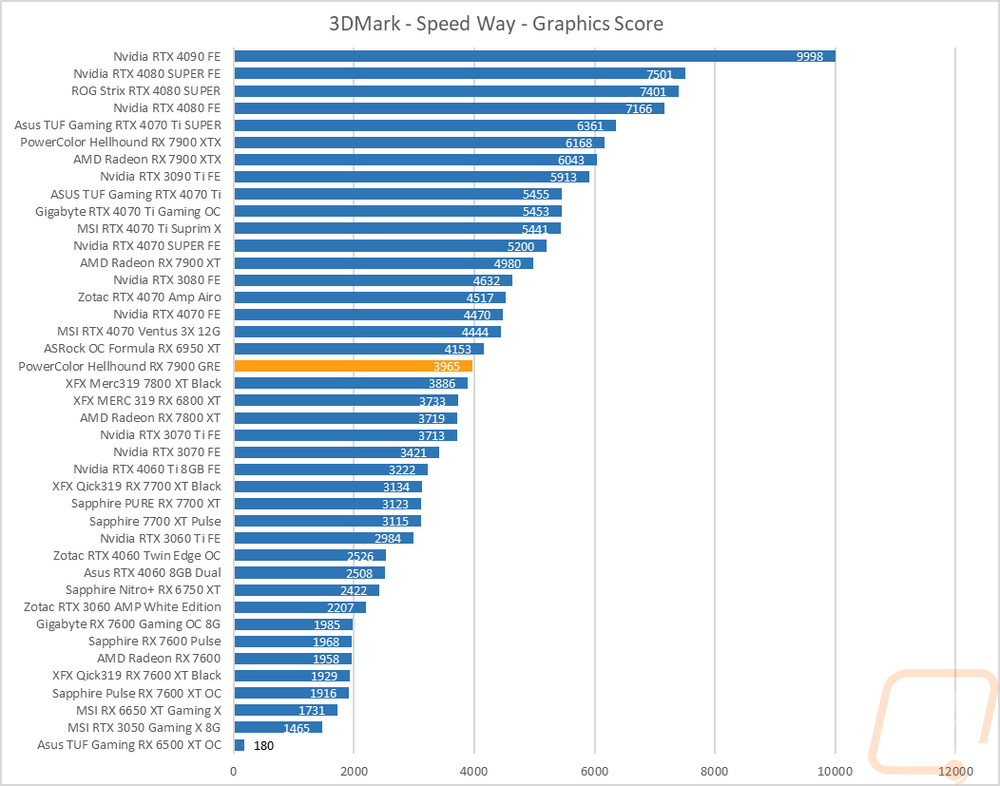
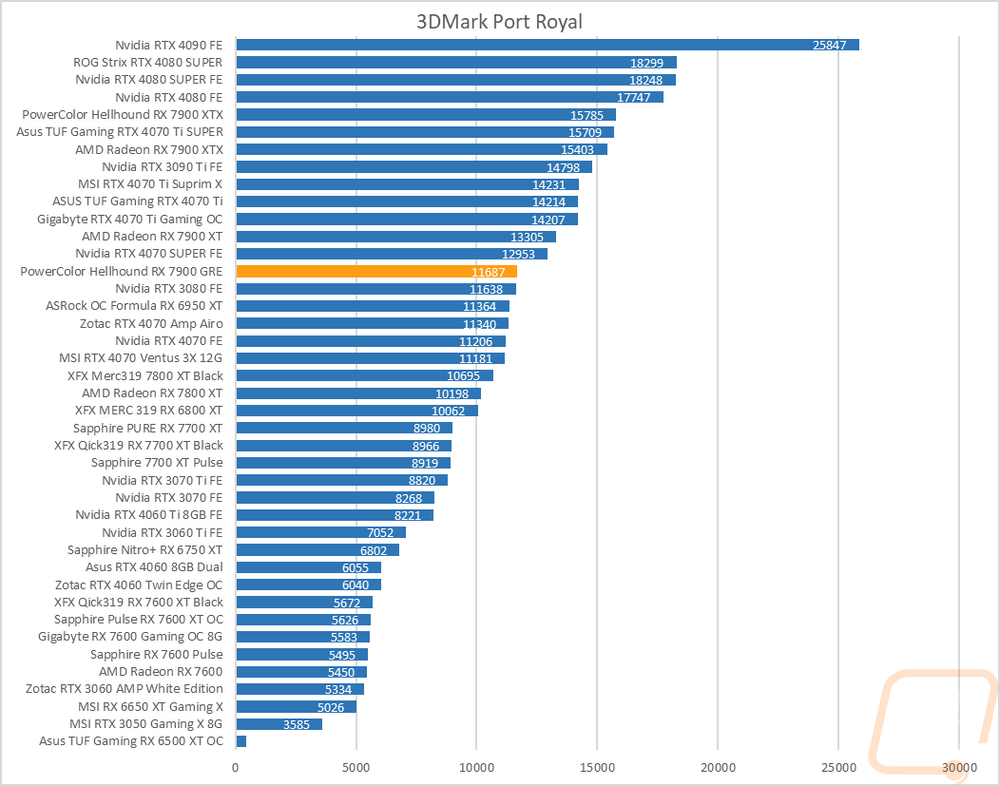
For ray tracing performance, I ran both the 3DMark Port Royal test which is ray tracing focused as well as the new 3DMark Speed Way test which tests all future-looking features including ray tracing. In Speed Way, the Hellhound RX 7900 GRE scored a 3965 putting it just ahead of the RX 7800 XT and with the previous generation 6950 XT above it. The RTX 4070 is 505 points out ahead of the Hellhound RX 7900 GRE. The Hellhound RX 7900 GRE did better in Port Royal at least with a score of 11687 and being nearly tied with the RTX 3080 and sitting between the RTX 4070 and RTX 4070 SUPER.
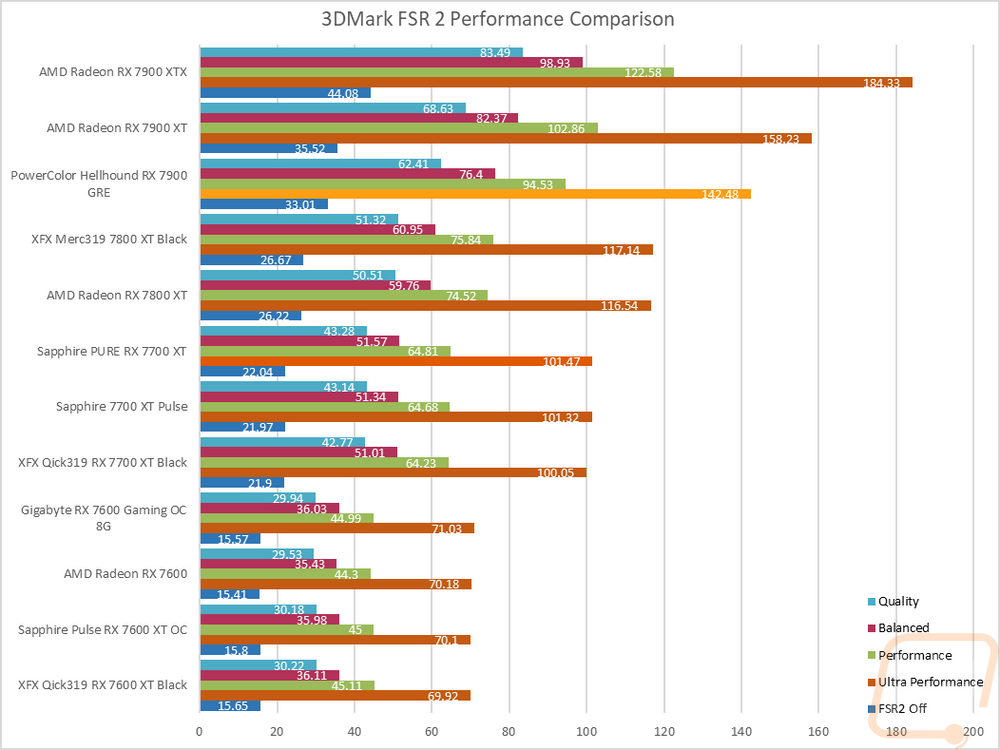
While testing in 3DMark I also took a look at the FSR2 performance comparison tool. With this, I tested the Hellhound RX 7900 GRE with FSR2 on and off as well as a range of different detail settings to get a look at how much performance FSR2 can get you in ideal conditions. The Hellhound RX 7900 GRE started at just 33.01 FPS without FSR2 and even on the highest detail setting improved on that up to 62.41 FPS. The balanced and performance settings were worth 14 and 18 FPS but look at the ultra performance result with a crazy 142 FPS.
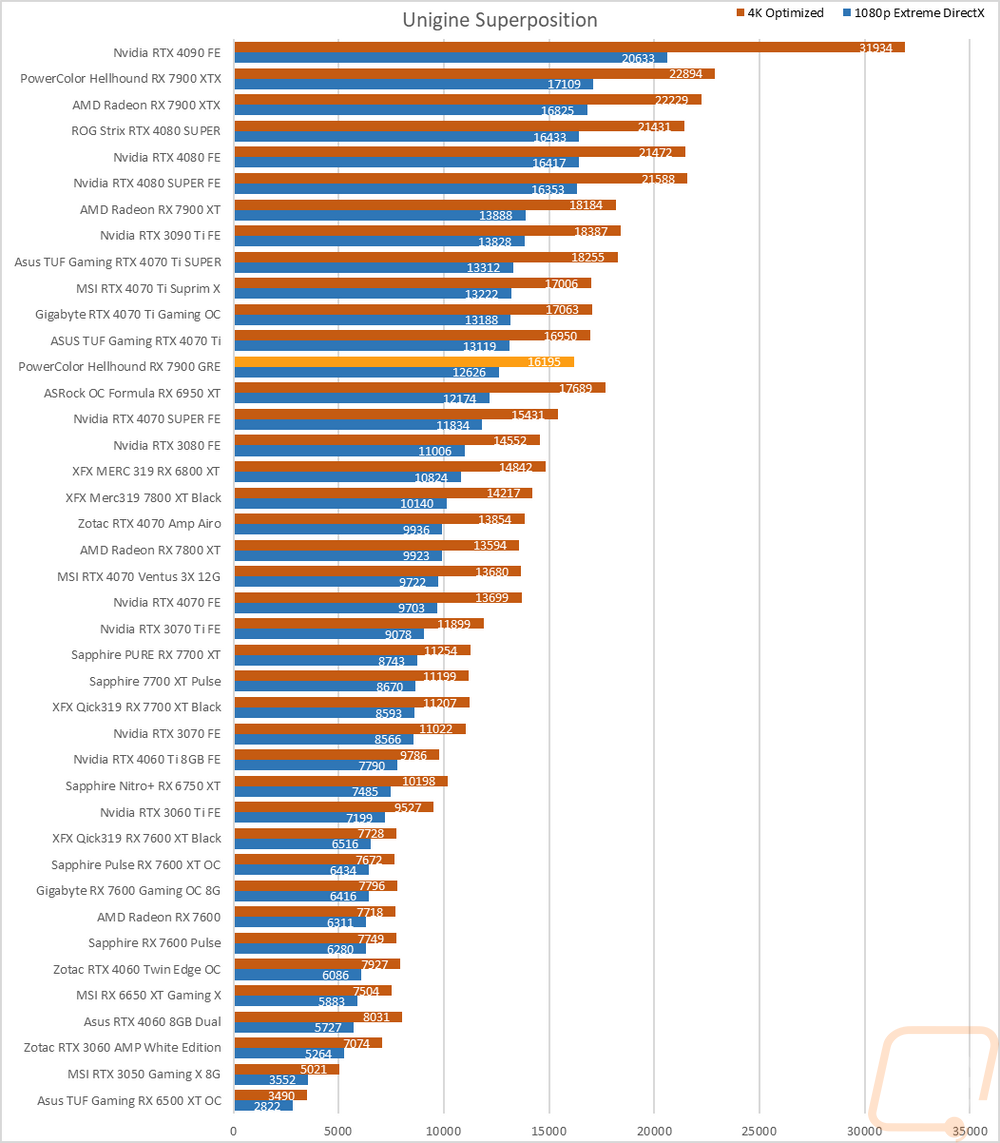
The last test was using the Unigine-based Superposition benchmark and I tested at 1080p with the extreme detail setting as well as the 4K optimized setting. In the 1080p extreme detail setting the Hellhound RX 7900 GRE is sitting below the RTX 4070 Ti and ahead of the 6950 XT and RTX 4070 SUPER. In the higher 4K resolution test however, you can see where the slightly smaller 256-bit memory bus comes into play with the Hellhound RX 7900 GRE still sitting ahead of the 4070 SUPER but behind the 6950 XT it was in front of at 1080p.