In-Game Benchmarks
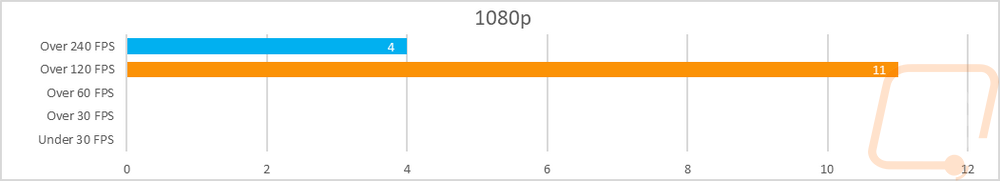
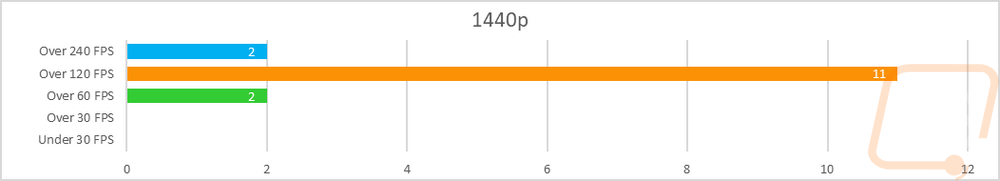
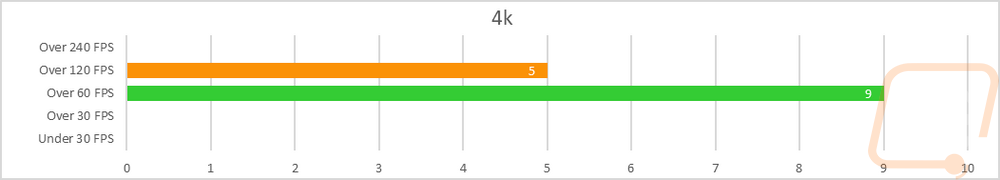
Now we finally get into the in game performance and that is the main reason people pick up a new video card. To test things out I ran through our new benchmark suite that tests 8 games at three different resolutions (1080p, 1440p, and 4k). Most of the games tested have been run at the highest detail setting and a mid-range detail setting to get a look at how turning things up hurts performance and to give an idea of whether turning detail down from max will be beneficial for frame rates. In total, each video card is tested 42 times and that makes for a huge mess of results when you put them all together. To help with that I like to start with these overall playability graphs that take all of the results and give an easier-to-read result. I have one for each of the three resolutions and each is broken up into four FPS ranges. Under 30 FPS is considered unplayable, over 30 is playable but not ideal, over 60 is the sweet spot, and then over 120 FPS is for high refresh rate monitors.
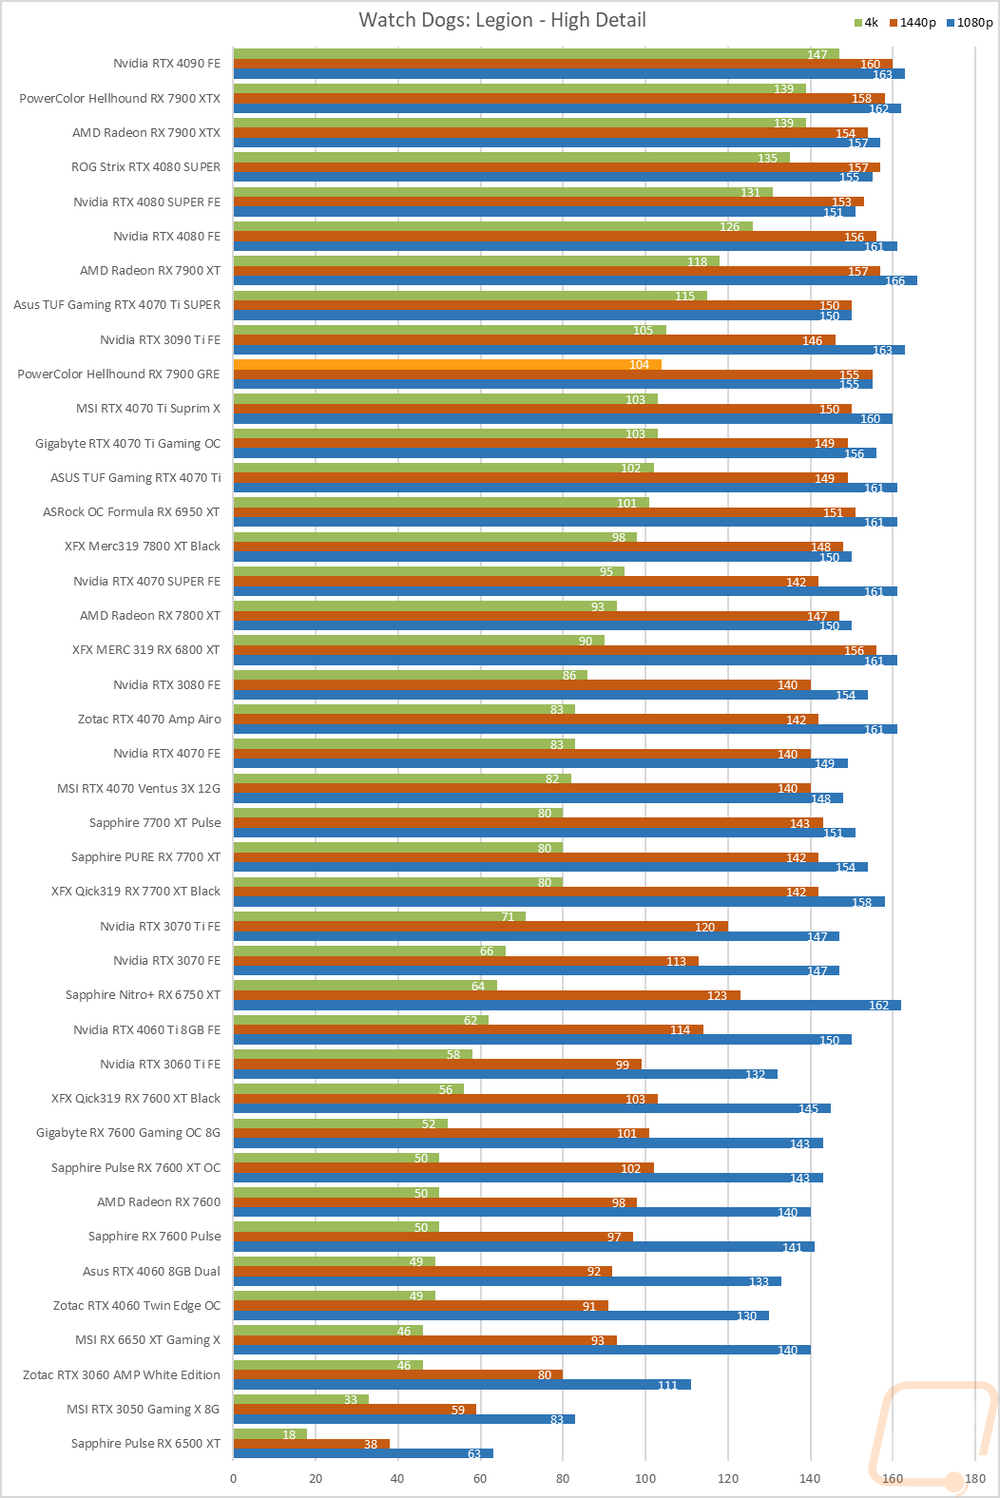
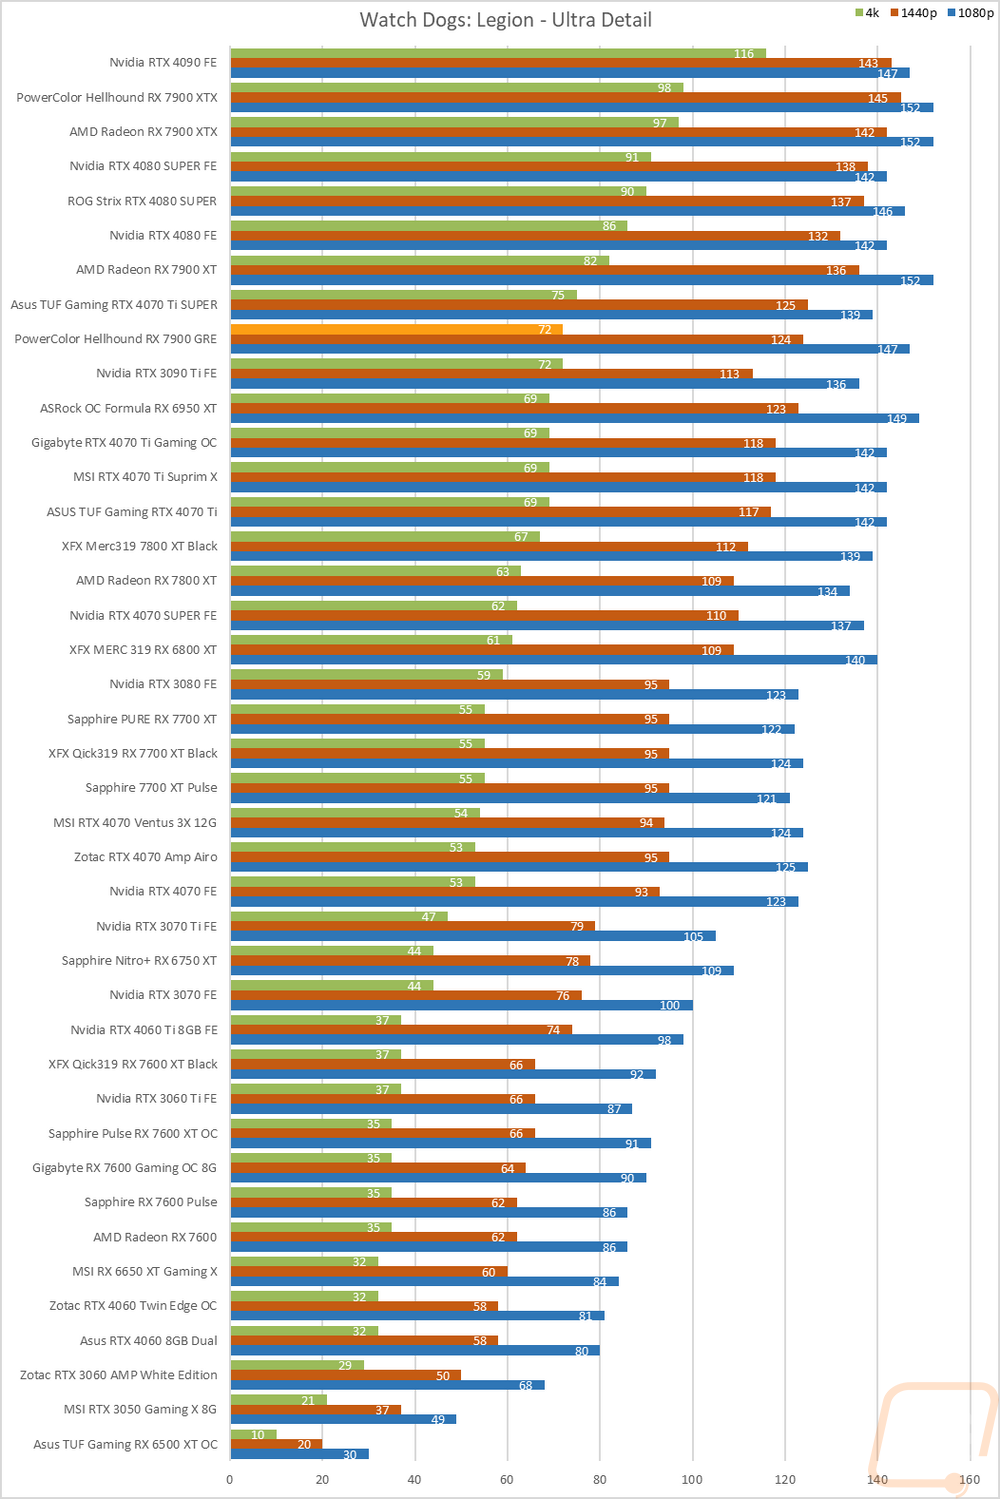
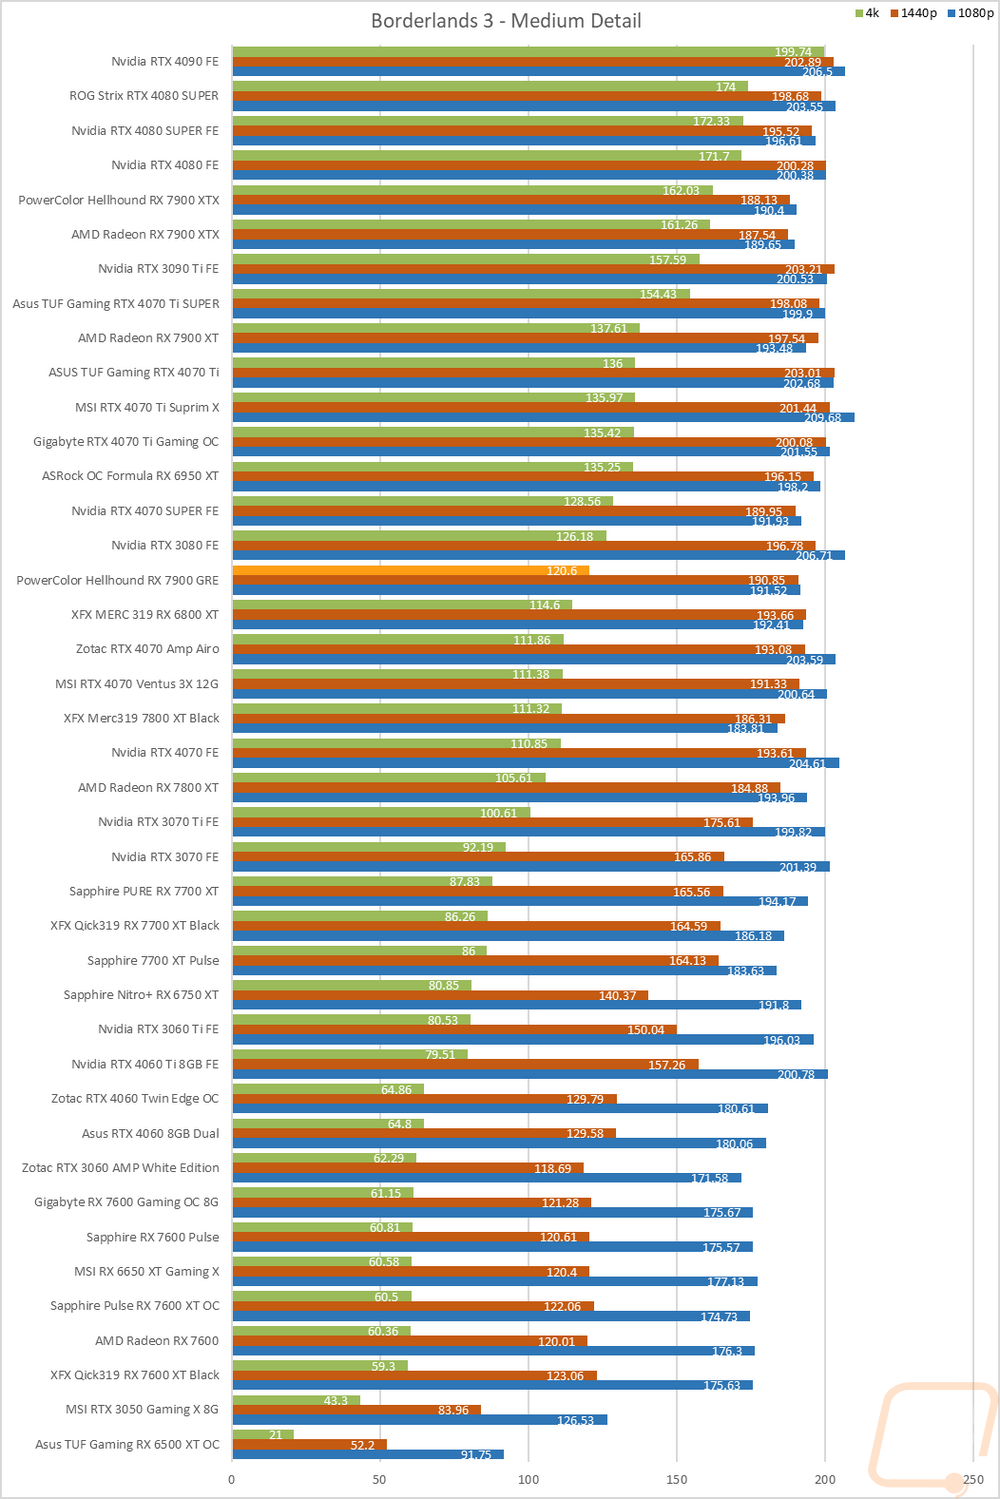
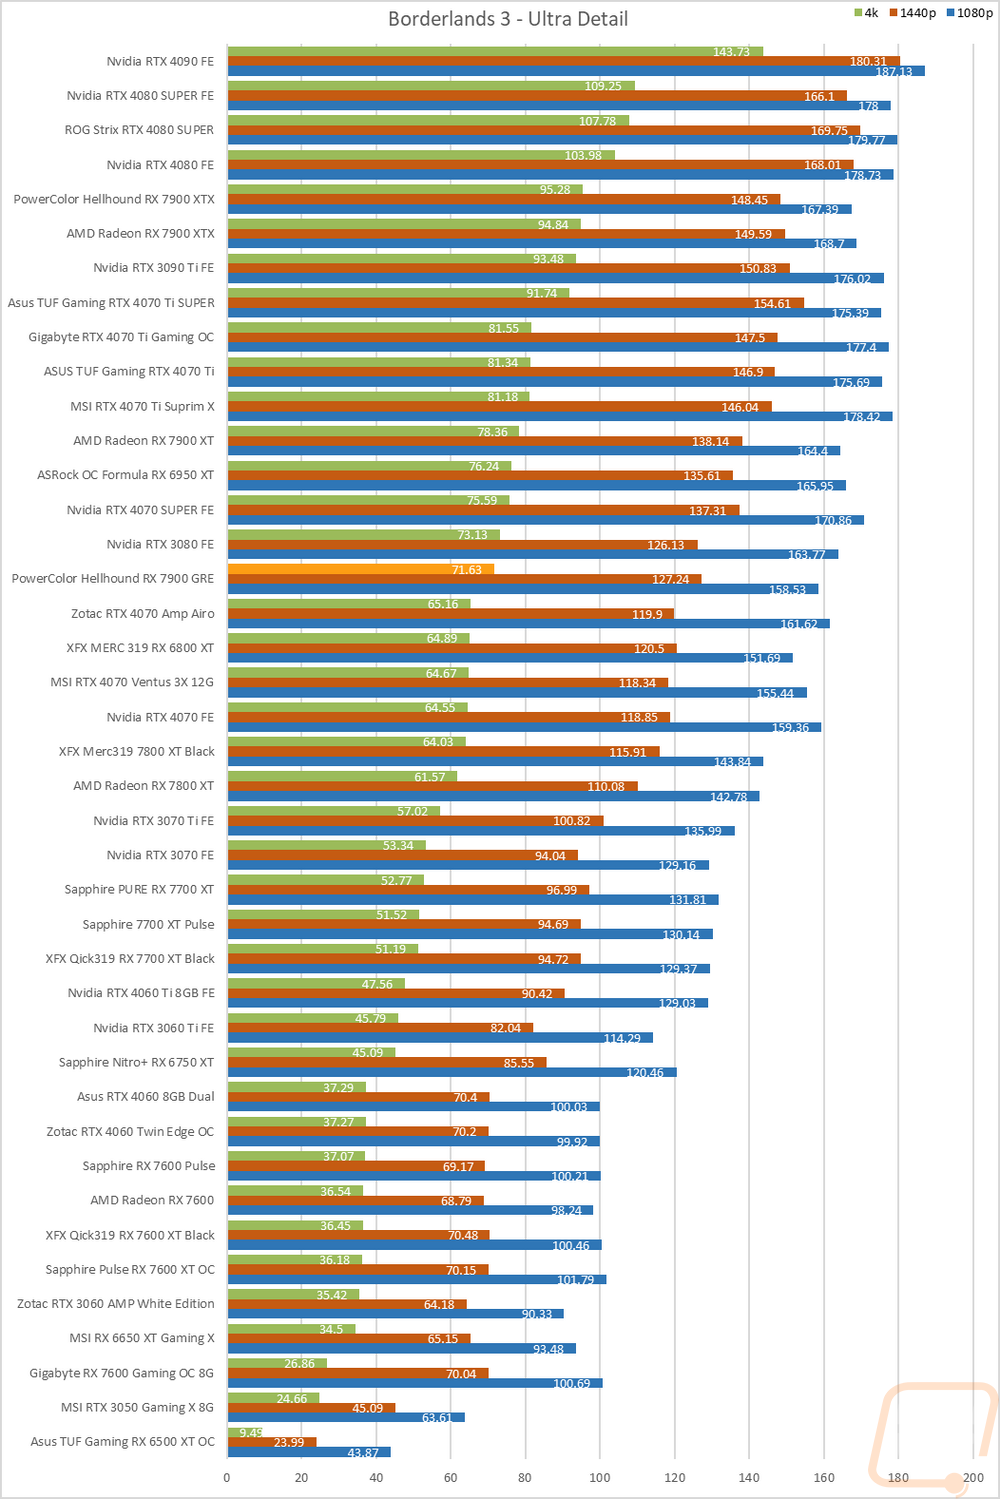
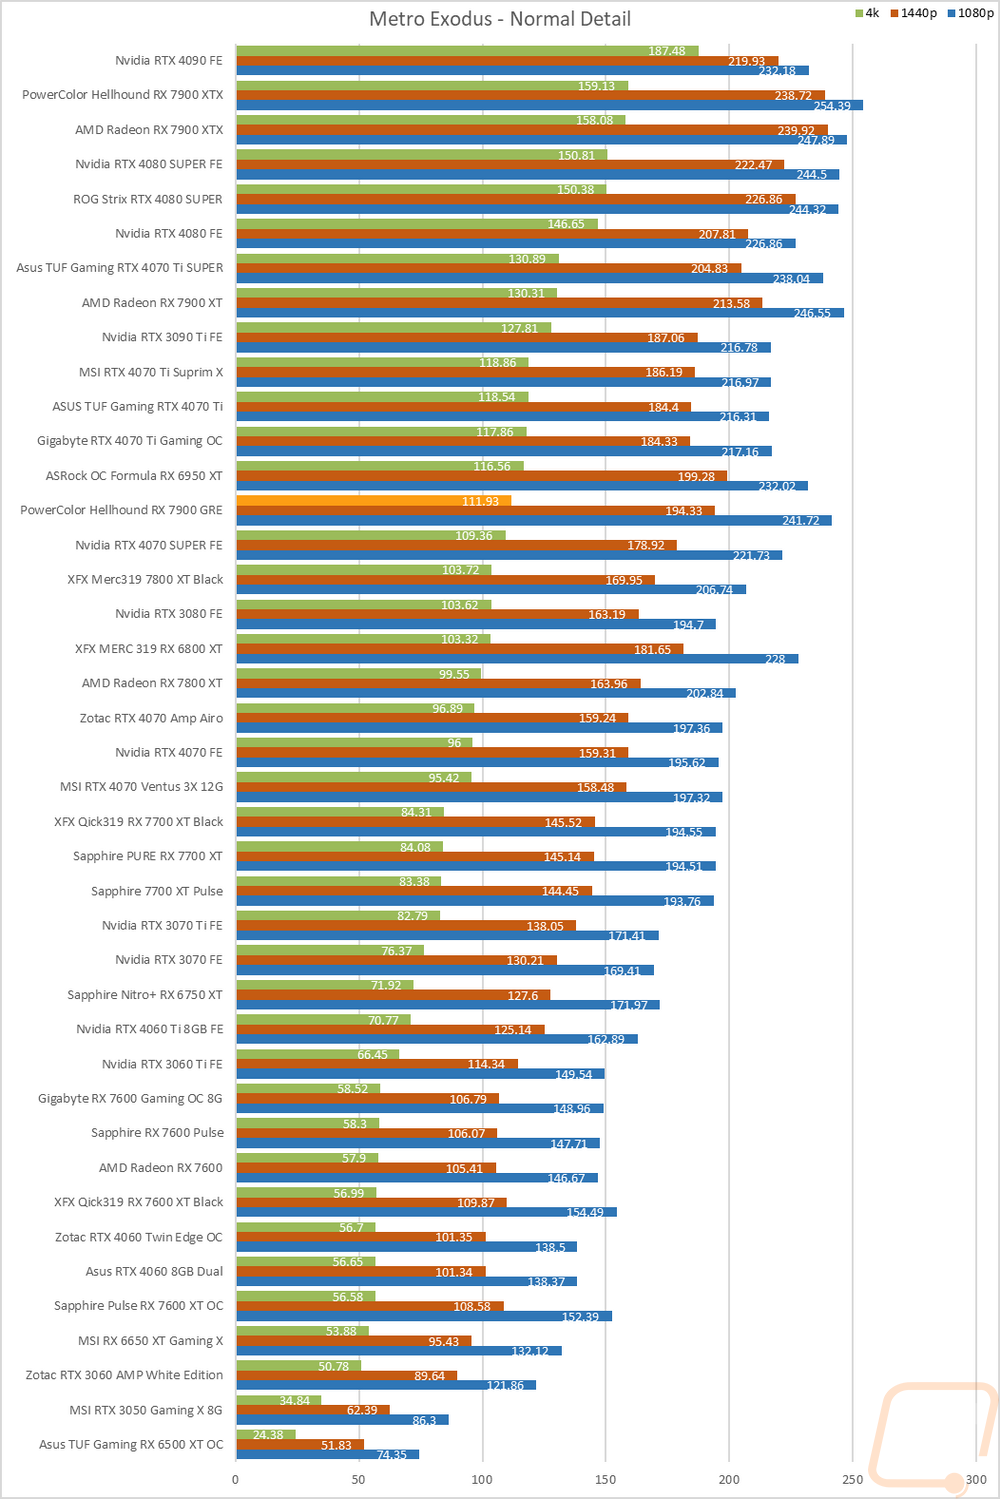
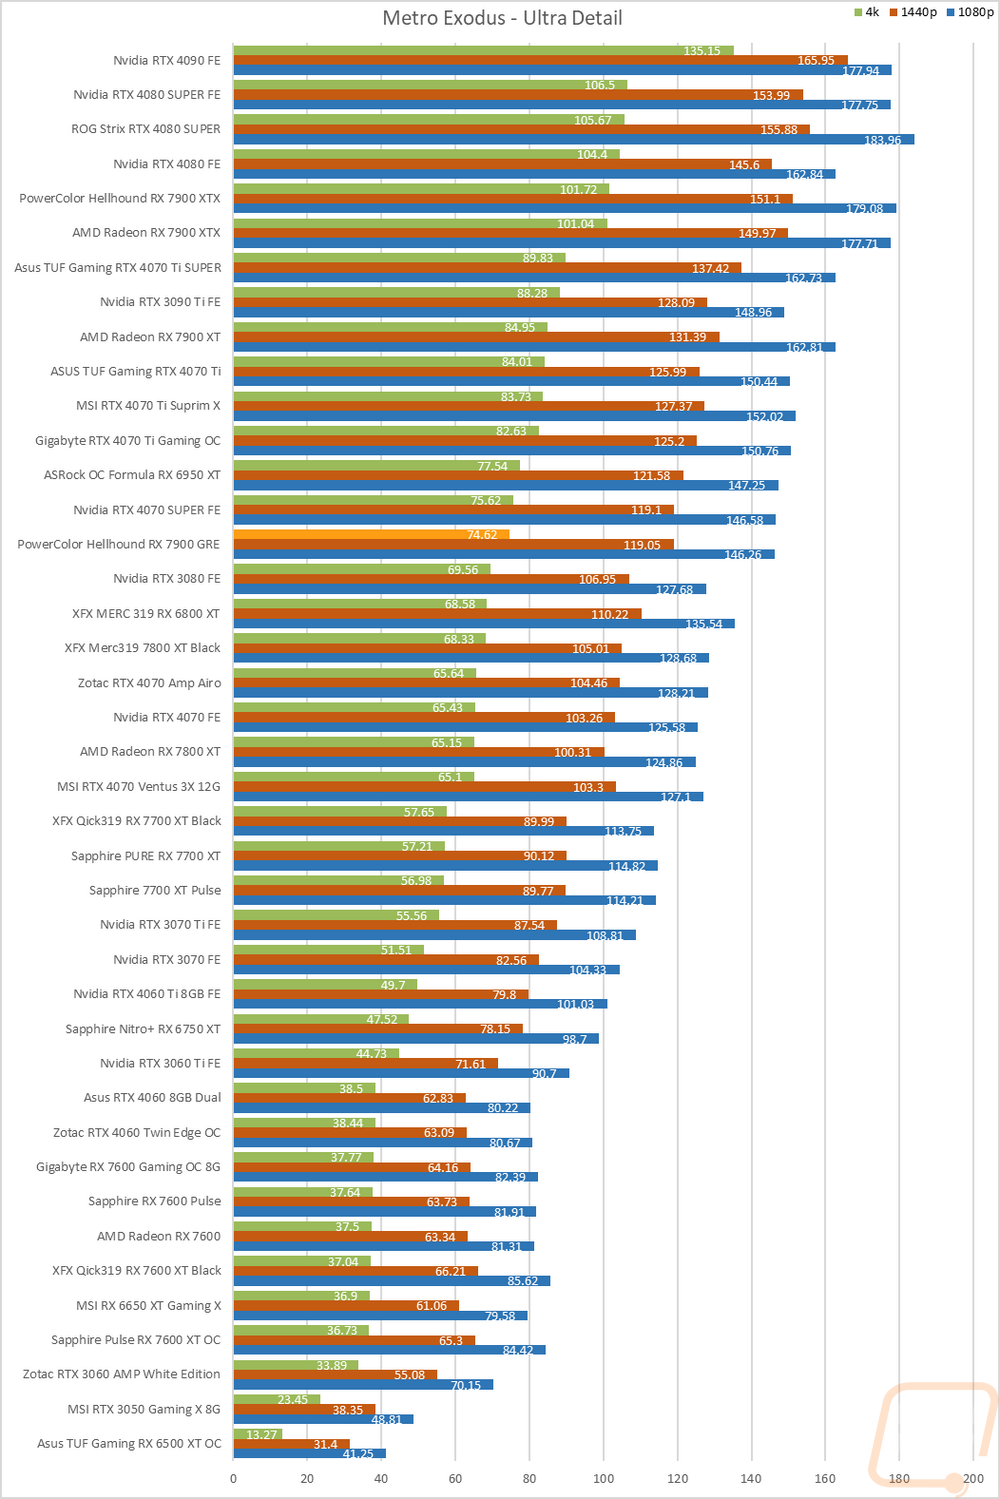
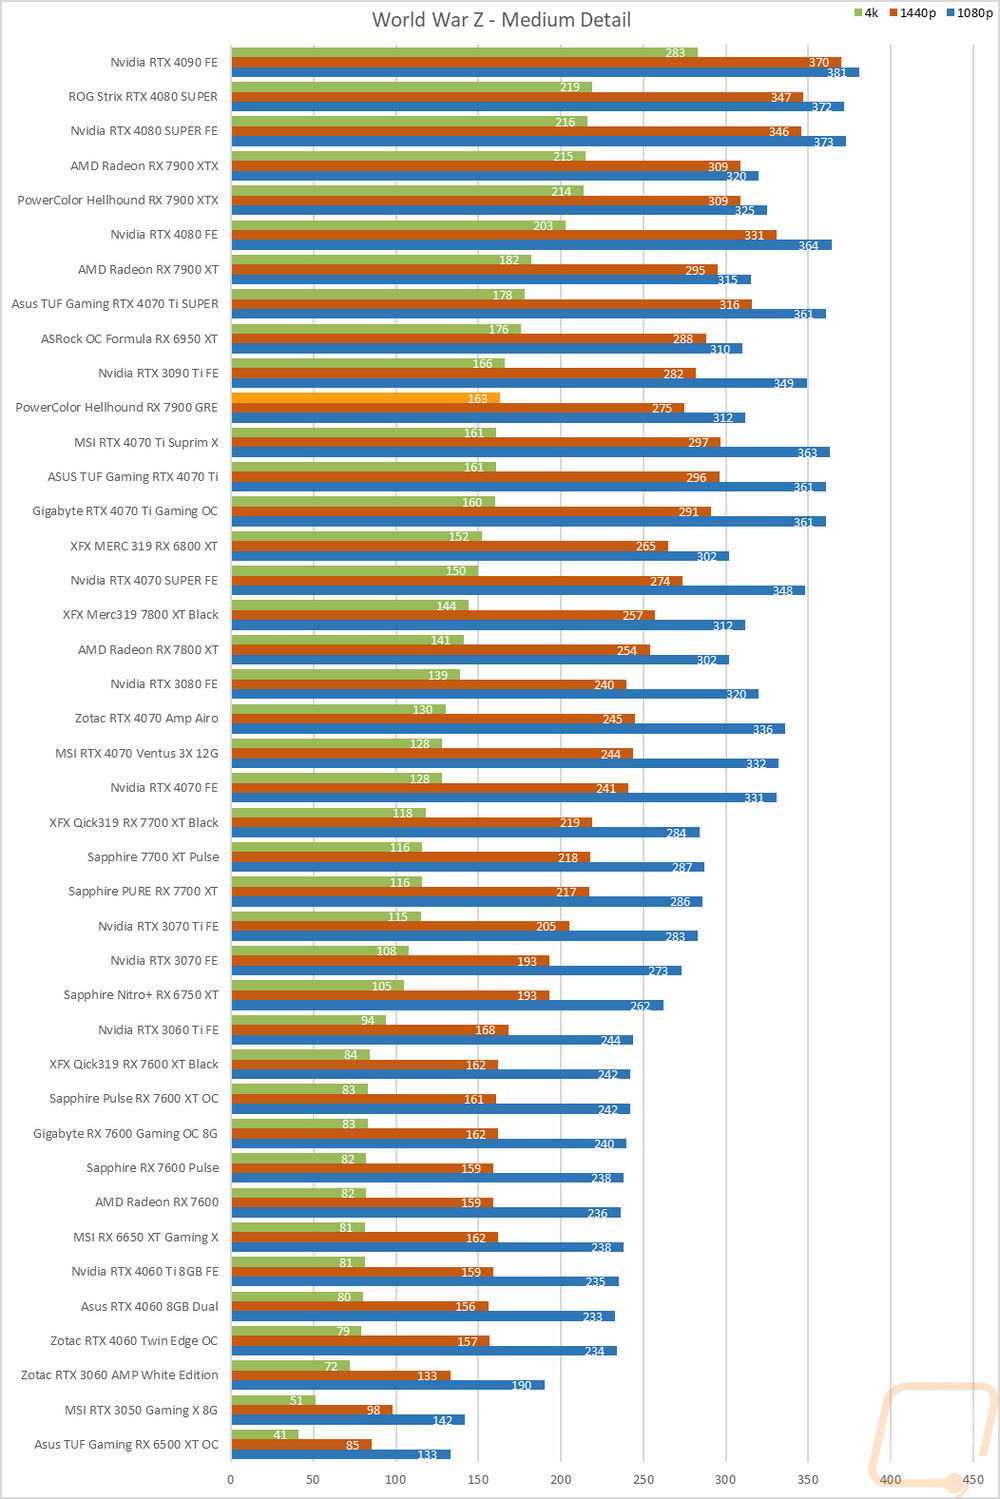
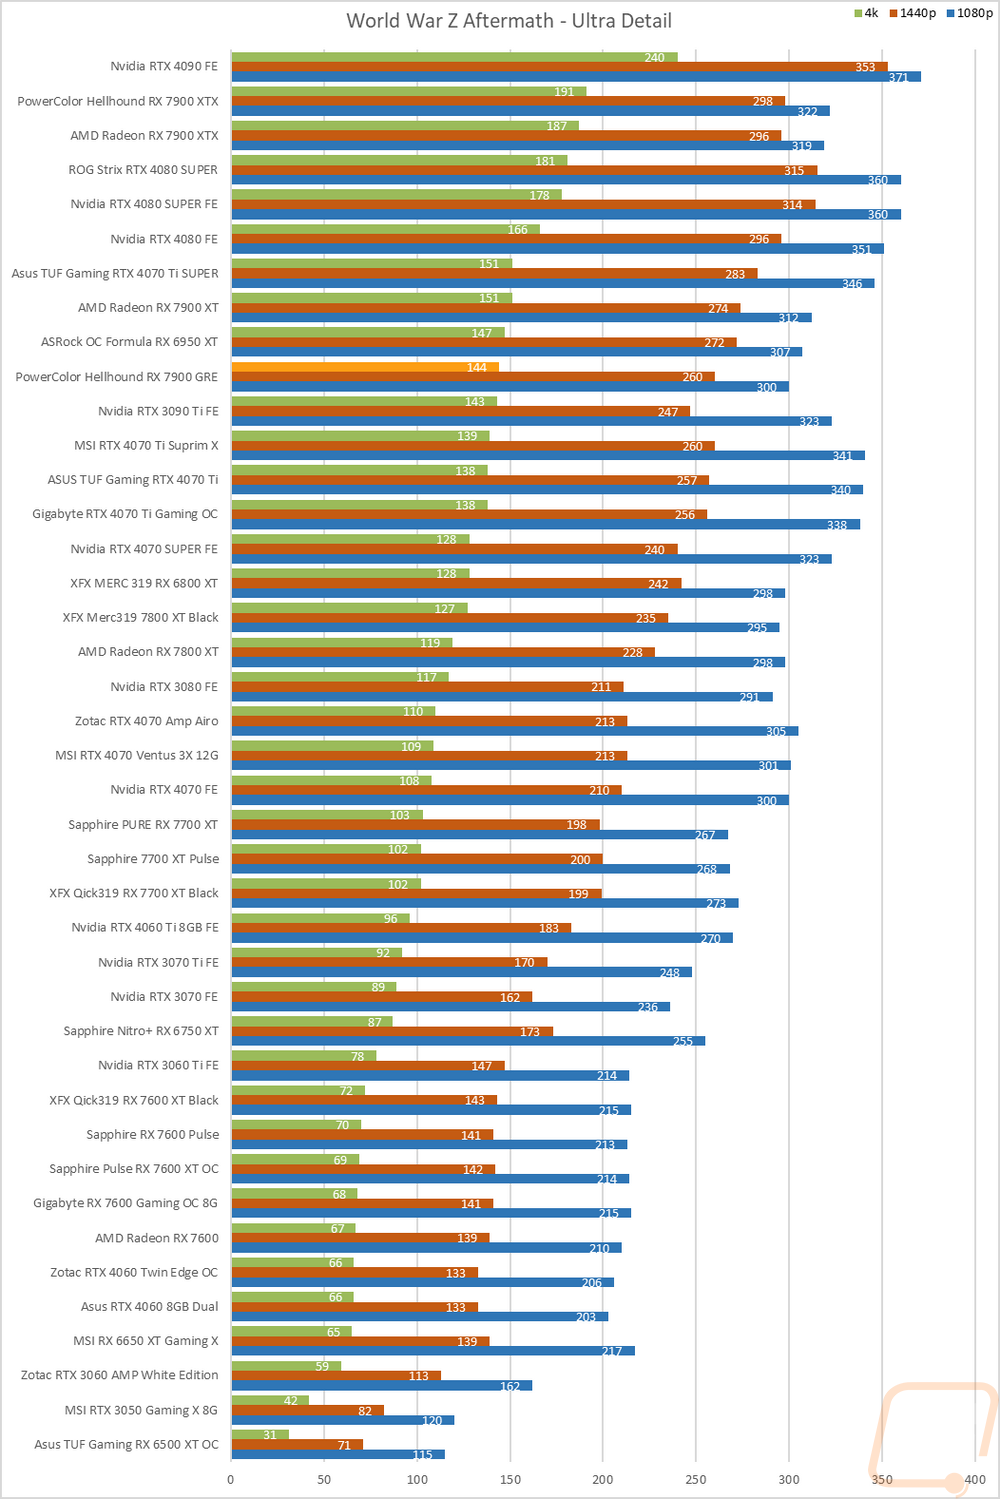
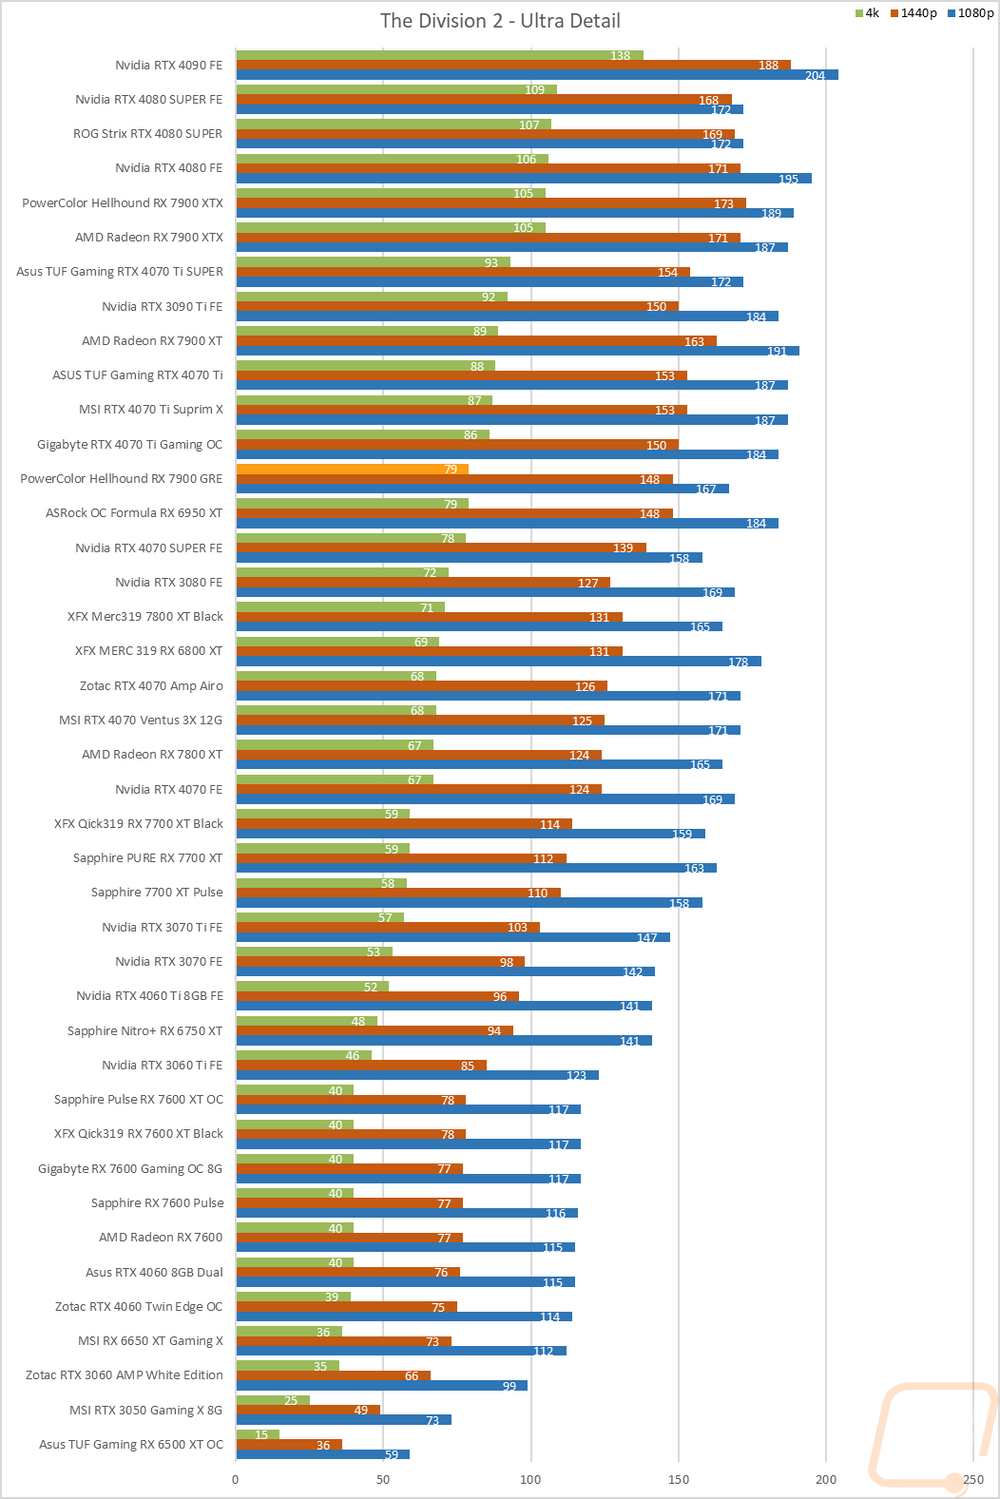
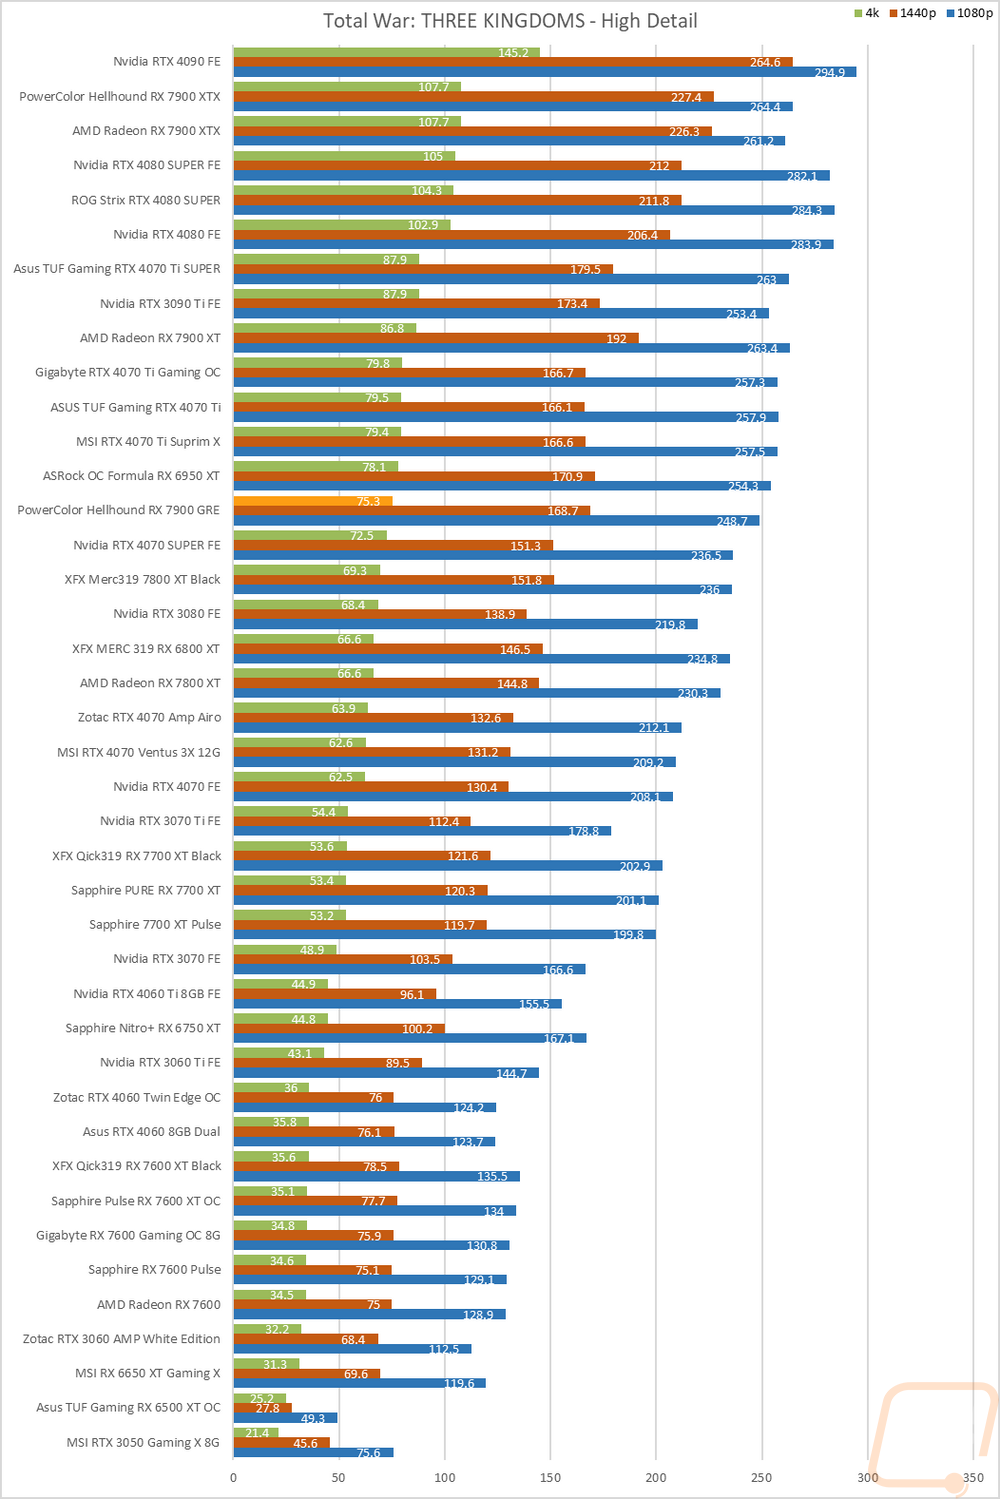
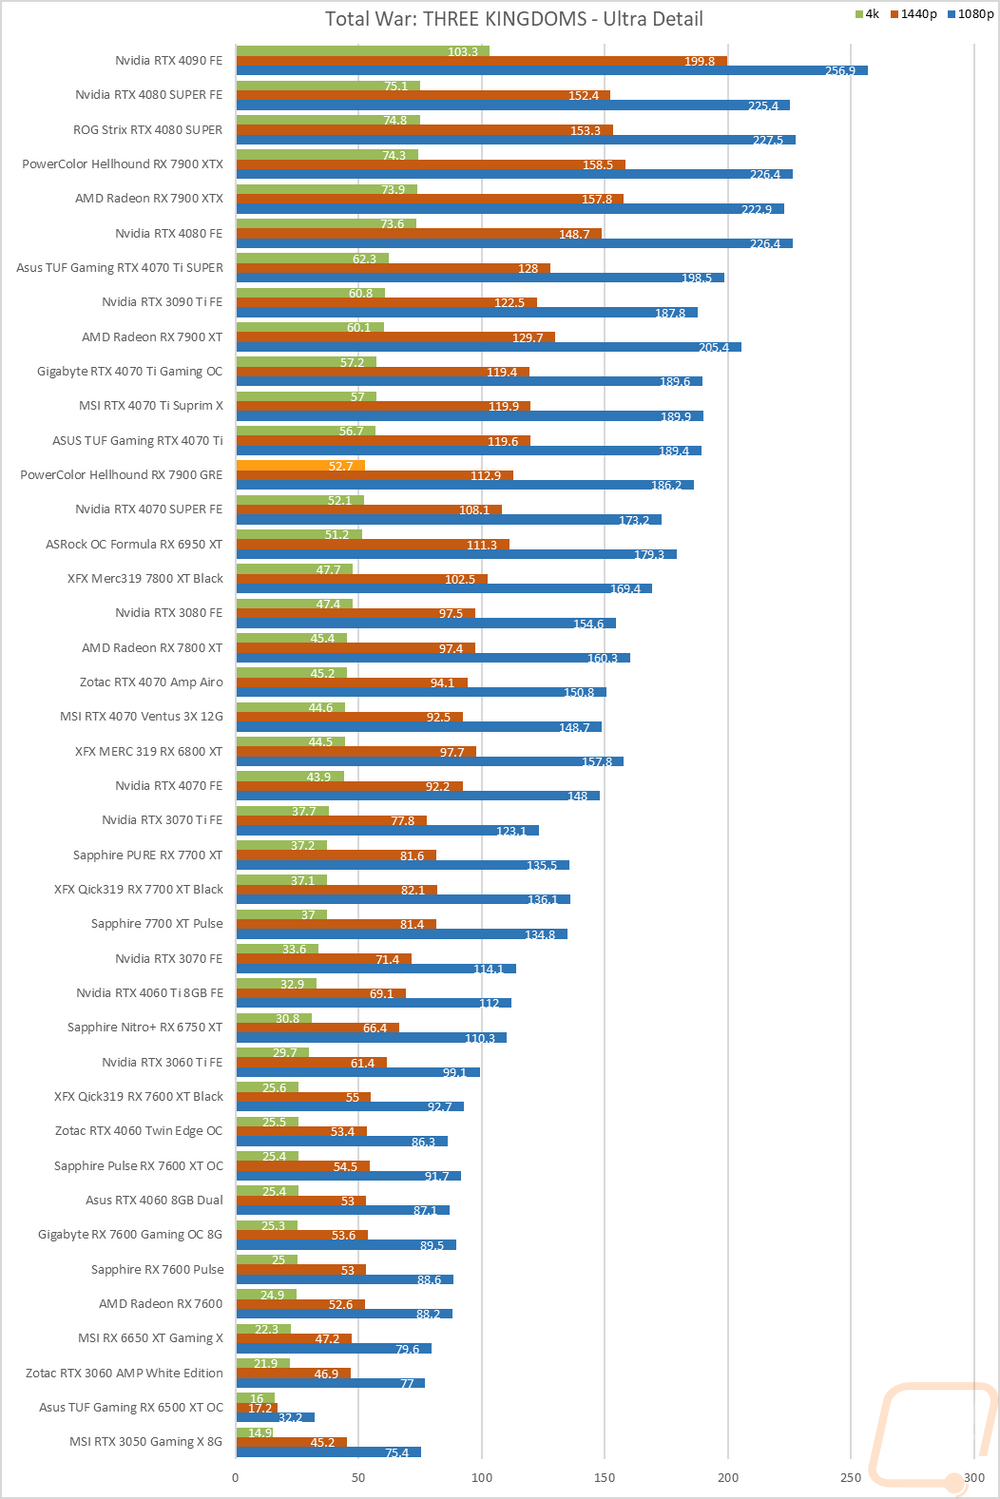
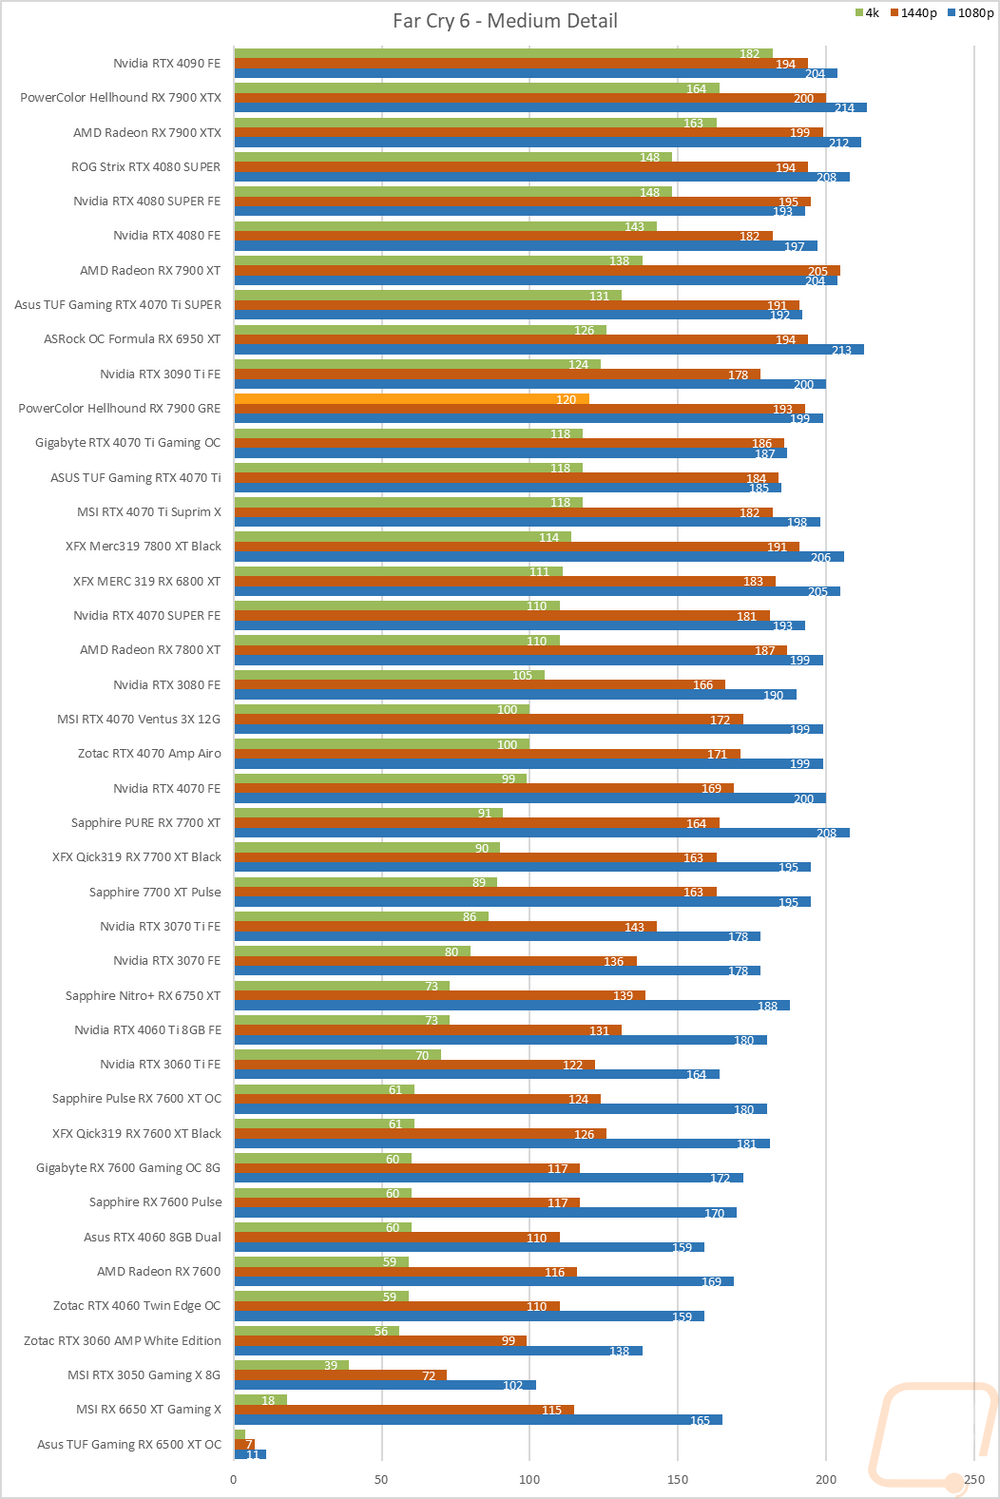
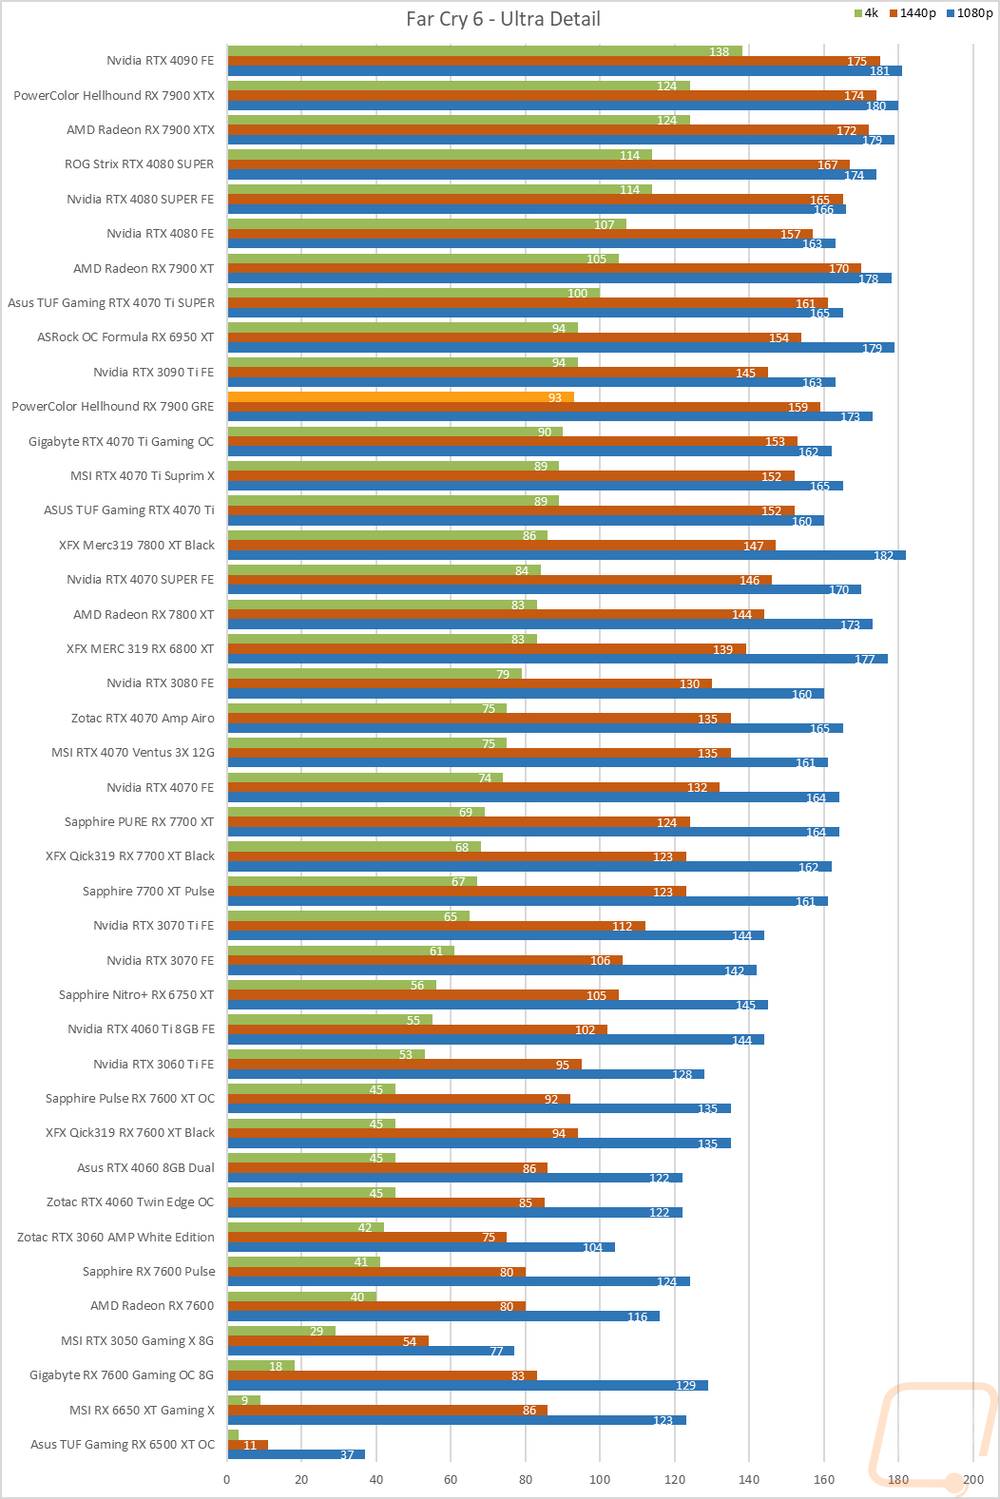
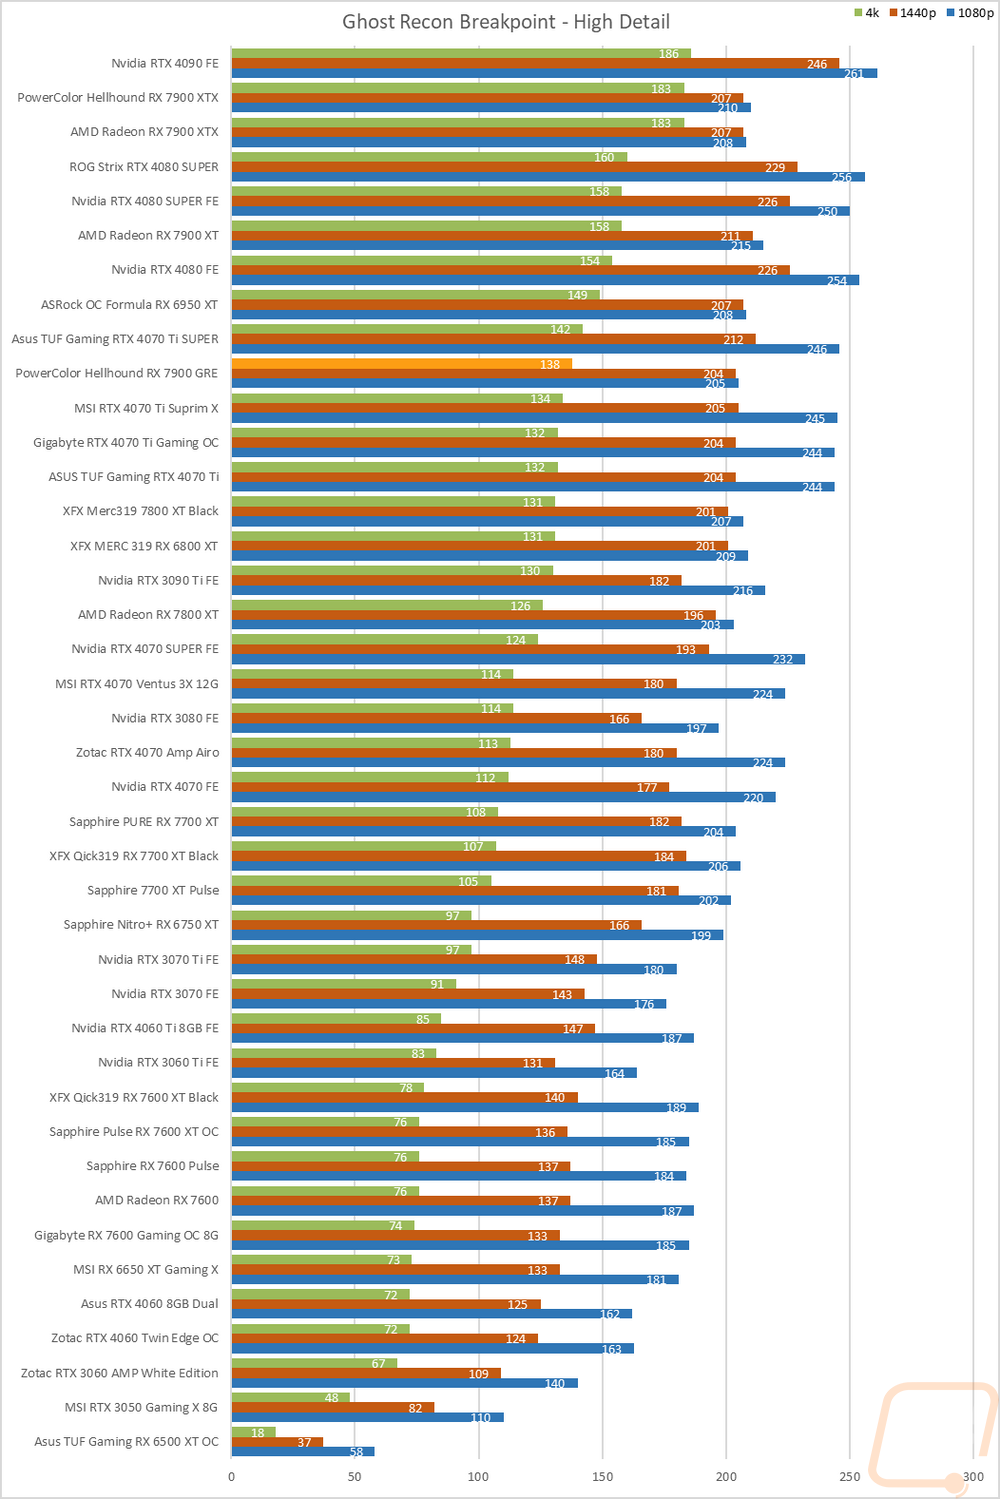
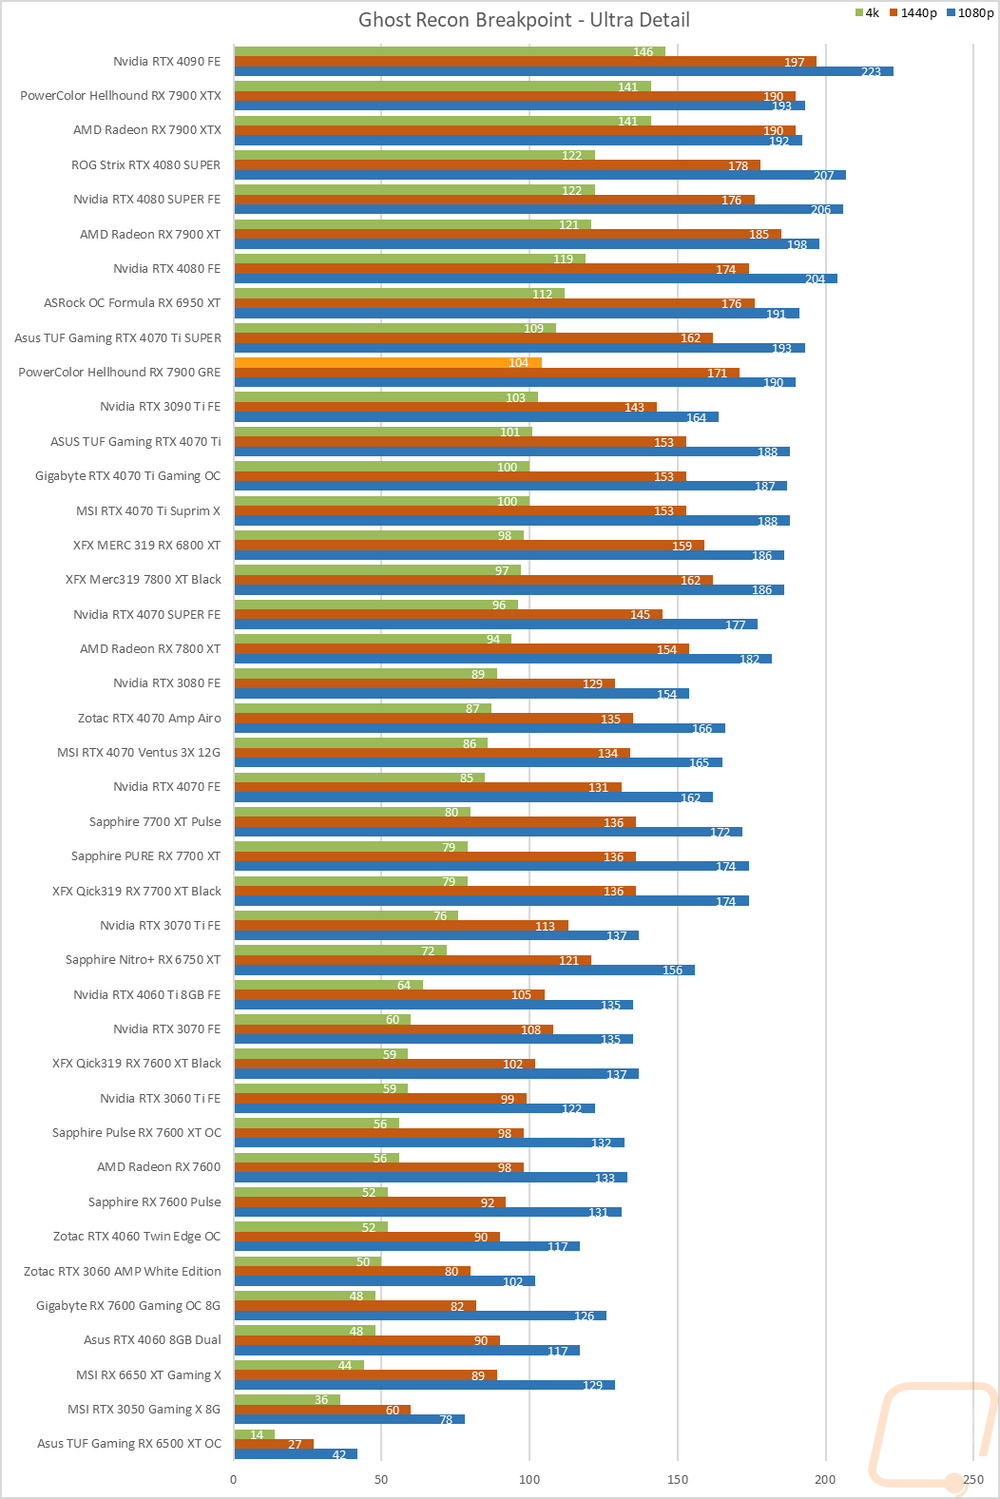
So how did the PowerColor Hellhound RX 7900 GRE do? Well at 1080p there weren’t any big surprises more often than not it was CPU limited but ended up with all of the results up over 120 FPS and for of them were up over 240 FPS. At 1440p we start to get in where the Hellhound RX 7900 GRE shines and at that resolution, all of the results were over 60 FPS but a majority of the results were in the 120 to 239 FPS range. Then there were 2 results up over 240 FPS at that resolution. Then at 4k the Hellhound RX 7900 GRE still did well and ran everything smoothly. 9 of the 14 results were in the over 60 FPS range with the other 5 up over 120 FPS as well.
Of course, I have all of the actual in game results as well for anyone who wants to sort through the wall of graphs below. I also put together a list of most of the cards running all around the RX 7900 GRE and have averaged all of their results at all three resolutions to see where things land. When looking at 1440p and 4k results which is what it is designed for the Hellhound RX 7900 GRE is sitting ahead of the RTX 4070 SUPER but just barely behind the original RTX 4070 Ti. At 1080p however the RTX 4070 SUPER was just slightly faster. The Hellhound RX 7900 GRE does have a significant overclock which might be pushing it up a little closer to the 4070 Ti but overall AMD hit the nail on the head when trying to put together a card that runs right in the middle of the 4070/4070 Ti range.
|
|
1080p |
1440p |
4K |
|
Nvidia RTX 4070 FE |
190.62 |
147.64 |
83.48 |
|
AMD Radeon RX 7800 XT |
190.74 |
156.30 |
89.33 |
|
XFX MERC 319 RX 6800 XT |
197.08 |
162.45 |
92.37 |
|
Nvidia RTX 4070 SUPER FE |
202.65 |
163.65 |
96.05 |
|
Hellhound RX 7900 GRE |
201.40 |
173.47 |
101.59 |
|
ASUS TUF Gaming RTX 4070 Ti |
210.69 |
174.07 |
103.61 |
|
ASRock OC Formula RX 6950 XT |
205.27 |
176.52 |
105.86 |
|
AMD Radeon RX 7900 XT |
211.14 |
186.56 |
114.81 |
|
ASUS TUF Gaming RTX 4070 Ti SUPER |
213.44 |
183.76 |
114.07 |