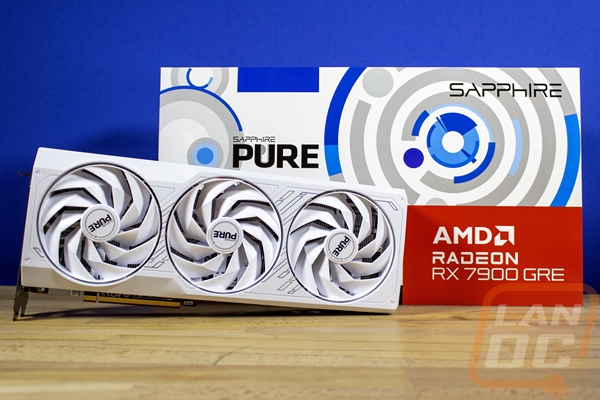
AMD launched, well relaunched their RX 7900 GRE today and I already took a look at the Hellhound that AMD sent over but Sapphire did also send their PURE RX 7900 GRE. I was a huge fan of the PURE the last time so I’m excited to see if their latest version is going to live up to that hype. One thing is for sure though, the PURE branding seems like it would be a great fit with the GRE which is aiming to get top level 1440p and solid 4k performance while keeping costs down. Let’s check out what Sapphire’s latest PURE has to offer and find out how it compares to the competition before these hit stores tomorrow morning.
Product Name: Sapphire PURE RX 7900 GRE
Review Sample Provided by: Sapphire Tech
Written by: Wes Compton
Amazon Affiliate Link: HERE
What is the RX 7900 GRE
Most of you will have heard of the RX 7900 but before getting into what sets the RX 7900 GRE apart, you might be curious what it stands for. Well the GRE started with the RX 6750 GRE which was named that because it was the Golden Rabbit Edition. A Chinese-specific model named GRE because 2023 was the year of the Rabbit. We are in 2024, the year of the Dragon, but the GRE naming has stuck and honestly, it's not as bad/confusing as XTX is when there is an XT model as well but personally I think that just going with RX 7900 would have been simpler and fit with the rest of AMDs naming across the product stack.
All of that said, the RX 7900 GRE shares a LOT with the two other RX 7900 models. Really it is just a step down or cut down of the same Navi 31 GPU. That means it is still an RDNA 3 architecture GPU and made on the same process. The transistor count however does drop down from 57.7 billion to 53.9 billion but the die size is still listed as the same. Where the XT and XTX have 192 ROPs the RX 7900 GRE has 160 and with that, it has 80 compute units and 80 ray accelerators, and 160 AI accelerators. It is 4.7% lower in stream processors compared to the 7900 XT with 5120 in total. For comparison though the 7800 XT sitting below the RX 7900 GRE has just 3840. In addition to the lower processer count AMD has the RX 7900 GRE clocked a little lower as well with the stock game GPU clock speed at 1880 MHz to the 2000 MHz of the 7900 XT and the boost clock is up to 2245 MHz to 2400 MHz on the 7900 XT. That lower clock speed helps put the RX 7900 GRE at 11% lower in simple precision performance. The RX 7900 GRE still has GDDR6 but they have dropped it down to 16GB from 20 GB matching the memory of the RX 7800 XT. It has a 256-bit memory bus as well just like the 7800 XT. Its lower clock speeds help with its power consumption with it sitting at 3 watts lower than the RX 7800 XT at 260 watts total board power. All of that said, with there not being a reference card a lot of the aftermarket cards including the one I will check out today are all overclocked.
|
Specifications |
RX 7800 XT |
RX 7900 GRE |
RX 7900 XT |
RX 7900 XTX |
|
Architecture |
RDNA 3 |
RDNA 3 |
RDNA 3 |
RDNA 3 |
|
Manufacturing Process |
5nm GCD + 6nm MCD |
5nm GCD + 6nm MCD |
5nm GCD + 6 nm MCD
|
5nm GCD + 6 nm MCD
|
|
Transistor Count |
28.1 Billion |
53.9 billion |
57.7 billion |
57.7 billion |
|
Die Size |
200mm² GCD 150mm² MCD |
300 mm2 GCD 220 mm2 MCD |
300 mm² GCD 220mm² MCD |
300 mm² GCD 220mm² MCD |
|
Compute Units |
60 |
80 |
84 |
96 |
|
Ray Accelerators |
60 |
80 |
84 |
96 |
|
AI Accelerators |
120 |
160 |
168 |
192 |
|
Stream Processors |
3840 |
5120 |
5376 |
6144 |
|
Game GPU Clock |
2124 MHz |
1880 MHz |
2000 MHz |
2300 MHz |
|
Boost GPU Clock |
Up to 2430 MHz |
Up to 2245 MHz |
Up to 2400 MHz |
Up to 2500 MHz |
|
Peak Single Precision Perf. |
Up to 37 TFLOPS |
Up to 45.98 TFLOPS |
Up to 52 TFLOPS |
Up to 61 TFLOPS |
|
Peak Half Precision Perf. |
Up to 74 TFLOPS |
Up to 91.96 TFLOPS |
Up to 103 TFLOPS |
Up to 123 TFLOPS |
|
Peak Texture Fill-Rate |
Up to 583 GT/s |
Up to 339.8 GT/s |
Up to 810 GT/s |
Up to 960 GT/s |
|
ROPs |
96 |
160 |
192 |
192 |
|
Peak Pixel Fill-Rate |
Up to 233 GP/s |
Up to 359.2 GP/s |
Up to 460 GP/s |
Up to 480 GP/s |
|
AMD Infinity Cache™ |
64 MB (2nd Gen) |
64 MB (2nd. Gen.) |
80 MB (2nd. Gen.) |
96 MB (2nd. Gen.) |
|
Memory |
16GB GDDR6 |
16GB GDDR6 |
20GB GDDR6 |
24GB GDDR6 |
|
Memory Speed |
19.5 Gbps |
18 Gbps |
20 Gbps |
20 Gbps |
|
Effective Memory Bandwidth w/ AMD Infinity Cache™ |
Up to 2708.4 GB/s |
Up to 2265.6 GB/s |
Up to 2900 GB/s |
Up to 3500 GB/s |
|
Memory Bus Interface |
256-bit |
256 -bit |
320-bit |
384-bit |
|
PCIe® Interface |
PCIe 4.0 x16 |
PCIe 4.0 x16 |
PCIe 4.0 x16 |
PCIe 4.0 x16 |
|
Total Board Power |
263W |
260 W |
315W |
355W |
|
Launch MSRP |
$499 |
$549 |
$899 |
$999 |
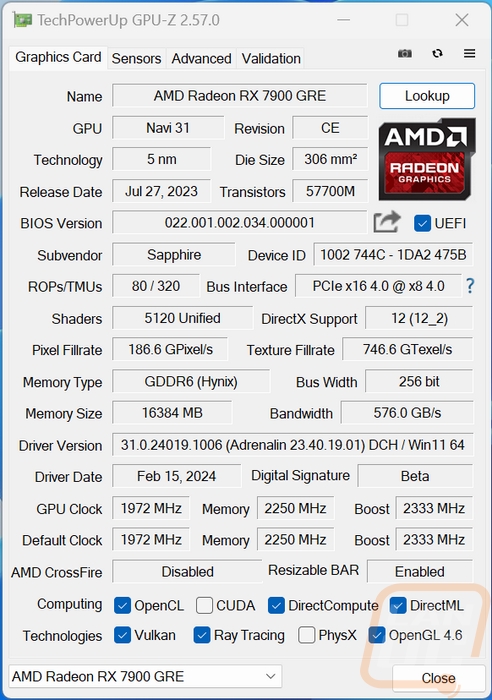
Before getting into testing I did also run GPUz to double-check that our clock speeds matched up with the specifications. The Sapphire PURE RX 7900 GRE is an overclocked card, coming in with a boost clock of 2333 MHz which is a little lower than the boost clock on the Hellhound but over the stock clock speed of 2245 MHz. Then for the game clock speed the PURE RX 7900 GRE is overclocked once again at 1972 Mhz but down from what we saw on the Hellhound. I tested with the 31.0.24019 driver and GPUz also notes the BIOS version just in case we need that in the future as well.
Packaging
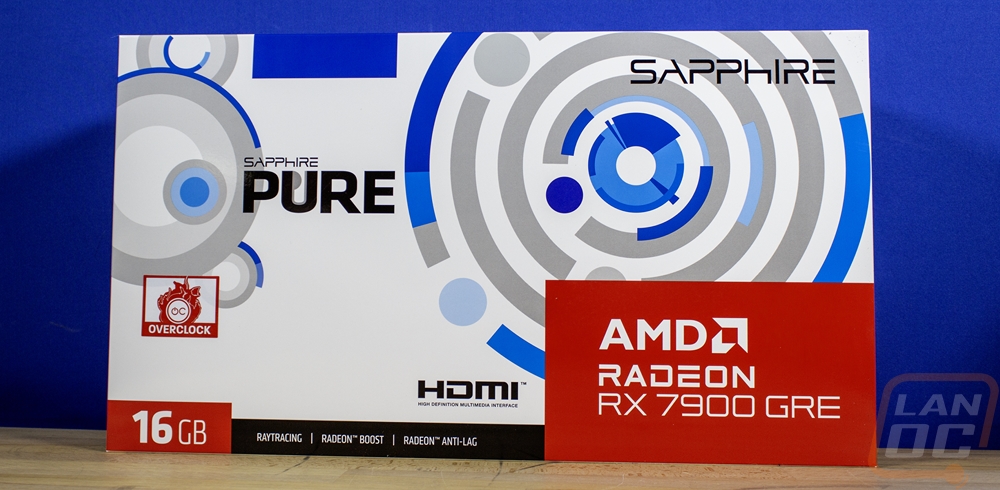
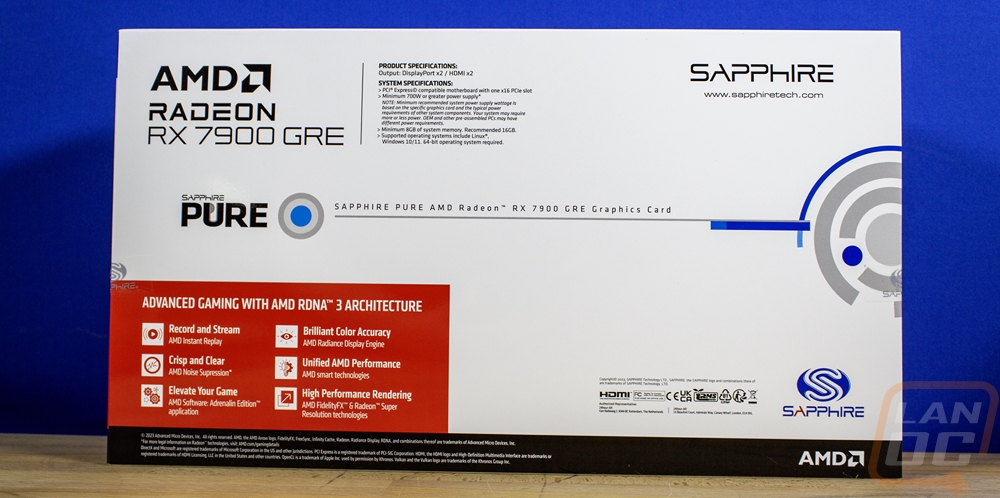
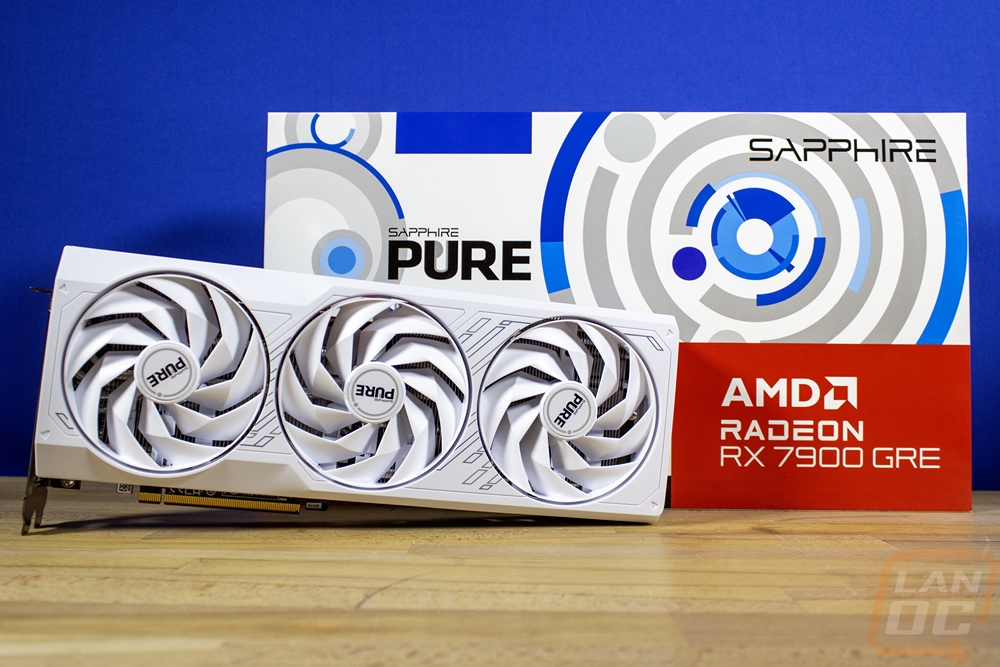
If you saw my previous review of the Sapphire RX 7700 XT PURE in September the packaging for the PURE RX 7900 GRE is going to look familiar. Sapphire has gone with the same bright white background and the circles and dots design all over the front of the box. The only change here is where there were purple accents last time, the PURE RX 7900 GRE has shades of blue. The Sapphire logo in the top right and above the PURE logo were both there and of course, AMDs wrap around. The wrap-around has a large red block on the bottom right corner which has the GPU model name then a line across the bottom that highlights things like Radeon Boost and Anti-Lag. Then they have the card's VRAM capacity in the bottom left. Being an overclocked card, this does have the Overclock sticker on it. The design here looks good, but I do think a nice picture of the card itself would be even better for the front of the packaging. It’s one thing when you order something online, but being able to see what you are getting is a lot easier with pictures on the front. Especially when the back of the box here doesn’t have any pictures as well. In fact, they just have a basic specification listing that lets you know the display connections and system requirements. Card dimensions and clock speeds would be really helpful as well.
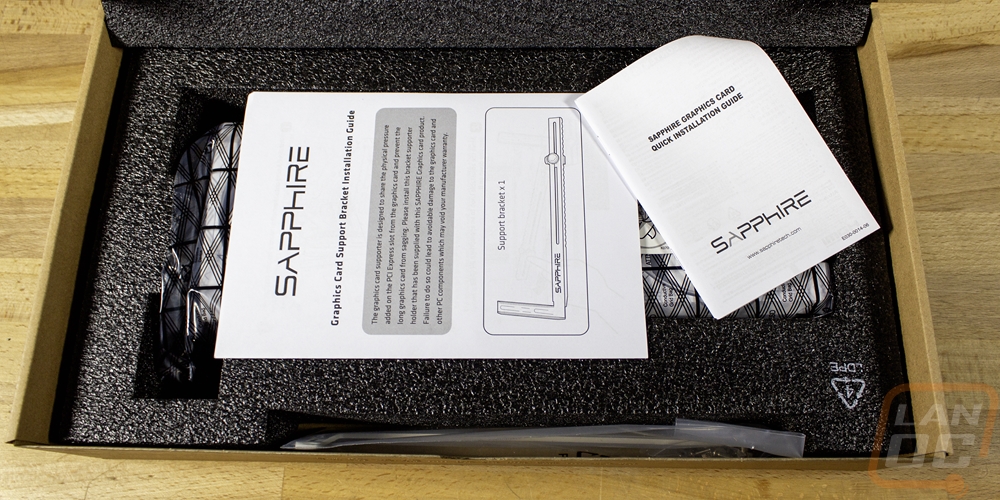
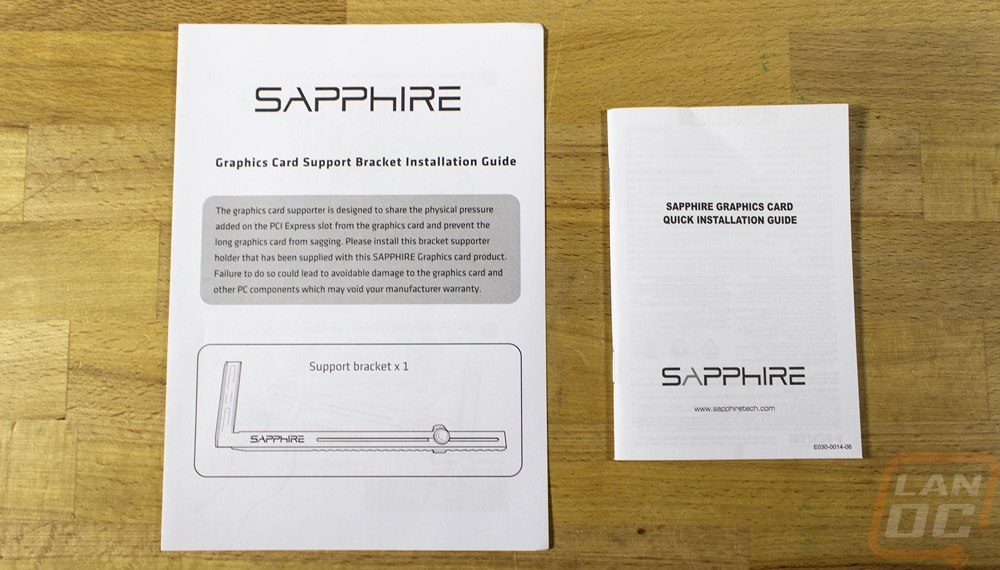
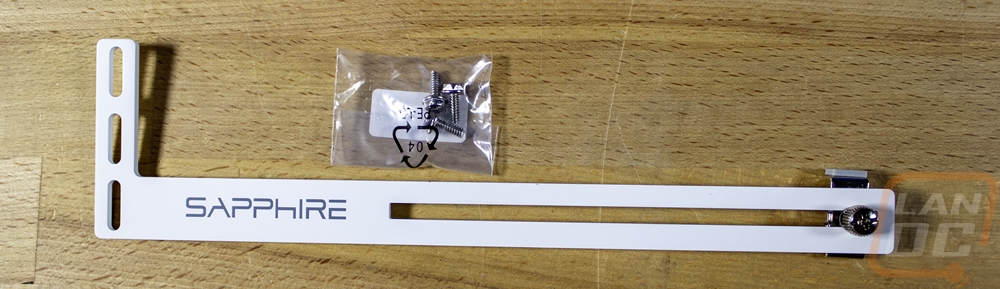
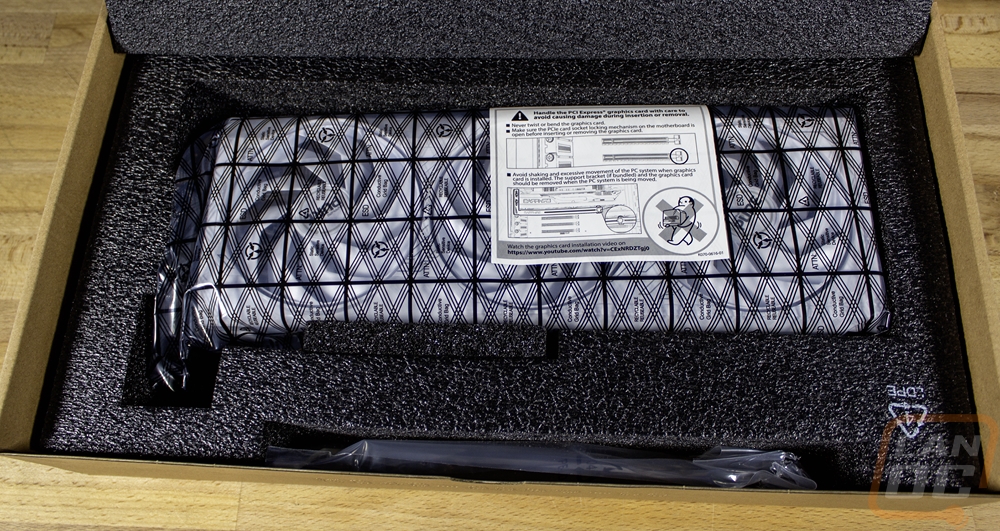
Once you pull the outer box off, inside there is a brown box. This provides all of the real structure and strength. Opening this one up has a thick foam panel sitting on top. When you lift that up the documentation is sitting there and then you have the PURE RX 7900 GRE in a static protective bag. The card sits in its own cutout in the thick foam in the bottom of the box. There is also a second slot which has the support bracket. For documentation, you get a basic universal quick installation guide and then a guide for installing the included support bracket. That bracket is a thick metal bracket with a nice matching white finish and the Sapphire logo across it and is adjustable in length but with the PURE RX 7900 GRE why wouldn’t you run it at its full extension for the most support?
Card Layout and Photos
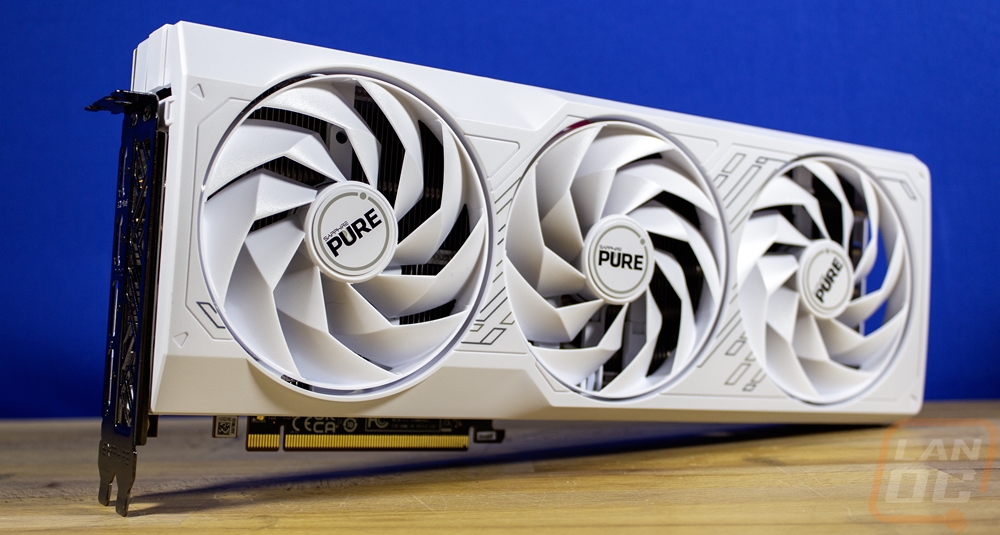
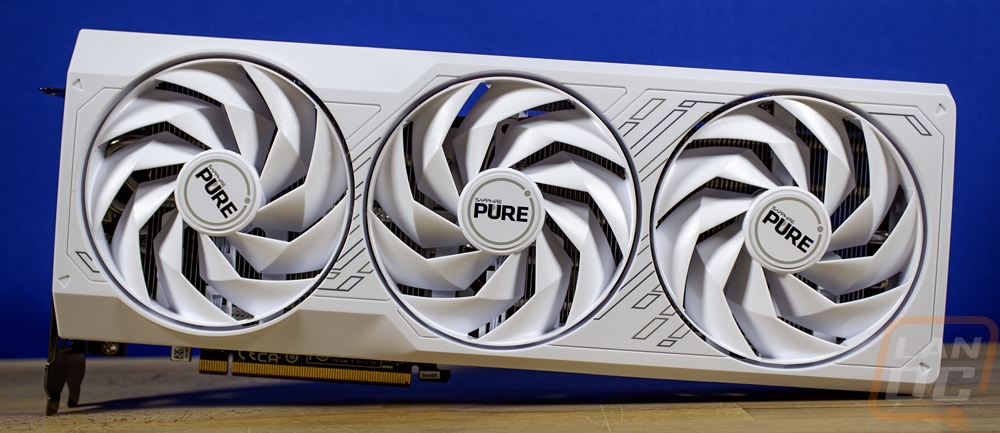
When I took a look at the Sapphire 7700 XT PURE last fall, it was the first Sapphire card that I had taken a look at with a full white design, and even before that Sapphire only had a few limited availability white options that didn’t go full white. So it is exciting to see that they are leaning completely in on the full white PURE lineup with this being the second launch with the option available. These in my opinion are the best looking Sapphire cards out there and short of not having a full metal shroud design there isn’t much more I could ask for aesthetically. That said nothing has changed between this and the 7700 XT PURE, so if you saw that card this is the same look. That’s good though, why change a good thing? The design has a triple fan configuration and a white plastic fan shroud with it all in a bright white. Sapphire has added in a few grooved accents across the front of the card as well as hockey stick-like grey accents around the fans. They have done a great job with having some flair but keeping a clean look.
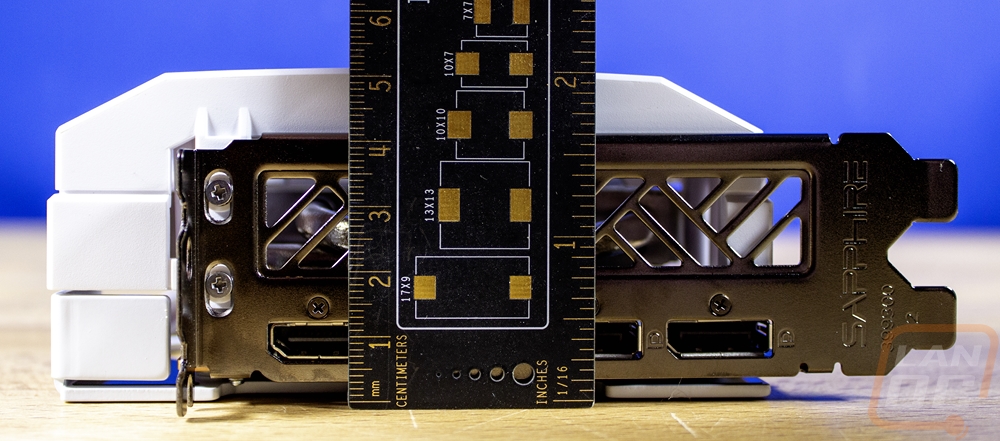
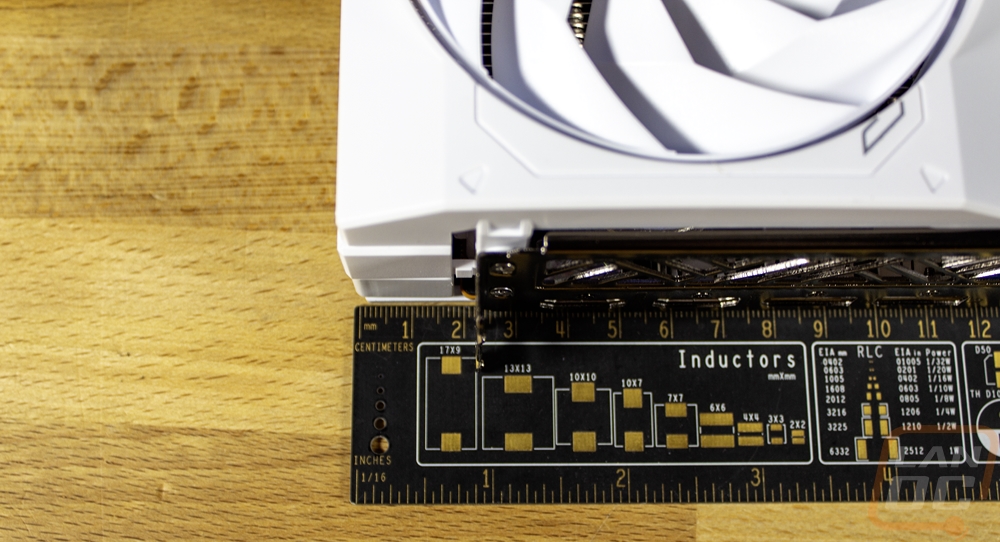
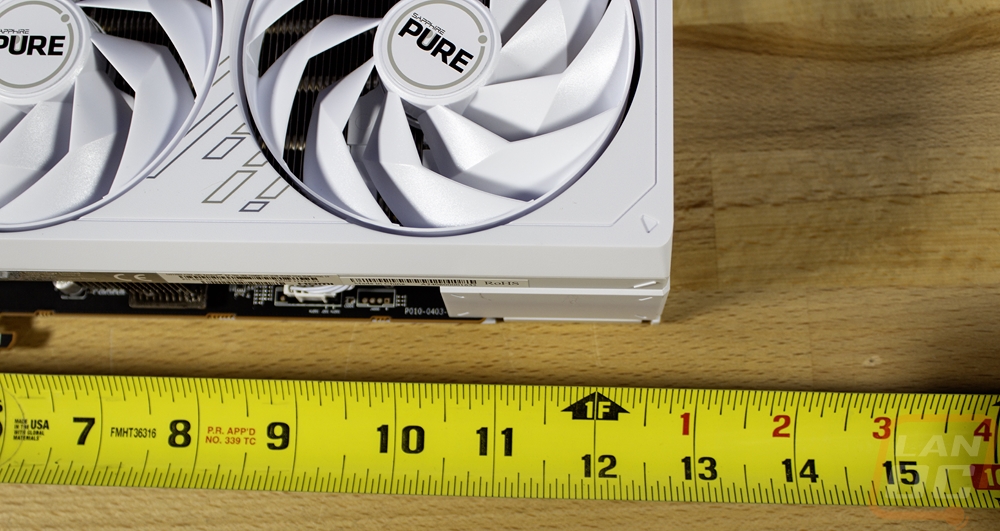
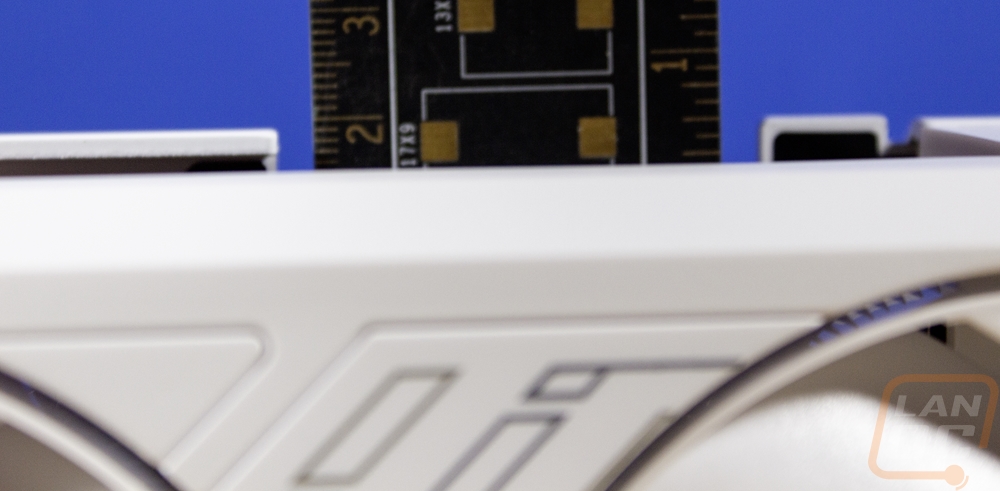
The PURE RX 7900 GRE isn’t a small card but at this card performance level, I would consider this to be a relatively compact card. Of course, that means it is what would have been a large card just a generation or two ago. The card extends past the top of the PCI bracket 23mm which is just using the cable space efficiently so it isn’t tall there at all. It is 51mm thick which is a hair past the 2.5 slot thickness. Then for length, it is 320 mm long, interestingly almost exactly the same size as the Hellhound that I previously took a look at.
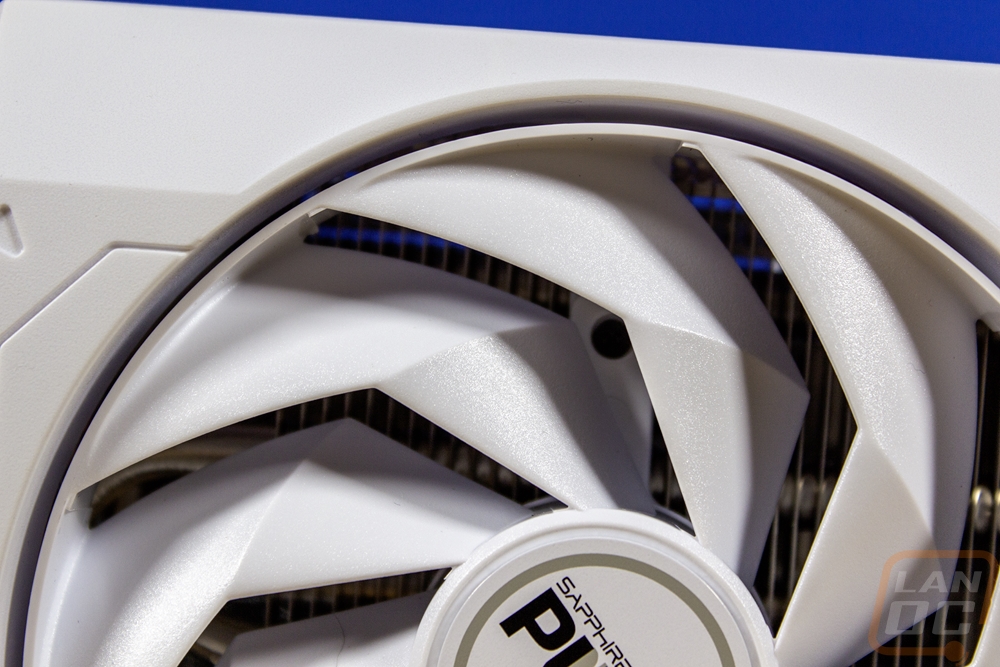
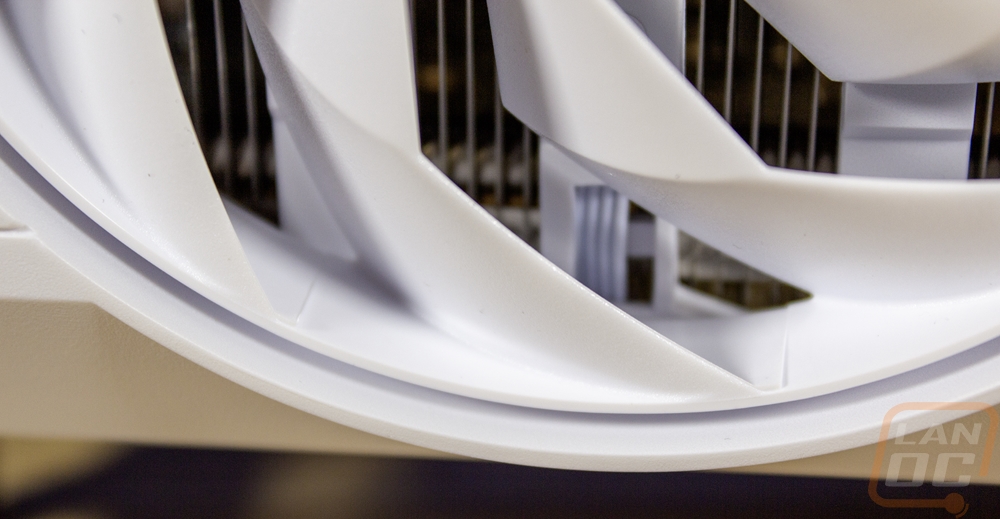
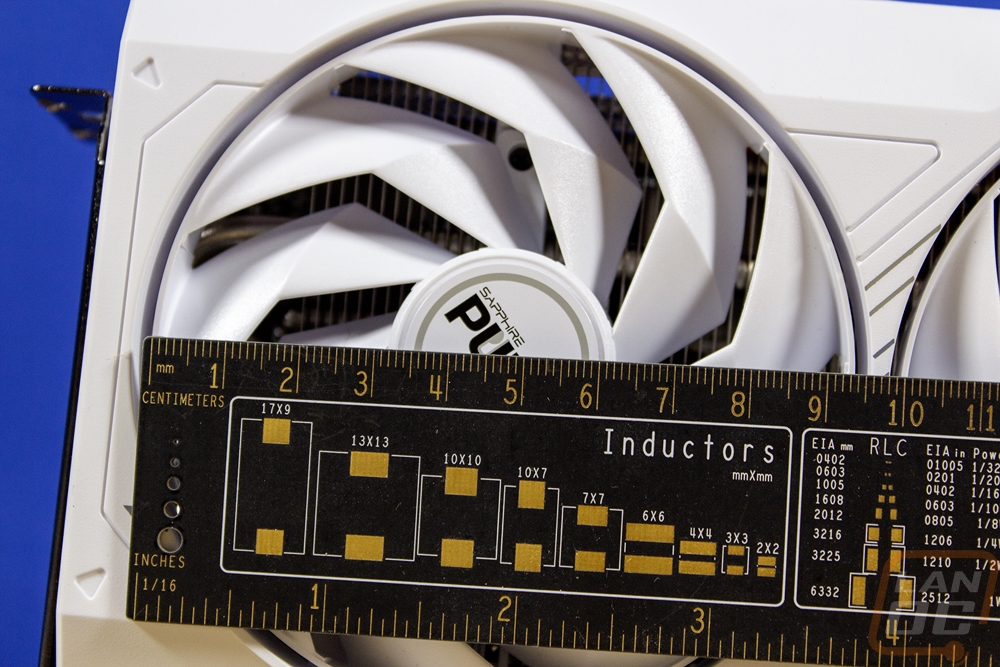
The fan side of the PURE RX 7900 GRE has three equal-sized fans. This is the same configuration I saw previously. The middle fan is flipped around to spin in the opposite direction, this helps cut down on turbulence where the fans are closest together which helps with noise and also means the fans fight against each other less. The fans themselves are 95 mm long and in a 100 mm opening. They have a dual angle design which has a hard cut halfway up the blades rather than the older style rounded blades. Then at the outside edge, they all three have a ring around the outside. This gives more strength to the fans and helps focus the fans down in their axial action down into the heatsink. Speaking of the heatsink from this view we can see the PURE RX 7900 GRE has an aluminum sheet metal design with the fins in a vertical orientation that will push air up and down to the top and bottom of the card. Each of the three fans are all bright white and matches the white plastic fan shroud. They have a white sticker in the center with the Sapphire PURE branding and a single sand colored circle with a dot around them, just like the design on the outside of the packaging.
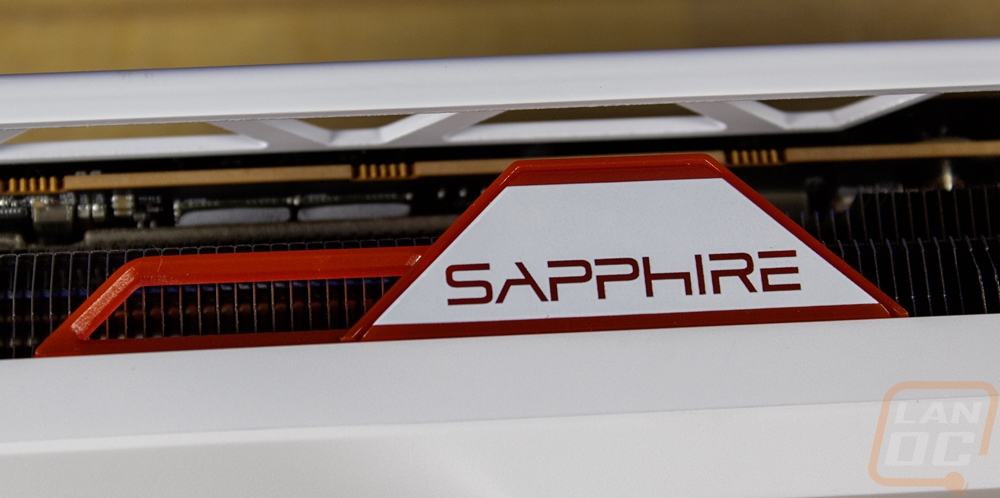
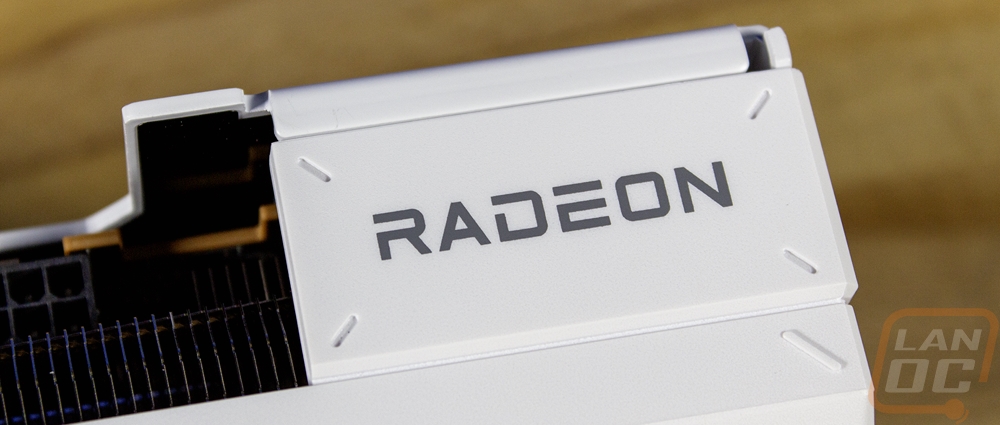
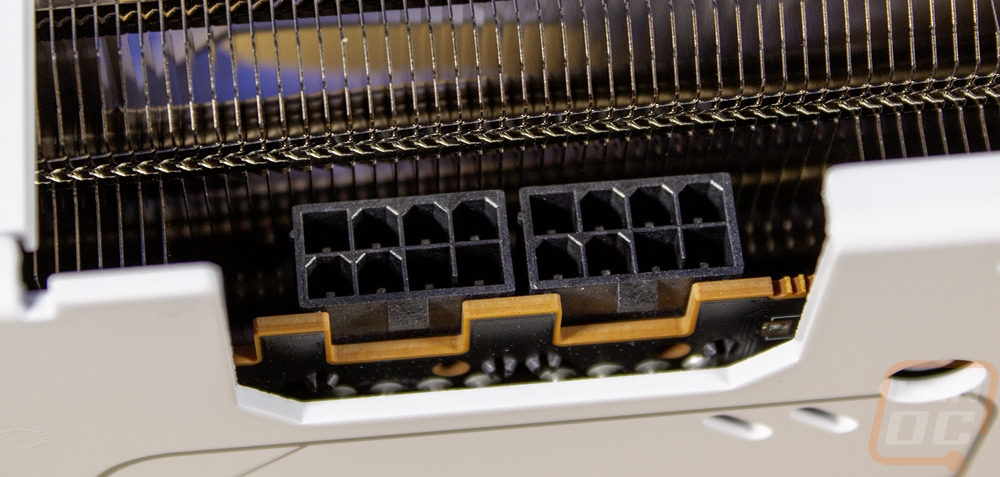
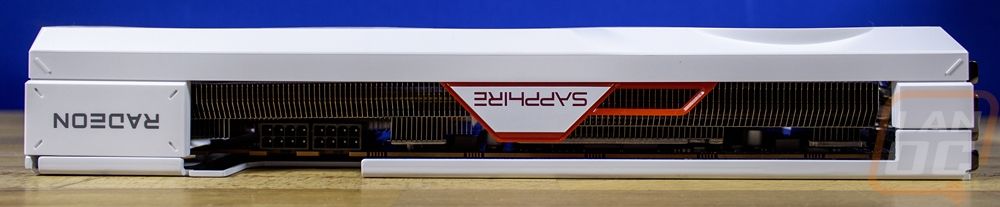
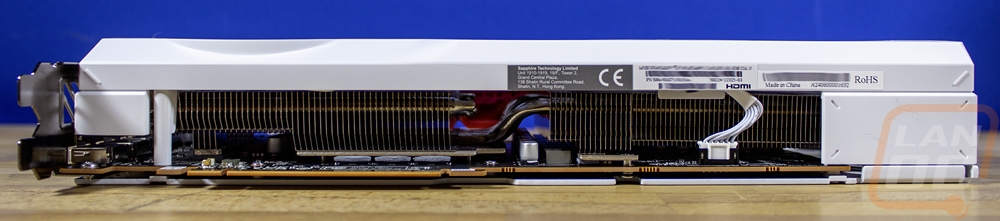
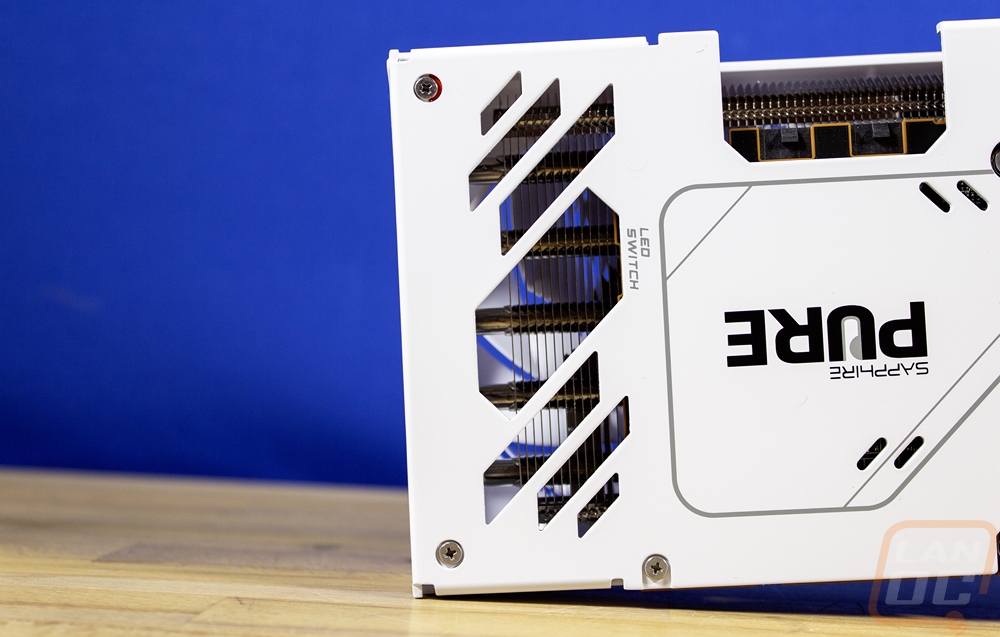
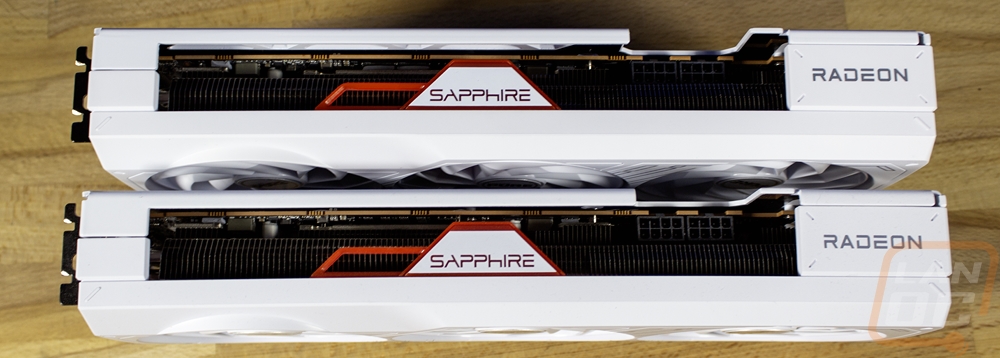
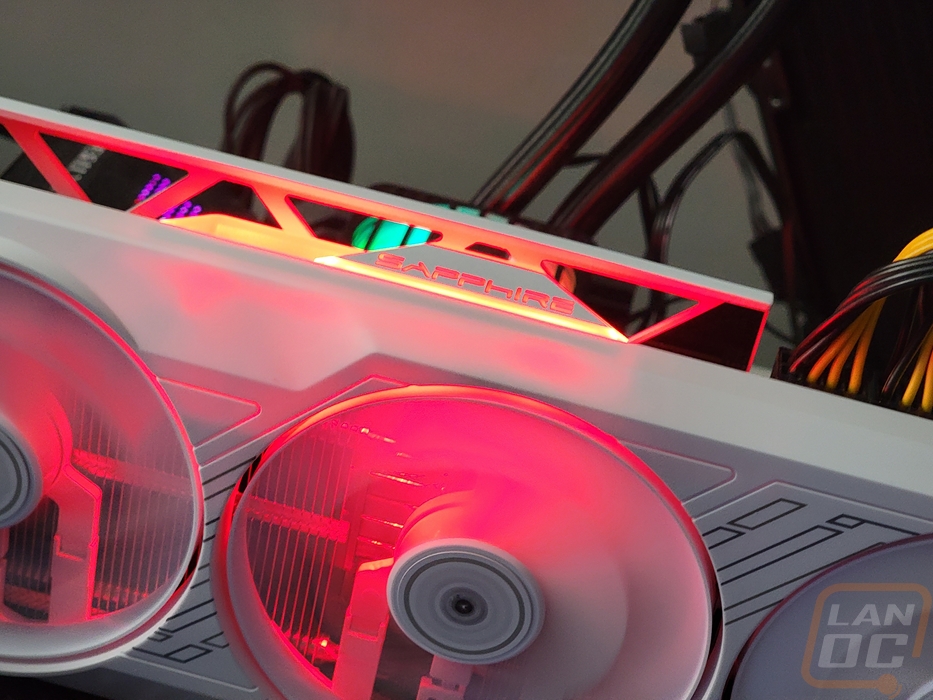
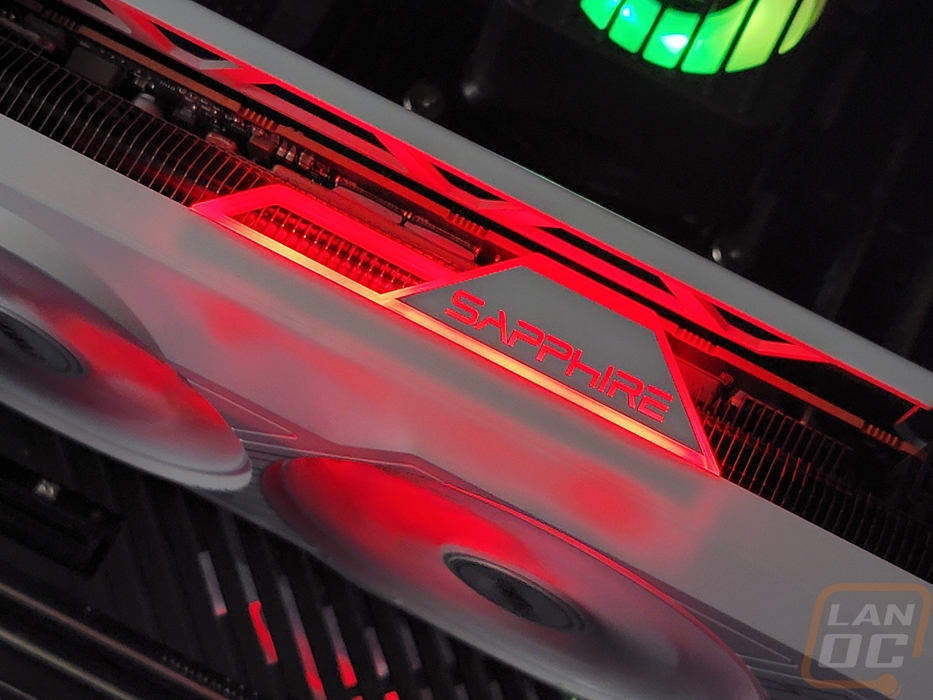
Up along the top edge of the PURE RX 7900 GRE, a few different things are going on. The front fan shroud wraps around and the same goes for the metal backplate. Seeing the backplate wrap around here is huge for overall card strength as that gives the backplate a LOT more strength. The center section is open except for the Sapphire logo in the center which is in a white section printed on a red tab. While you can’t see it here, this is translucent and has backlighting to light the logo up. The Radeon logo is also on the top edge but down at the end on a section of the shroud that connects to the back of the card to cover up the area past the end of the PCB. Then of course there are power connections. The PURE RX 7900 GRE has the same two 8-pin PCIe power connections that we saw on the Hellhound. They are recessed way down into the card with the cooler and shroud all sticking up past the PCB. It is a total of 16mm down and what this means is when you plug in your power connections they won’t stick out of the top of the card. It looks better with these recessed and also gives Sapphire more room for cooling by using dead space, a win-win.
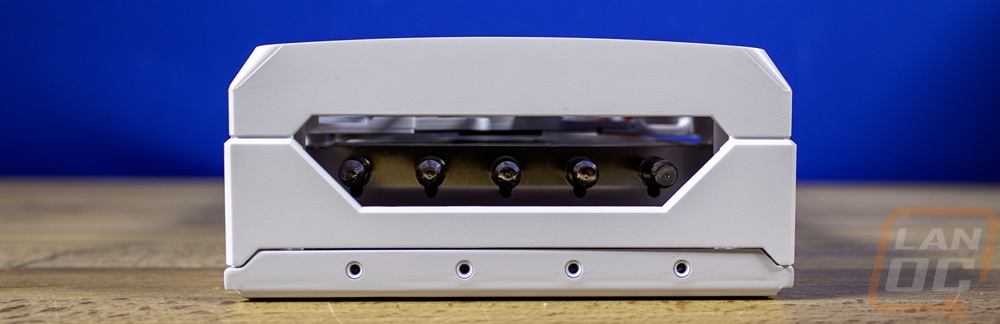
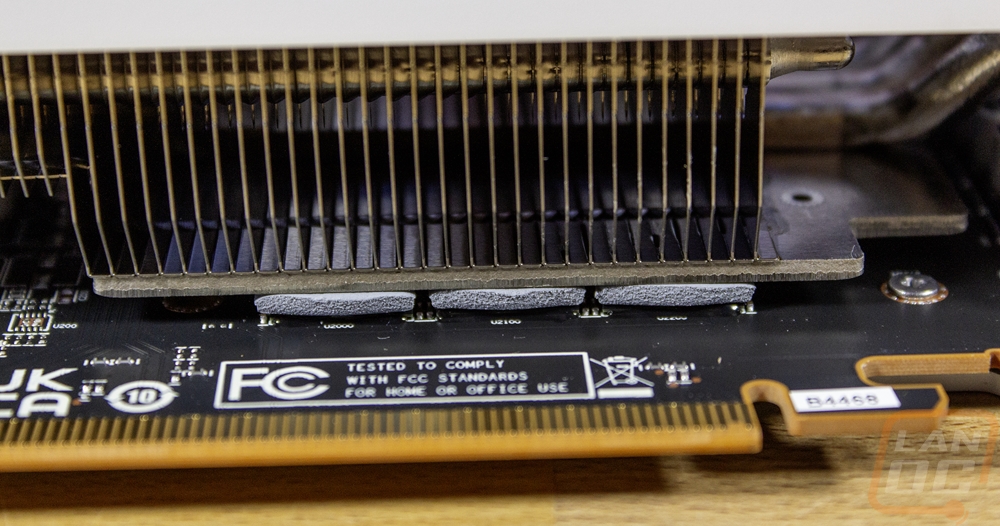
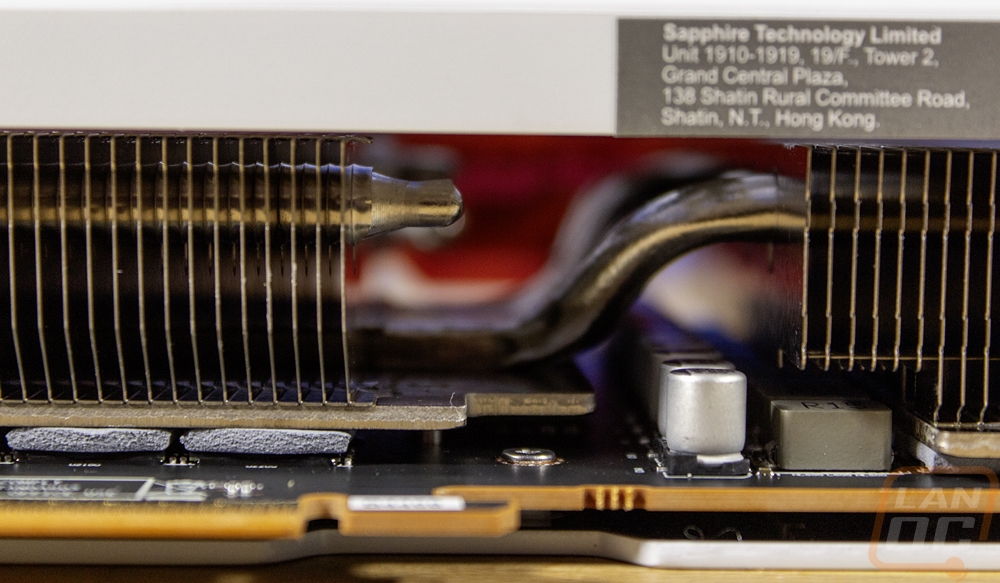
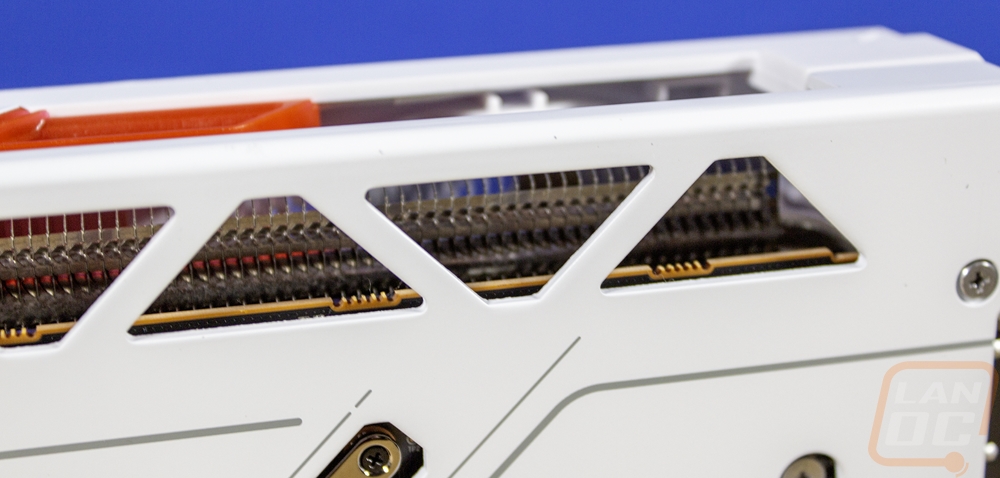
Looking around at the top and bottom edges and the end of the PURE RX 7900 GRE gives us a little more information on Sapphire's cooling configuration as well. At the top, we can see the opening for airflow. This is slightly restricted but Sapphire has accounted for that with openings in the backplate. The bottom view shows us that Sapphire has the cooler tight against the entire card, taking advantage of any space. They also have heatplates over the GPU and memory as well as on the right for the VRM whereas the Hellhound just had the heatplate for the GPU/memory. The heatpipes have contact with the heatplate and then loop back around for the left side of the card. For the right side, there is a gap between the heatsinks where the heatpipes move up past the center of the heatsink and run to the end of the card. Speaking of the end of the card, that does have an opening which gives us a look at the 5 heatpipes going through the aluminum sheet metal heatsink. The end has the backplate wrapped around for even more strength. That section also has four threaded holes for using some card support options as well.
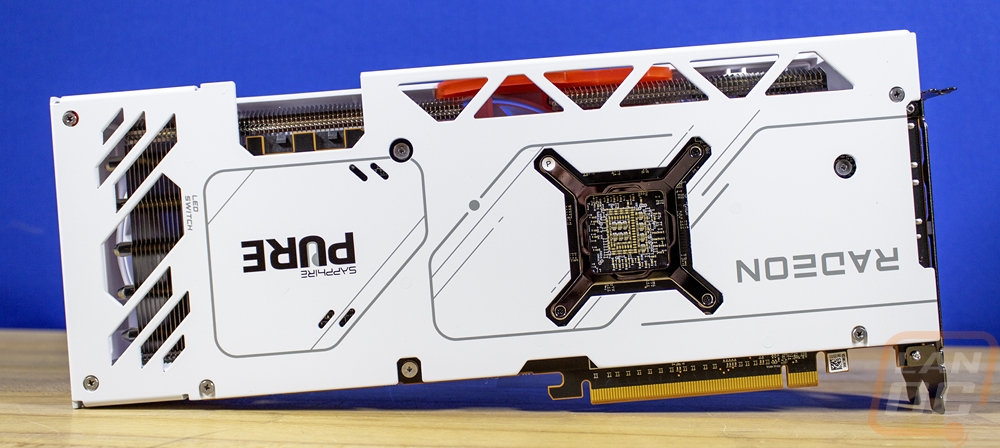
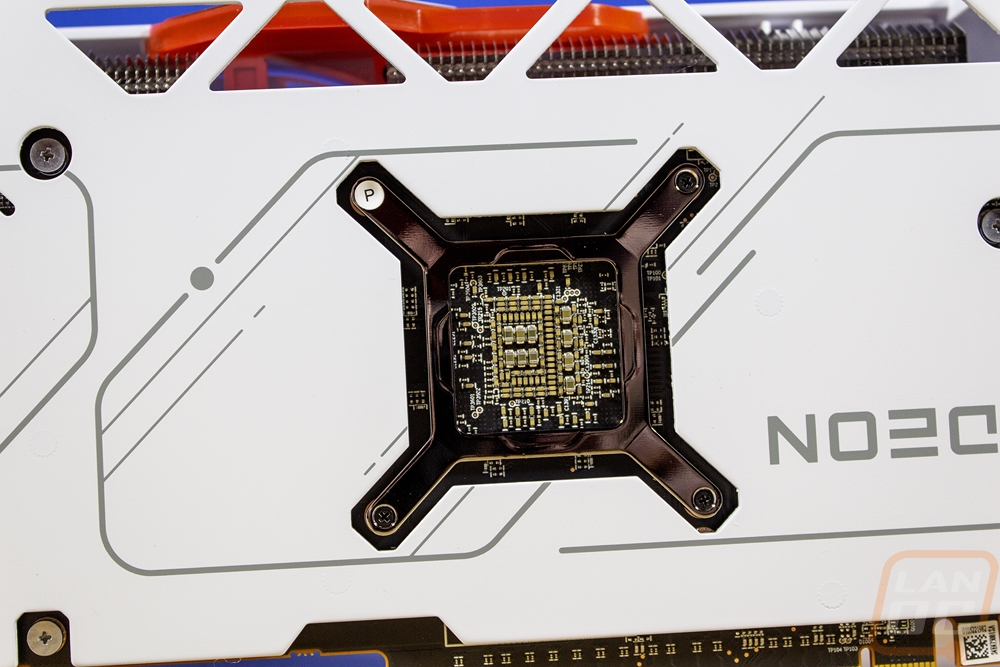
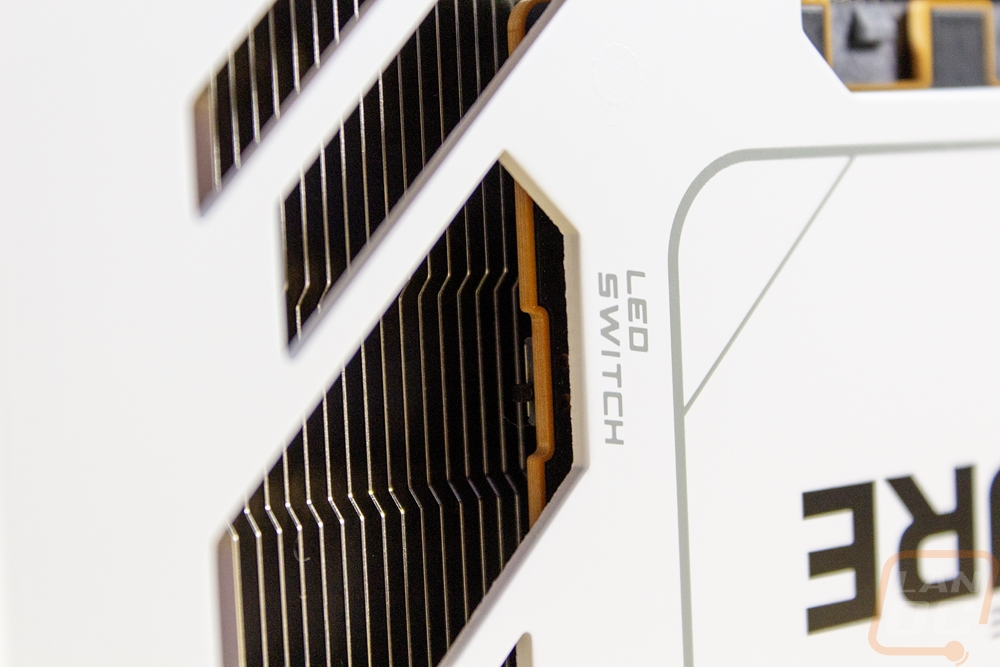
I love the bright white backplate on the PURE RX 7900 GRE that matches the rest of the card. A lot is going on back here though surprisingly. Sapphire has put the Radeon logo in grey as well as their logo and the PURE branding with all of those flipped around to be readable when installed in most cases. Along with that though they have grey accent lines around both logos and in the center as well. Then the backplate has a few different openings on it especially along the top where they have opened up ventilation to help give even more room for all of the airflow to vent out. This also means that all of the heatsink that extends up past the PCB along the top can blow right through as well. There is the big cutout around the power connections of course. Then down at the end, there is a relatively short blow-through section. Where the top openings are triangle-like but technically pentagons because the tips are cut off, the openings here are stripes. This area also has one larger opening and Sapphire has hidden a small switch on the end of the PCB. It is labeled on the backplate and this lets you turn the lighting off if you don’t want or like the red lighting. The back of the GPU including the GPU backplate bracket are also cut around leaving those exposed. This is better for cooling as that is the hottest spot on the back of the PCB but you do trade off some protection as well.
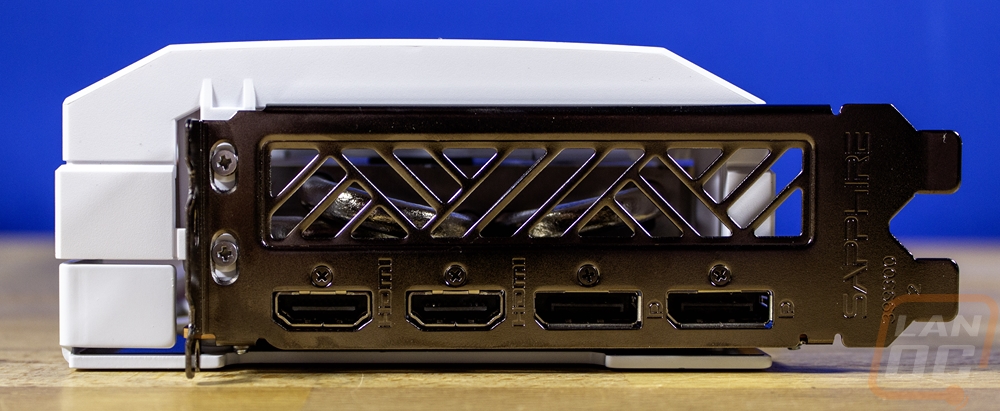
For display connections, the PCI bracket end of the PURE RX 7900 GRE has four connections. Sapphire has gone with a combination you don’t see often with two HDMI and two DisplayPort connections. The two HDMI are together towards the top of the bracket and the two DisplayPort are at the bottom. The standard these days has been three DisplayPort and one HDMI and I have seen Sapphire do this on lower end cards. For the lower end cards, this makes a lot of sense, people who aren’t running new high refresh displays or high resolutions wouldn’t need a higher end card and also wouldn’t be using DisplayPort sometimes. But for the PURE RX 7900 GRE, I was surprised with this decision because this is in the performance range where you more likely have or will be getting new monitors. Of course, none of it matters unless you are trying to run more than two of either type which is relatively rare anyhow. The back bracket also has some venetation cut into it with it taking up about half of the bracket. The bracket itself has a tinted metal finish, given how much white was used for the card it would have been cool to see this finished in white to match. Beyond that, each display connection does have a label stamped into it, and the Sapphire logo is also stamped in it down at the bottom.
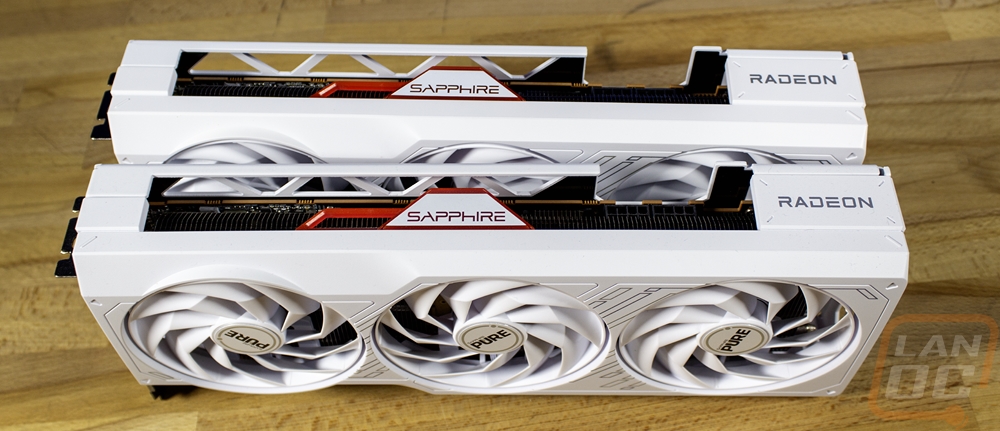
I mentioned having taken a look at the 7700 XT PURE recently. Well, I thought I would put the two cards next to each other and other than some dust on one card you can’t tell the difference between the two cards. The 7700 XT PURE was large for it being a 7700 XT but the cooler fits the RX 7900 GRE a lot better here. Having the two together does make me miss Crossfire though.
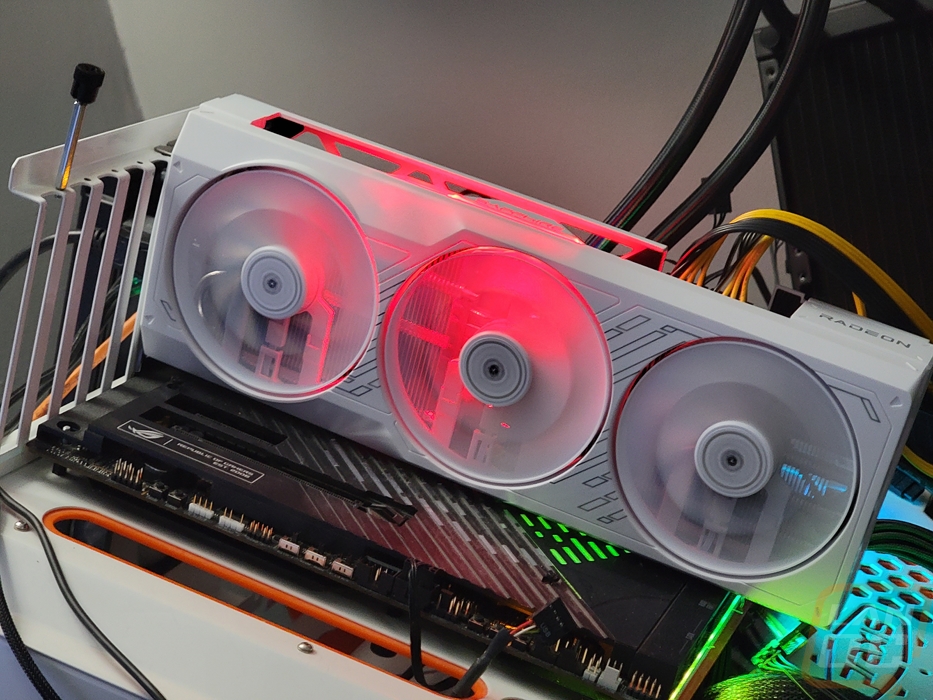
Before getting into testing I did also get a few pictures of the lighting on the PURE RX 7900 GRE. With the full white card other than the one red accent, I think most people would have gone in expecting white lighting if anything at all. But just like the last PURE card I took a look at, Sapphire went with red. It doesn’t look bad with the red glowing through but I would prefer if the lighting ran the length of the card to be consistent at least. I know it's all about the Sapphire logo up top glowing, but it makes it feel like they just tossed a few LEDs in to say that it has lighting on some marketing listing.
Test Rig and Procedures
CPU: Intel Core-i9 13900K – Live Pricing
PL1=PL2: 253, τ: 56 / 307A
Motherboard: Asus Z790 Extreme – Live Pricing
Cooling: Corsair H100i Elite LCD Display - Live Pricing
Noctua NT-H1 Thermal Paste - Live Pricing
Memory: Crucial 32GB Kit (2 x 16GB) DDR5-5600 UDIMM– Live Pricing
Storage: Viper VP4300 Lite 4TB – Live Pricing
Power Supply: be quiet! Dark Power Pro 13 1600W- Live Pricing
Case: Primochill Wetbench - Live Pricing
OS: Windows 11 Pro 64-bit - Live Pricing
|
Our Testing Procedures |
|
|
3DMark |
All 3DMark-based tests are done using the most recent version. We test using all three versions of Fire Strike, Both Time Spy and Time Spy Extreme, and Speed Way. Tests to look at ray tracing performance are done with Port Royal when supported and for Nvidia cards that support DLSS, the DLSS subtest is also done at 1440p with the performance setting and DLSS 2.0 as well as a look at DLSS 1, 2, and 3 at 4K. |
|
Unigine Superposition |
1080p Extreme and 4k Optimized benchmarks along with the VR Future test are done. The VR test is done at the Oculus resolution |
|
VRMark |
Only the Blue room test is run |
|
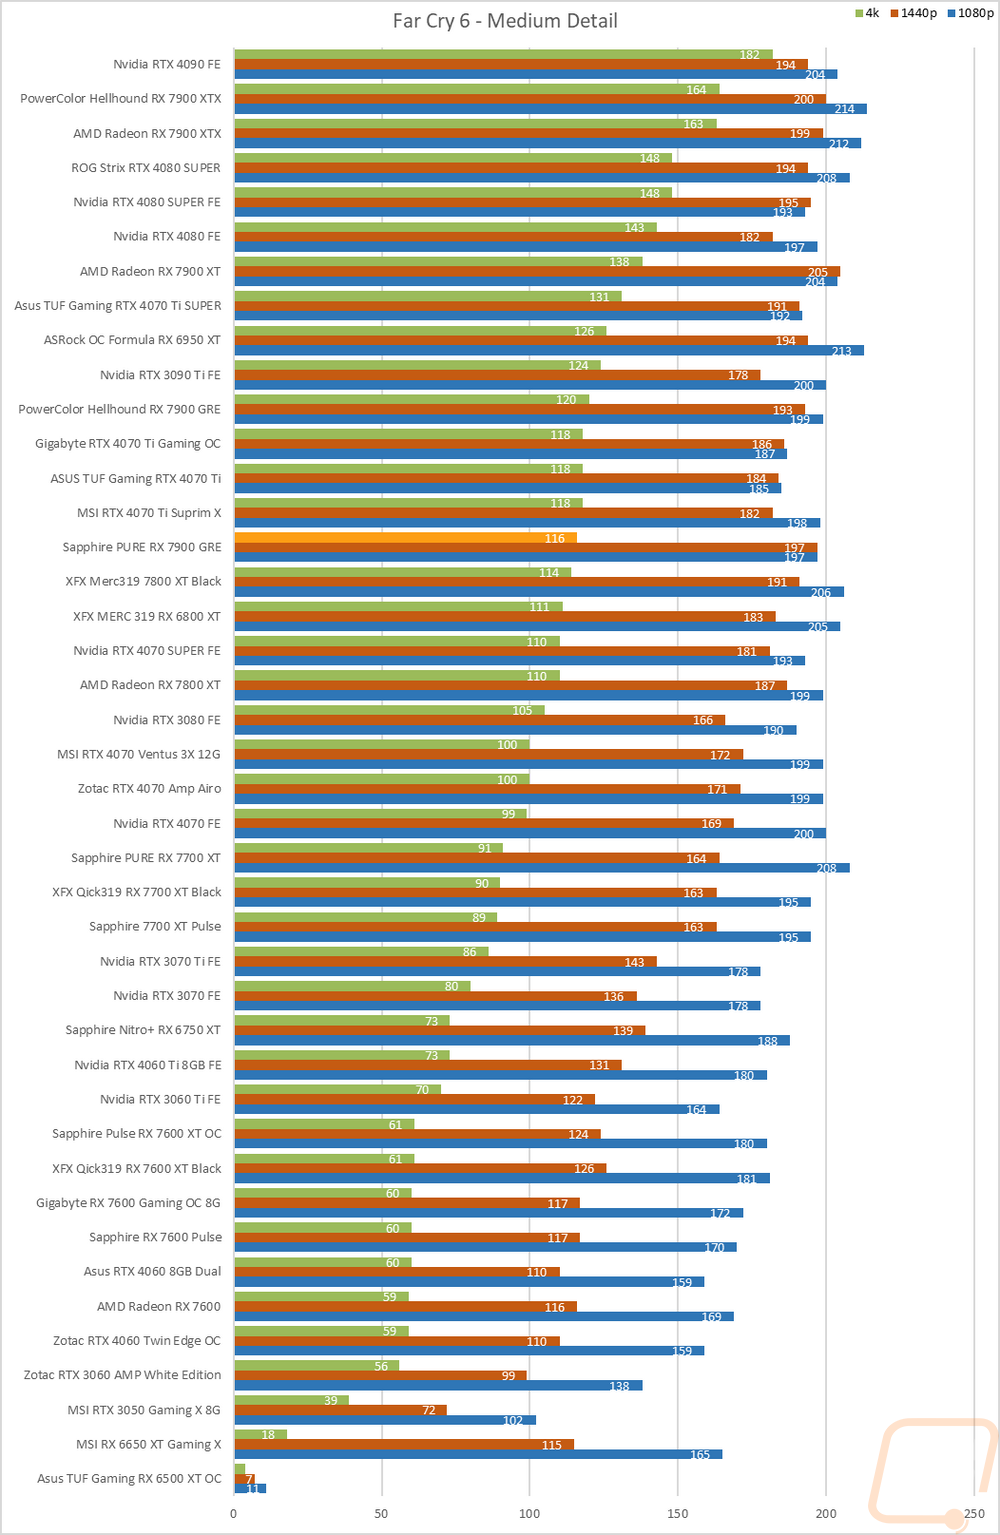
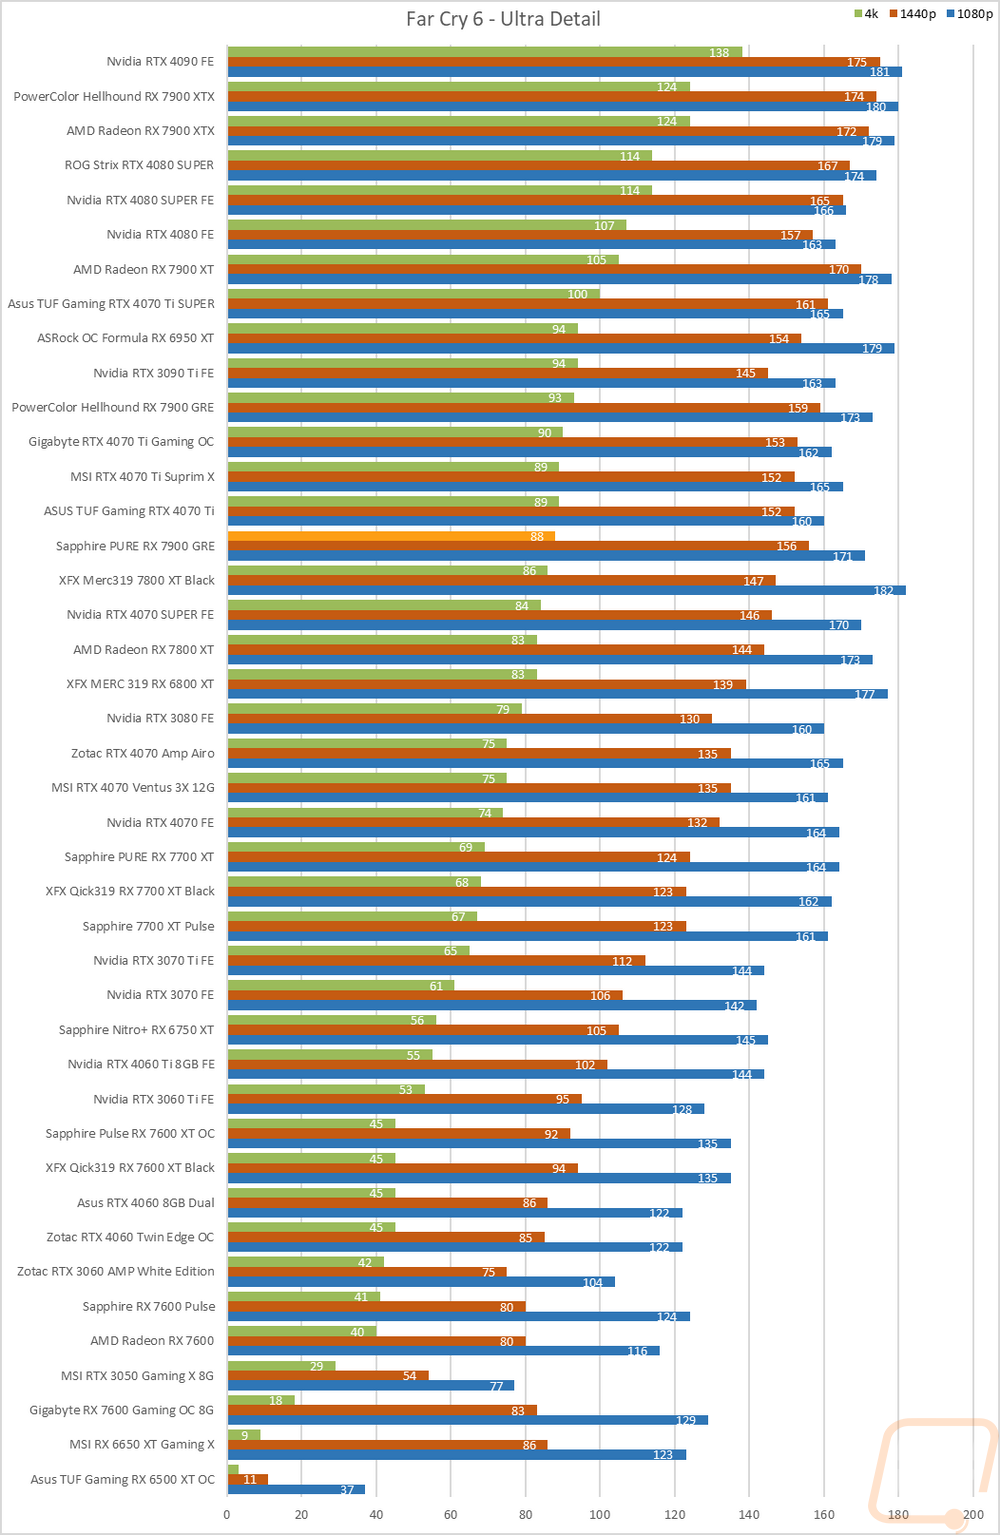
Far Cry 6 |
Built-in benchmark tested at 1080p, 1440p, and 4k with the Ultra and Medium detail settings |
|
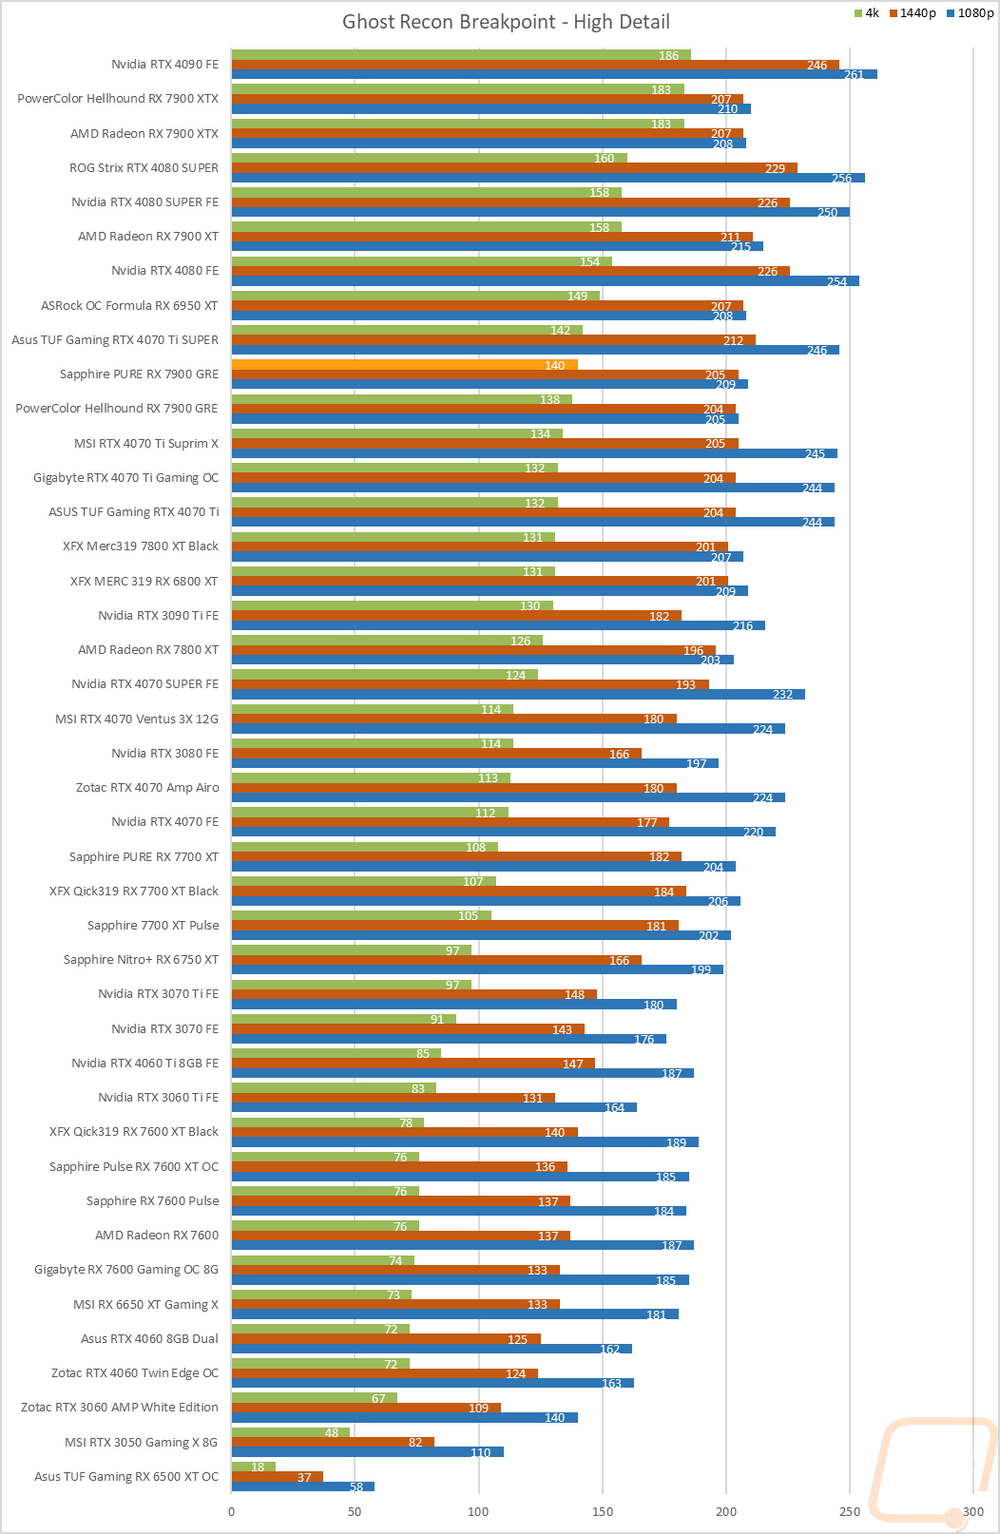
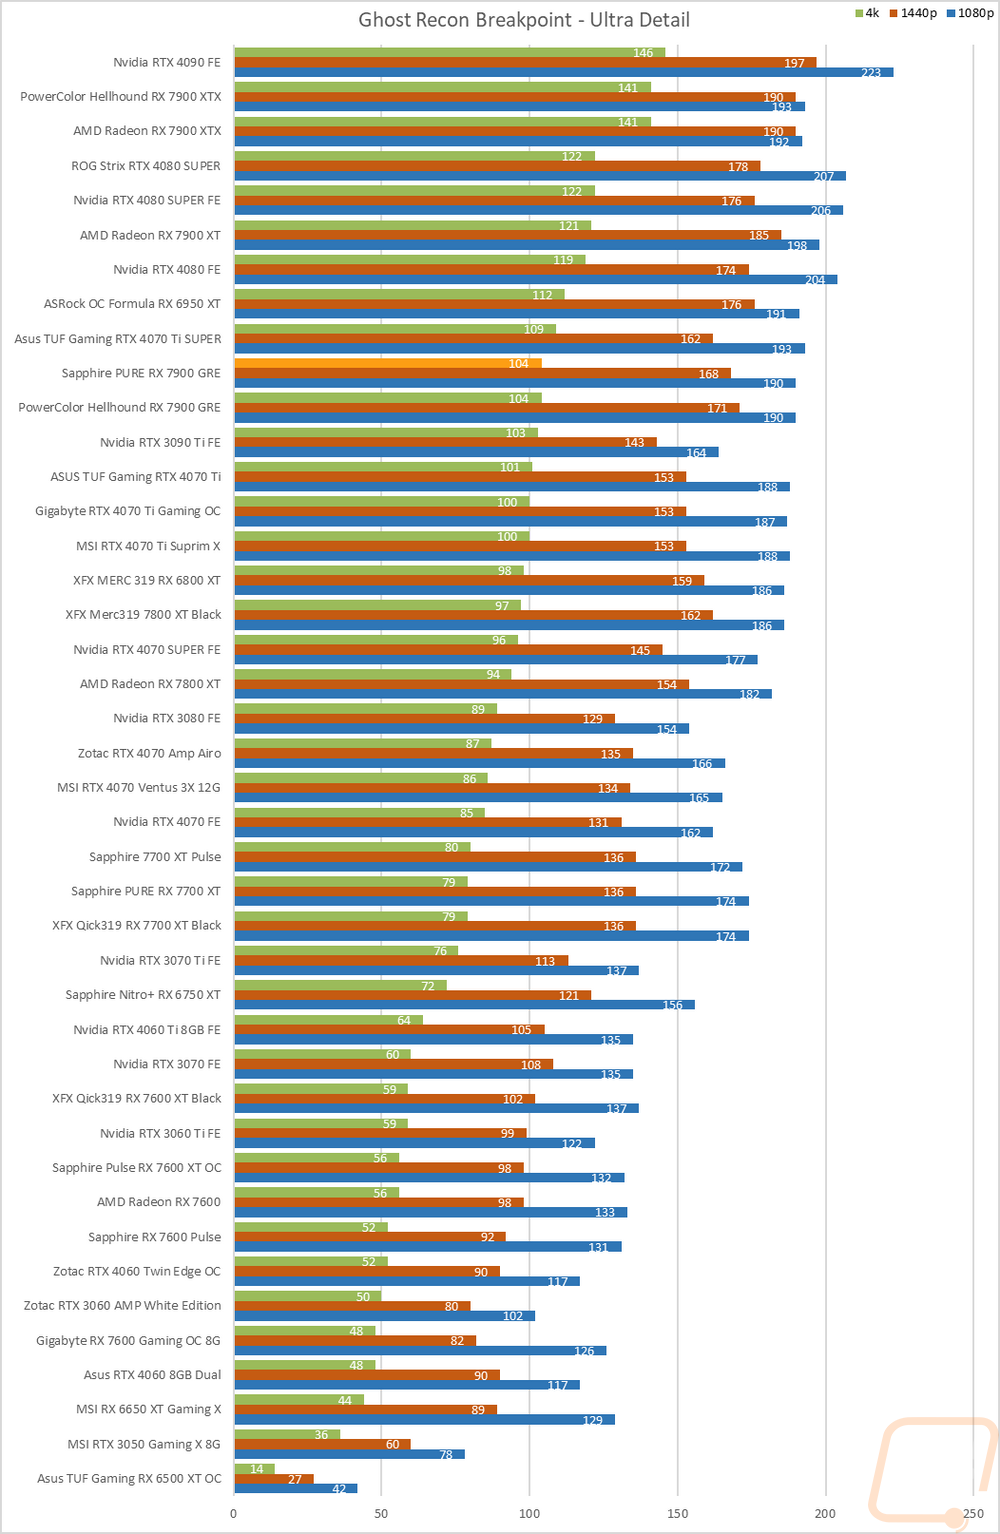
Ghost Recon Breakpoint |
Built-in benchmark tested at 1080p, 1440p, and 4k with the Ultra and Medium detail settings. Texture quality always set to high |
|
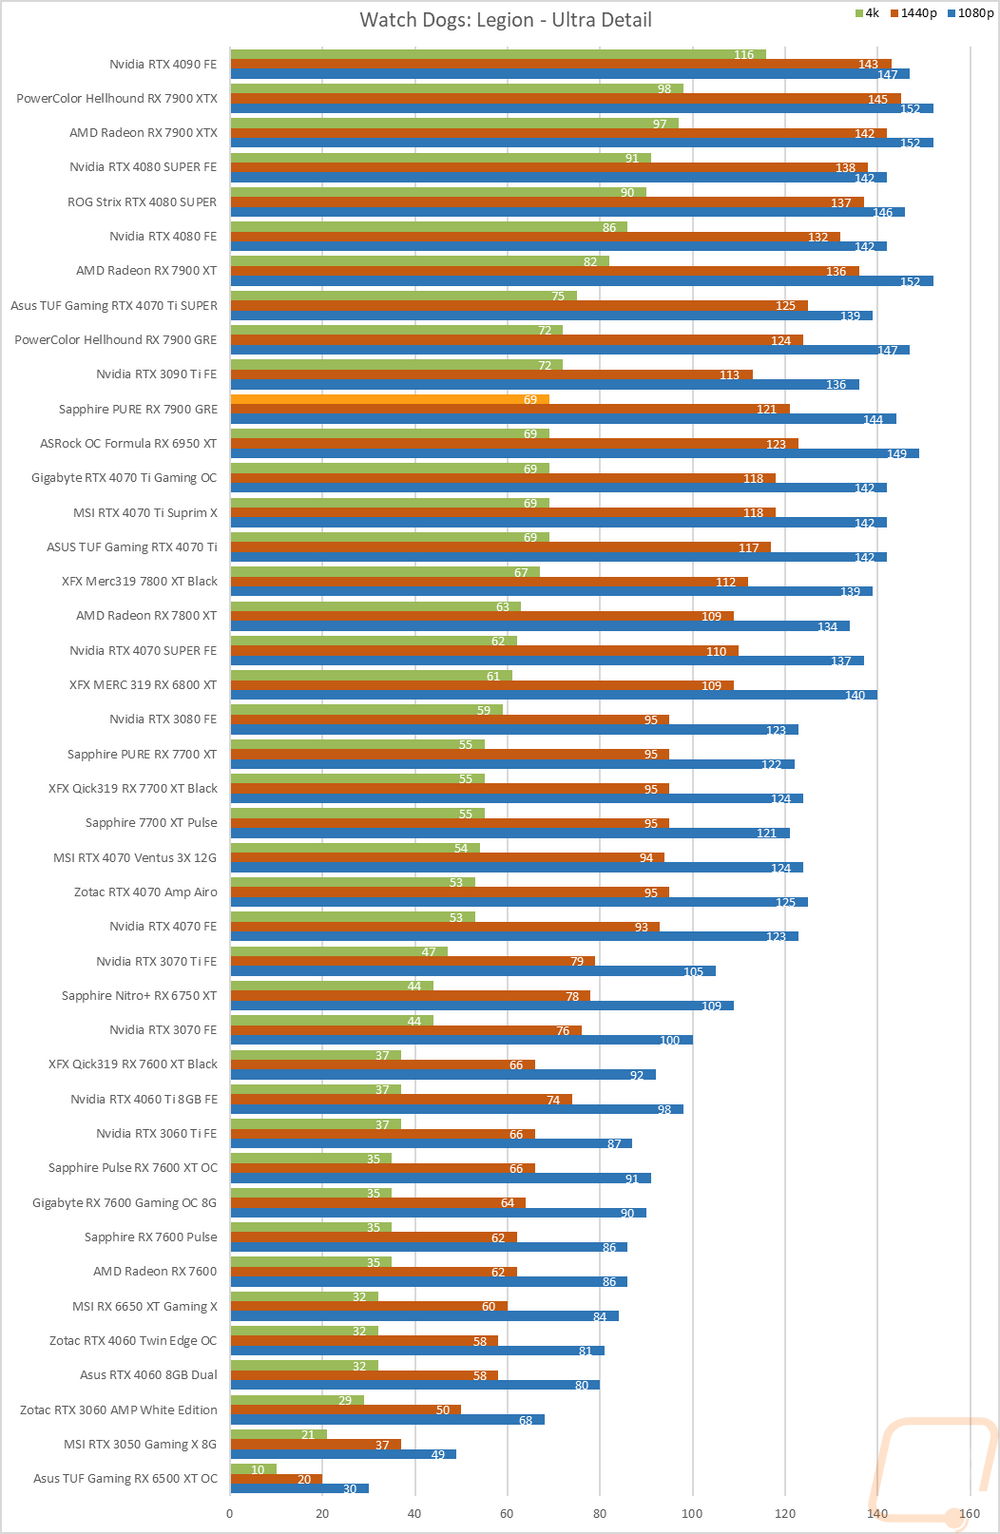
Watch Dogs: Legion |
Built-in benchmark testing at ultra and high details. Tested at 1080p, 1440p, and 4k. I also do RTX and DLSS testing on Nvidia cards at 4K using the Ultra detail settings as a base as well. |
|
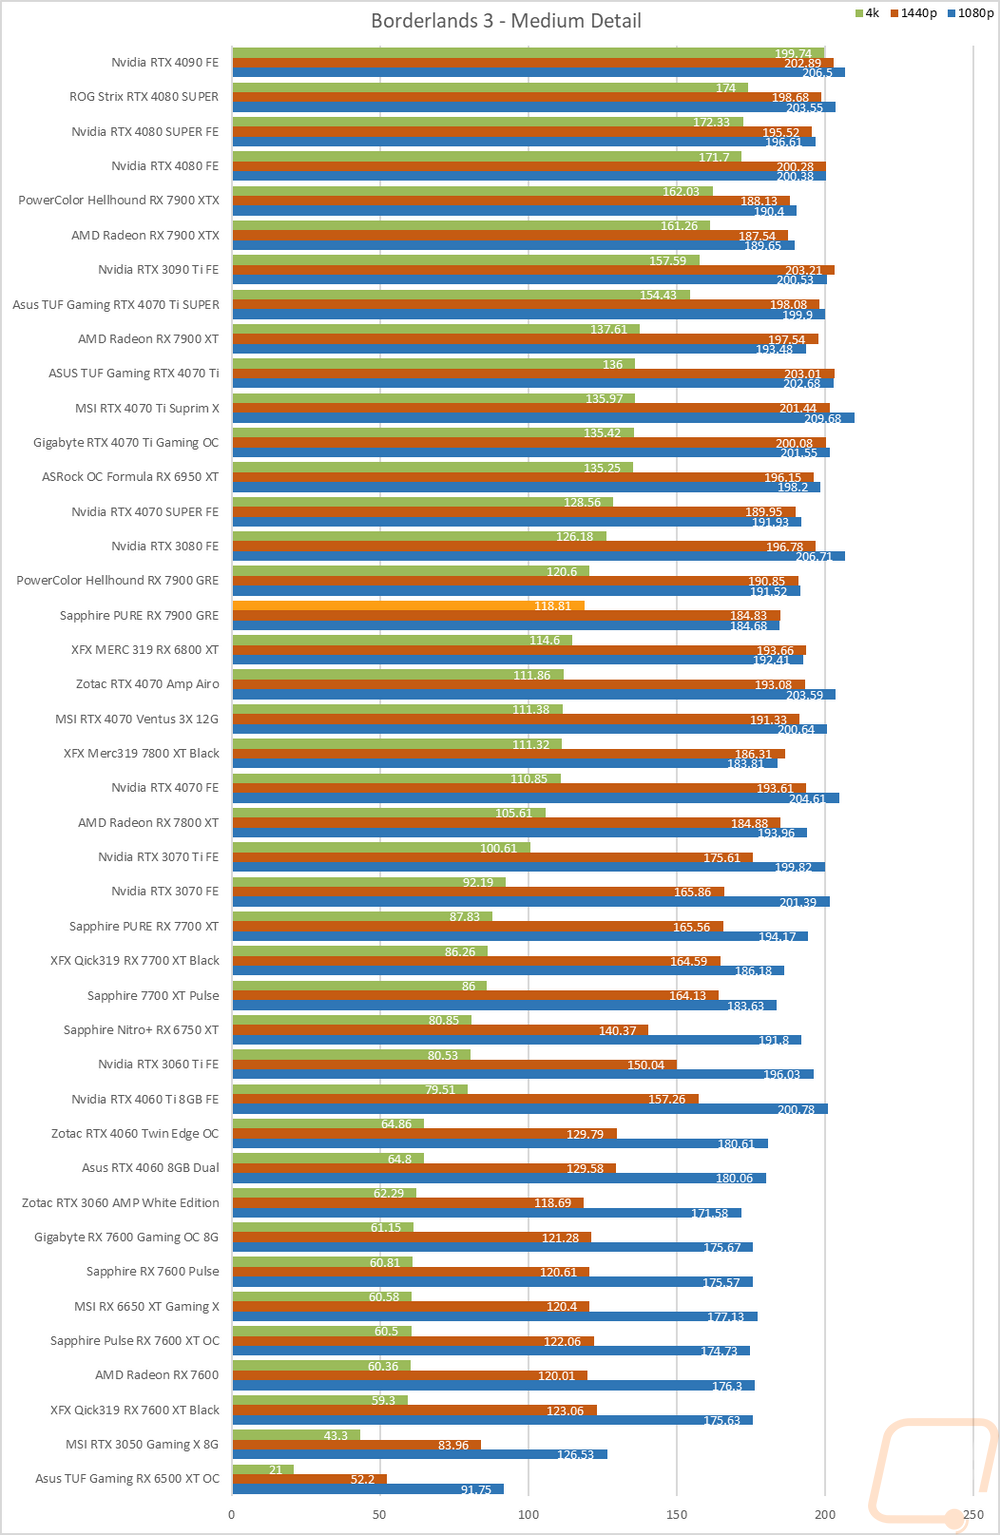
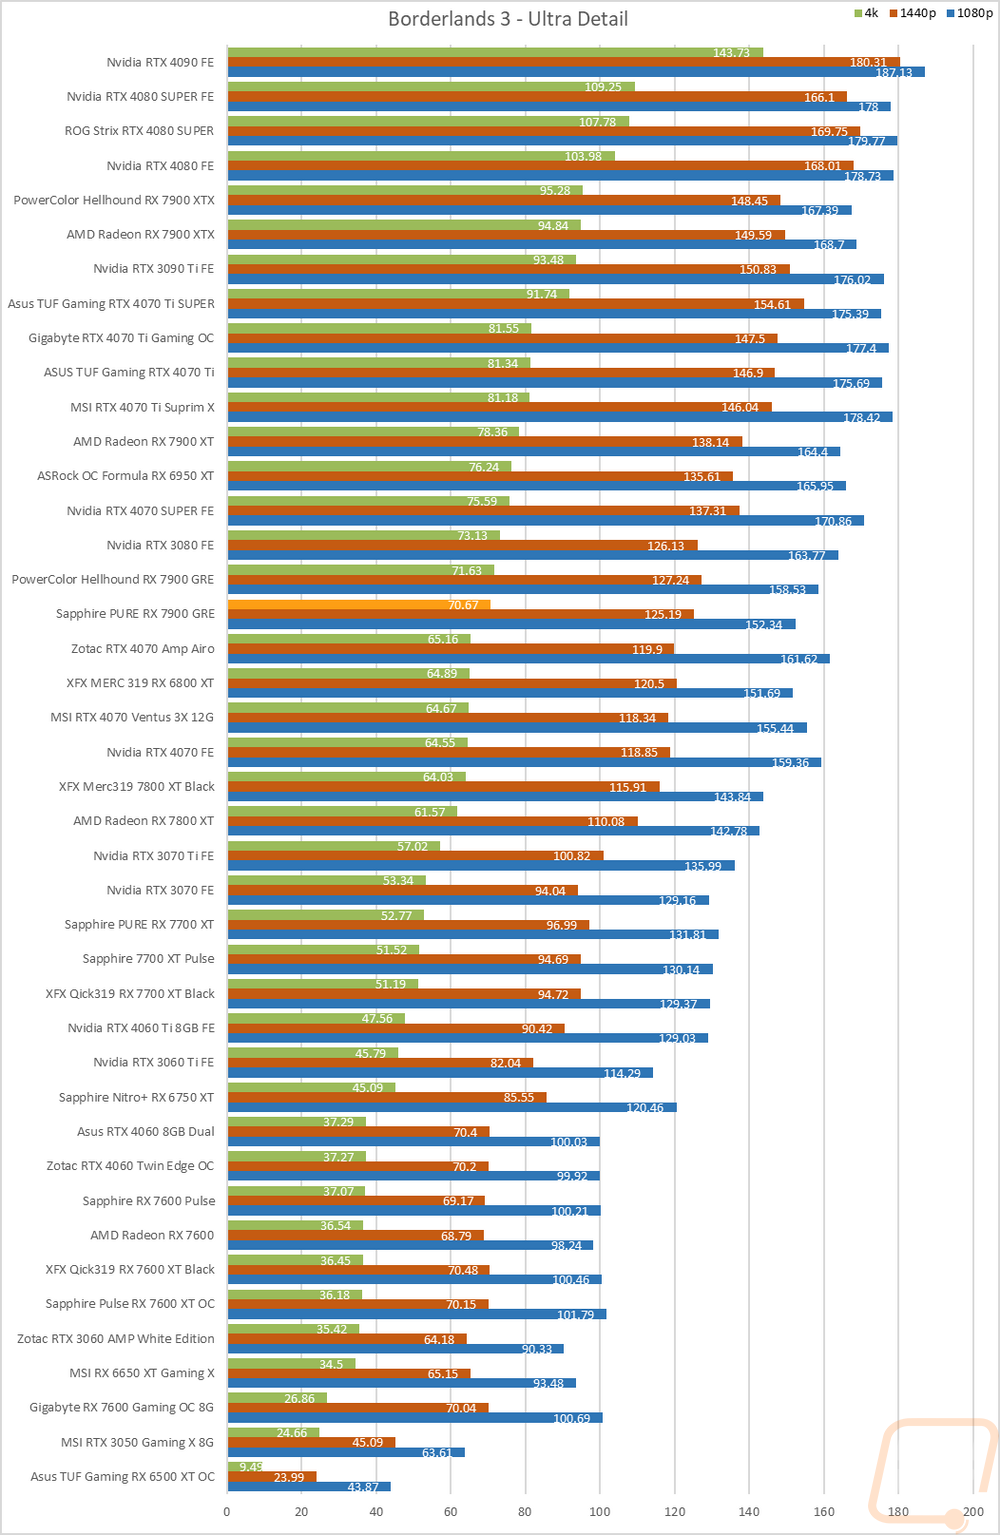
Borderlands 3 |
Built-in benchmark testing with the ultra detail setting and medium detail setting, done at full screen with default settings at 1080p, 1440p, and 4k on DX11 |
|
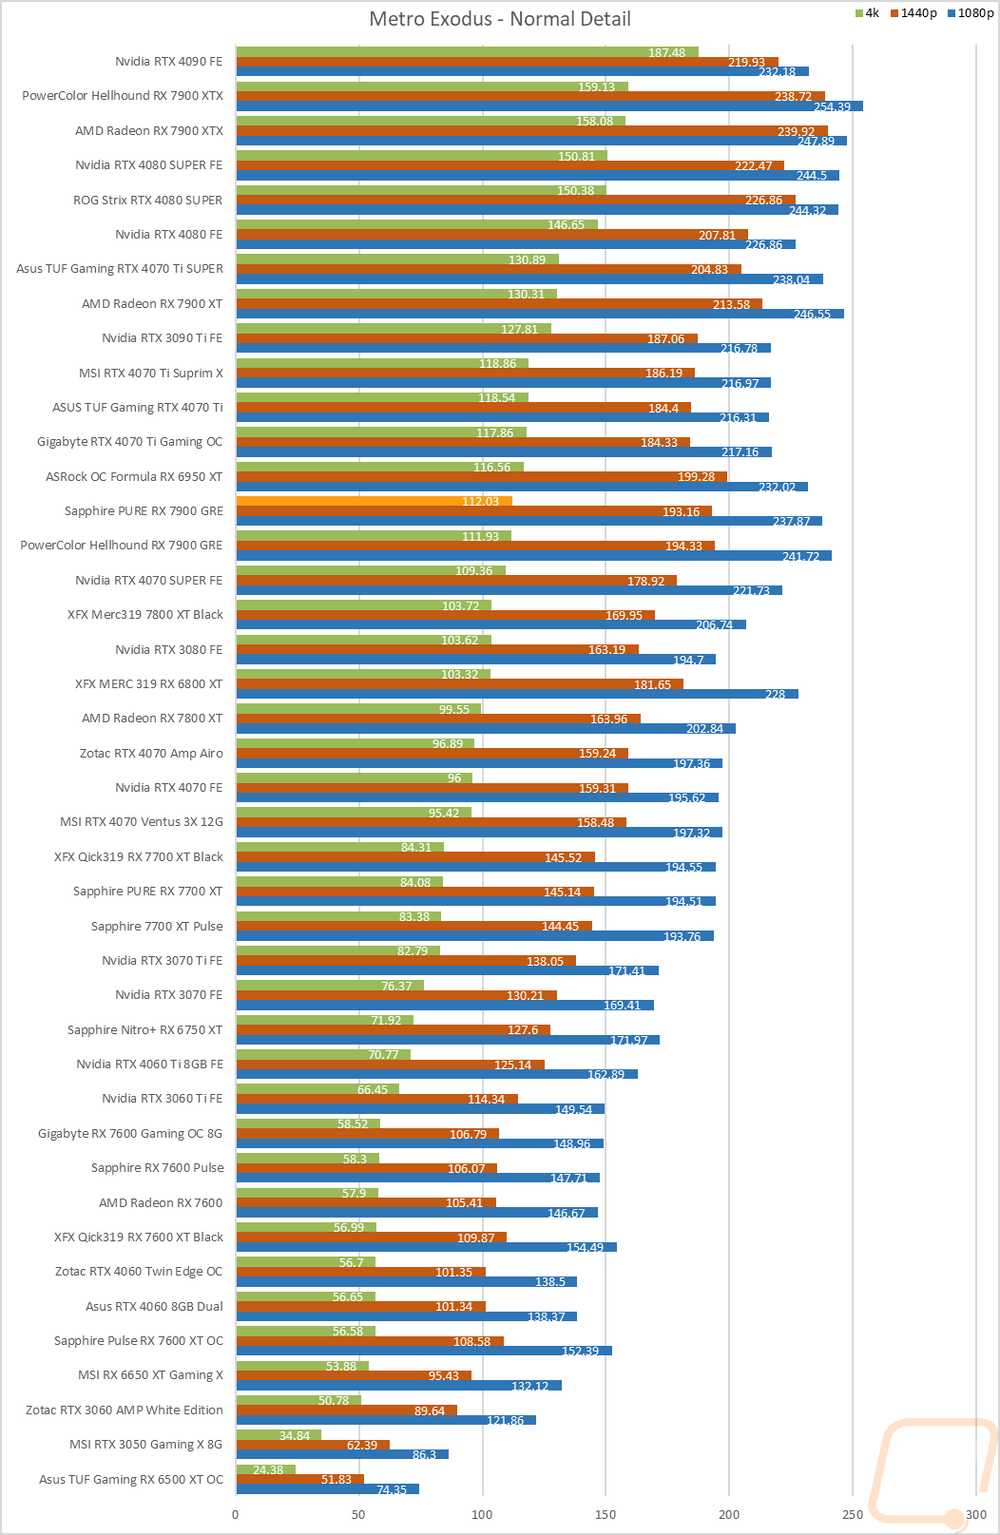
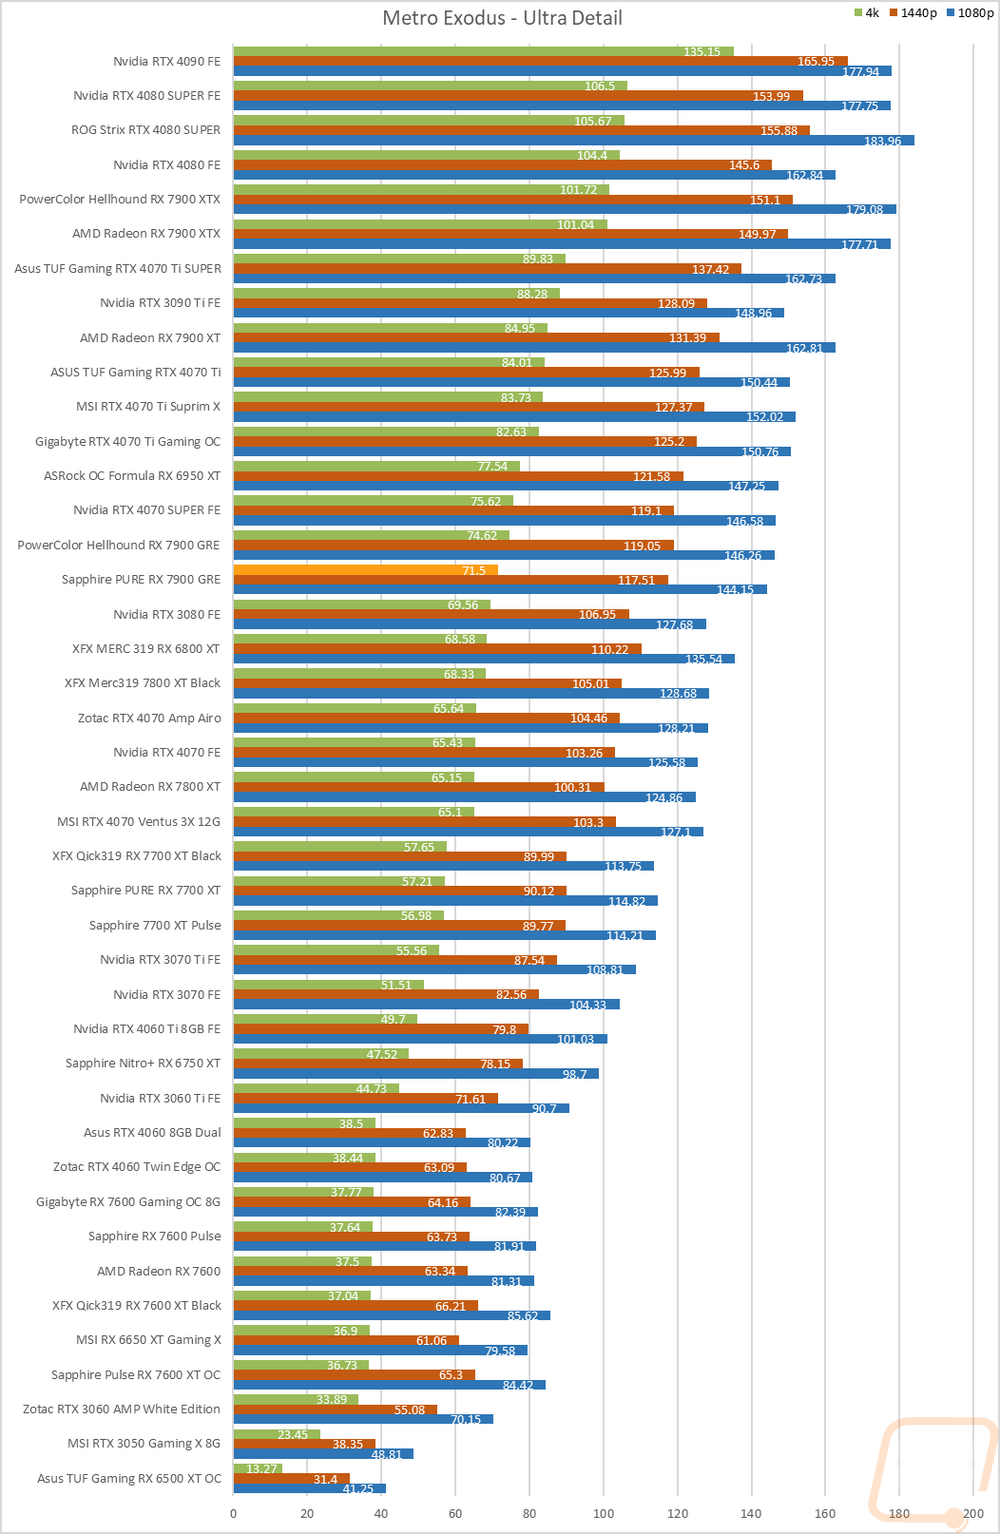
Metro Exodus |
Using built-in benchmark, testing at ultra and normal details at 1080p, 1440p, and 4k. I also do RTX and DLSS testing at 4K with the ultra-detail base settings for Nvidia cards as well. |
|
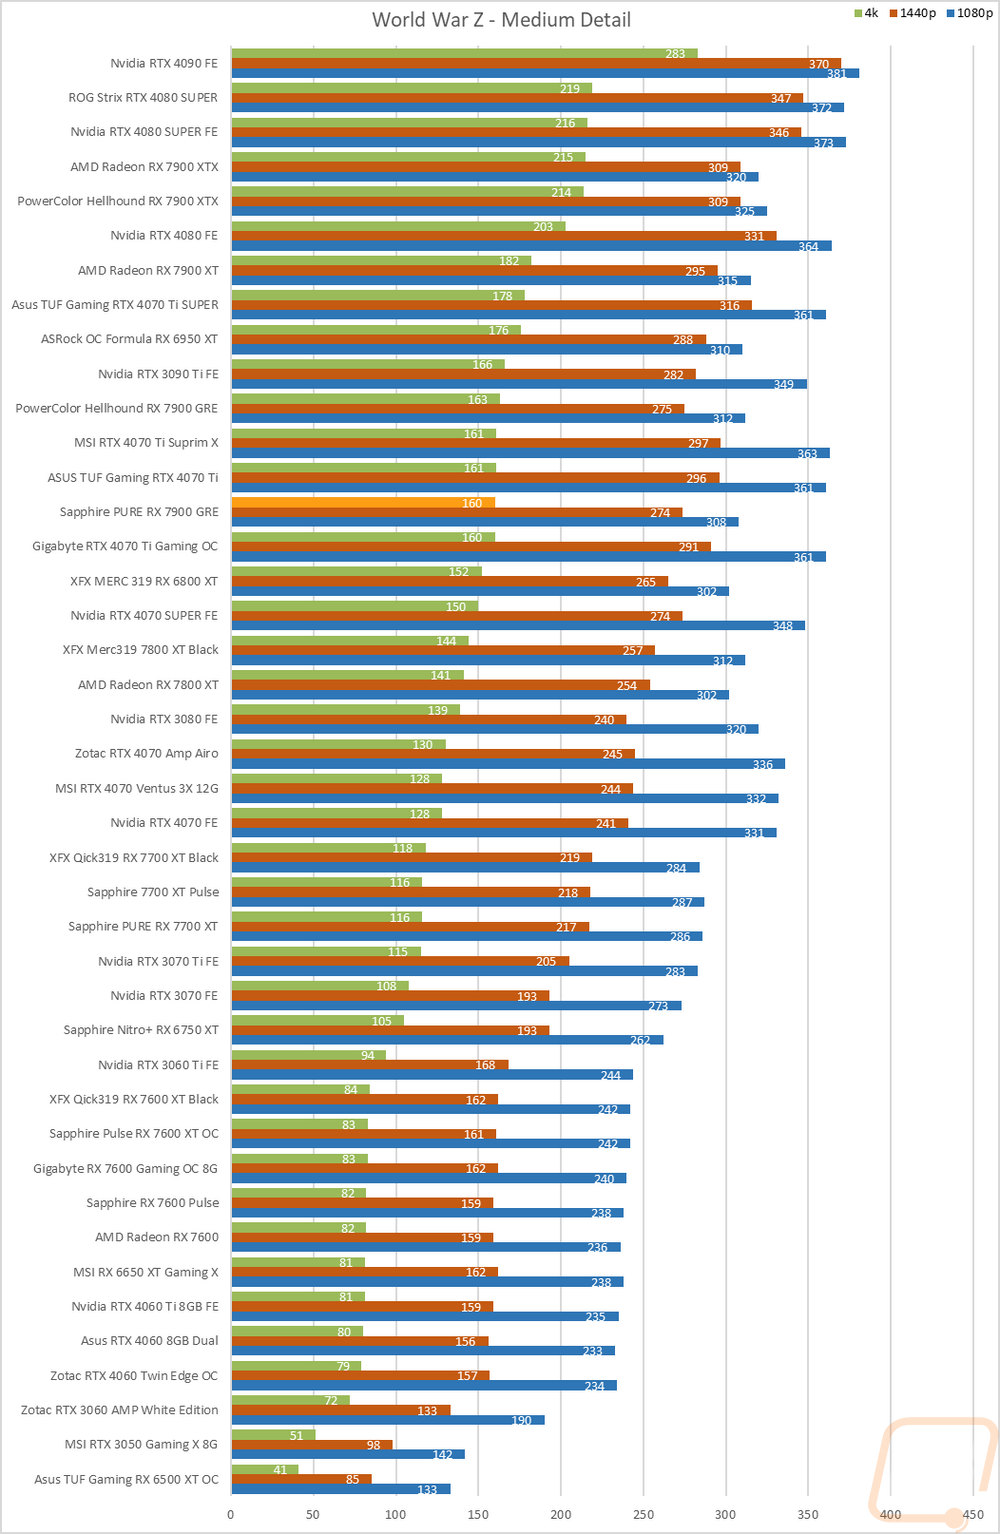
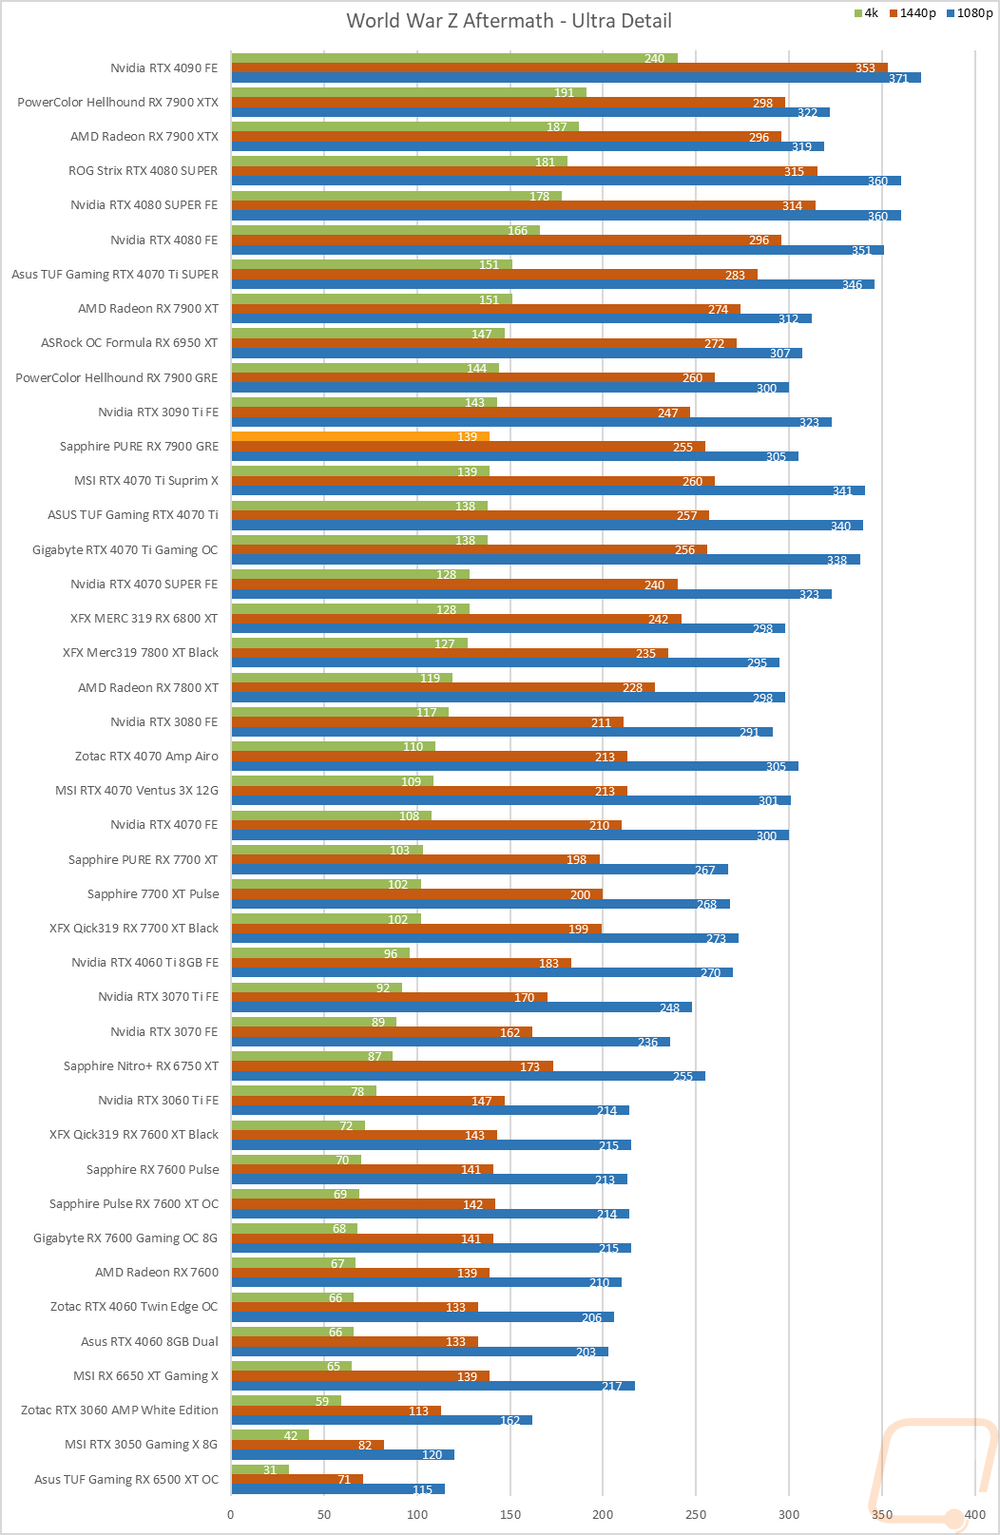
World War Z Aftermath |
Built-in benchmark in DX11 testing both the Ultra detail and Medium detail levels at 1080p, 1440p, and 4K resolutions |
|
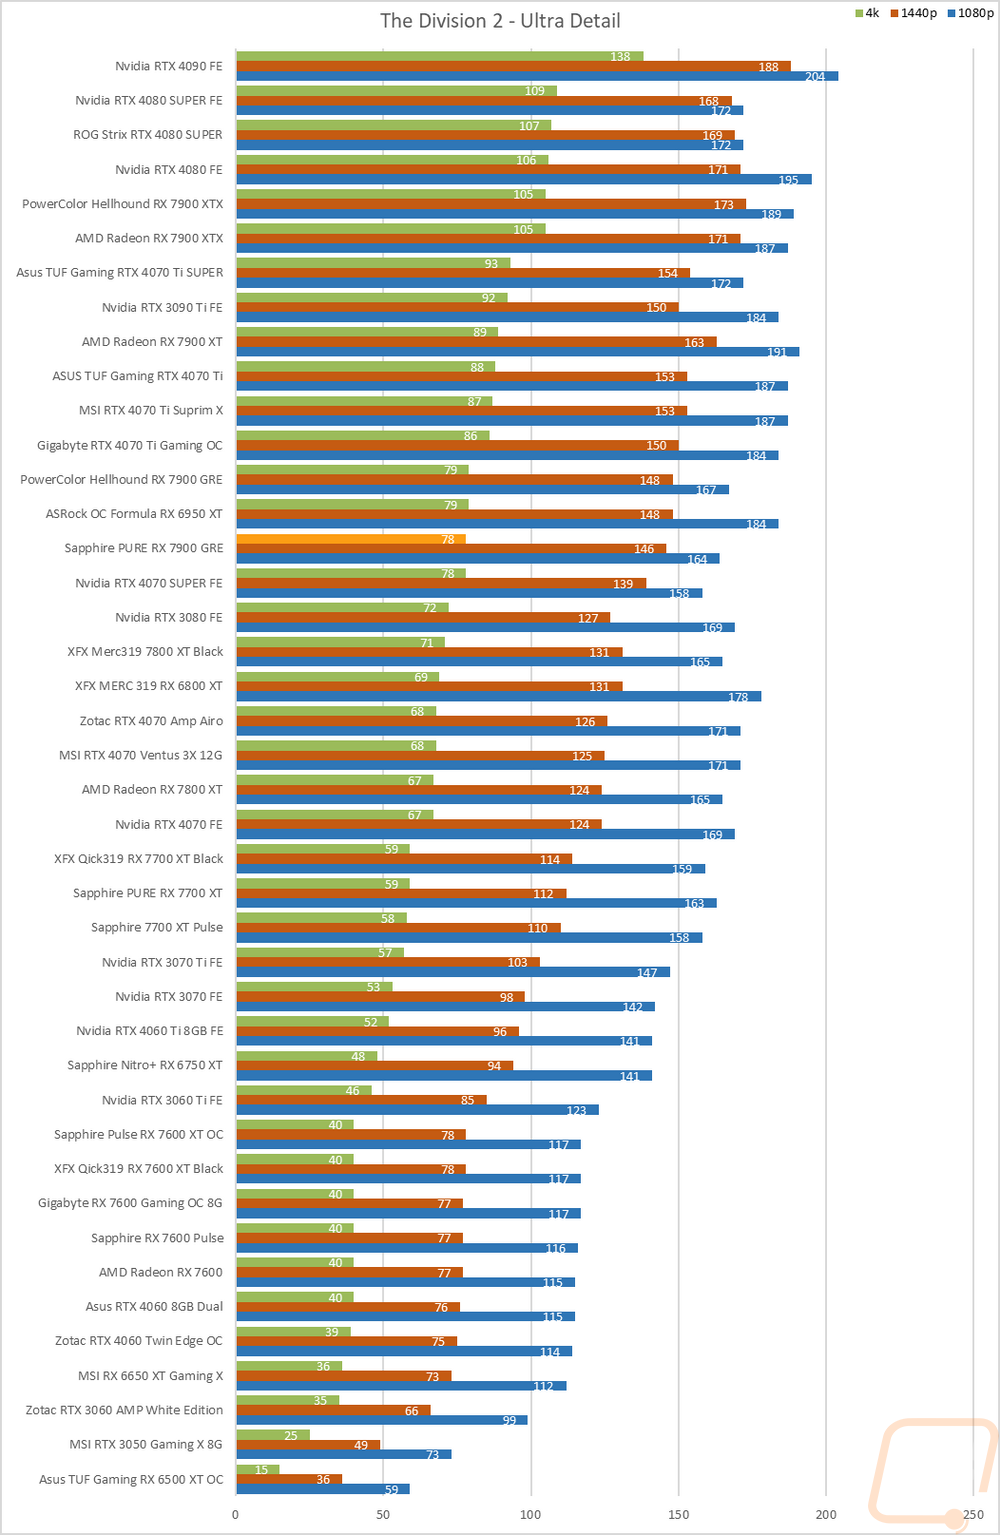
The Division 2 |
Built-in benchmark at Ultra detail with V-Sync turned off at 1080p, 1440p, and 4k resolutions. |
|
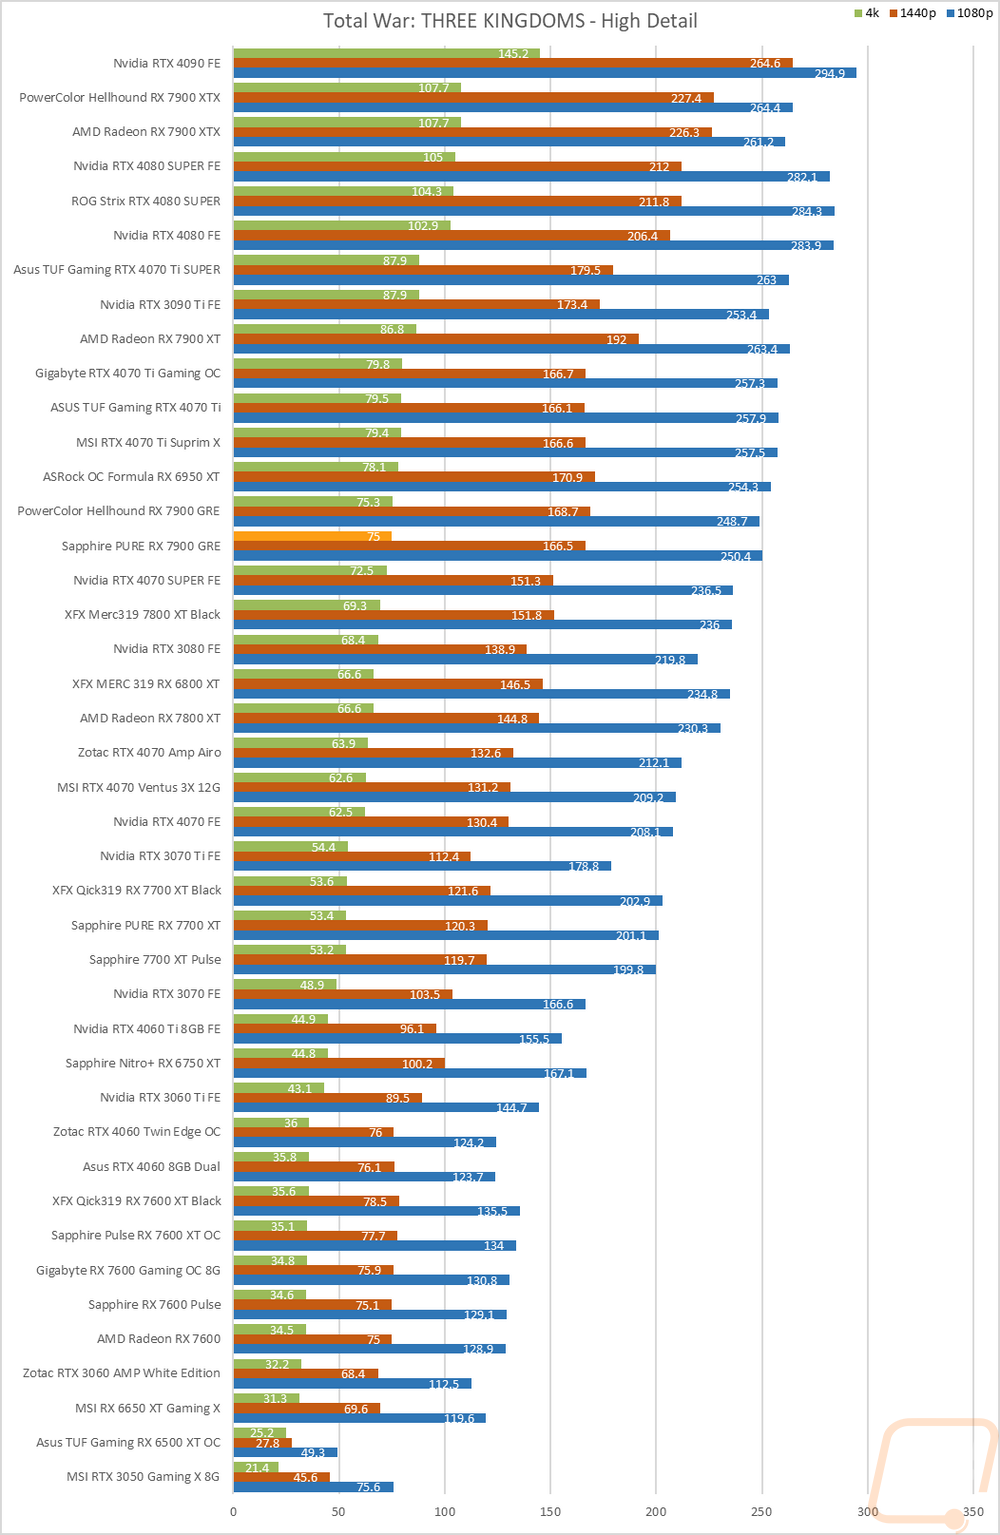
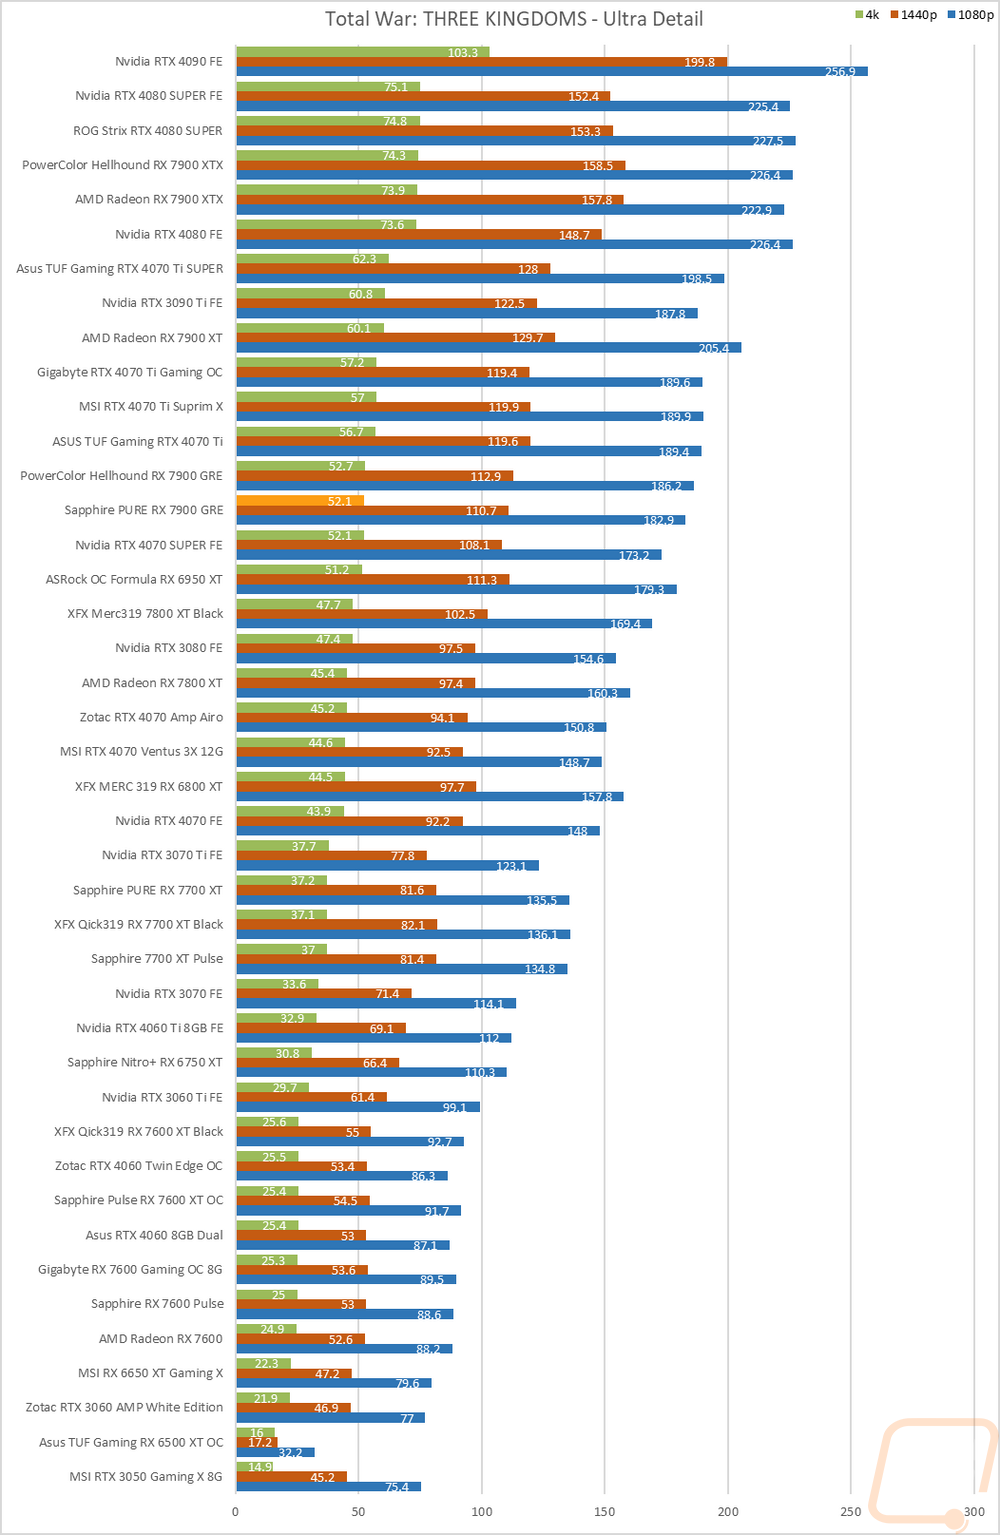
Total War: Three Kingdoms |
Built-in benchmark using the Battle Benchmark setting. Tested at 1080p, 1440p, and 4k at both high and ultra detail settings |
|
OctaneBench 2020.1 |
OctaneBench is designed to test rendering in OctaneRender. RTX and non-RTX are both ran. This is a CUDA-only test so only Nvidia cards are tested |
|
V-Ray 5 |
V-Ray 5 benchmark us run with CUDA and RTX settings on cards that support it |
|
Boundary Benchmark |
Testing different DLSS detail levels on cards that support it. All testing is done at 4k with RTX on |
|
Bright Memory Infinite RTX Benchmark |
Benchmark all of the different RTX detail levels. Resolution at 4k and DLSS on balanced for each test |
|
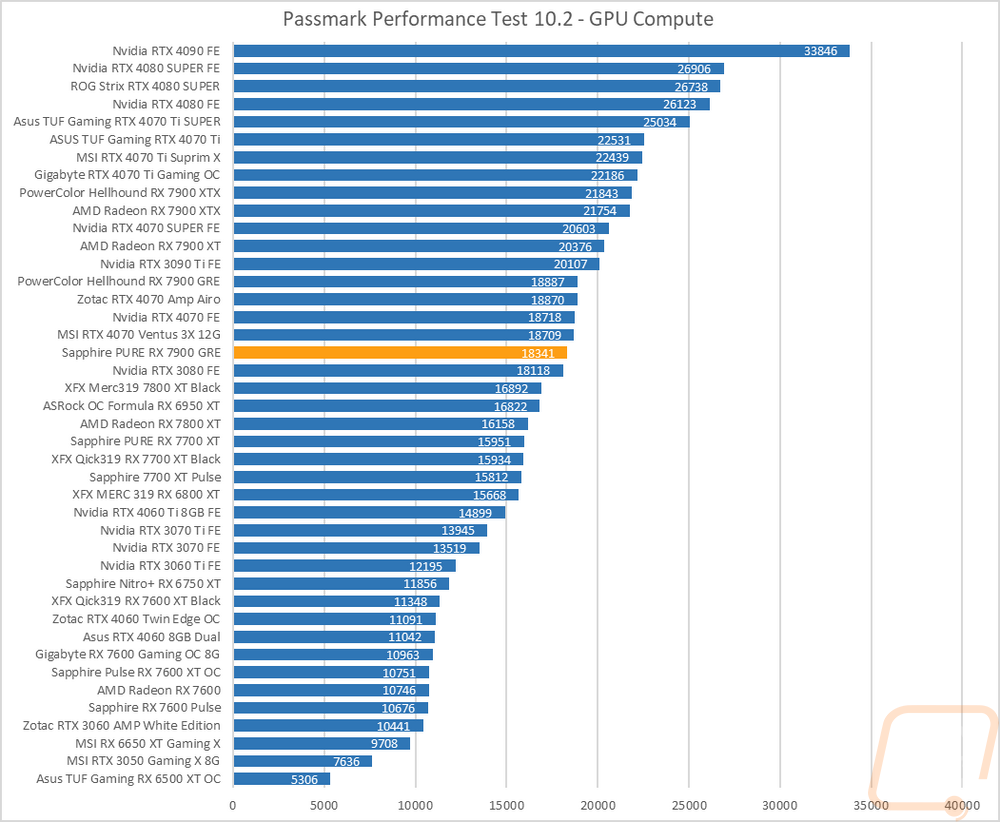
Passmark Performance Test 10.2 |
Test using the GPU Compute Score inside of PassMark's Performance Test 10.2 |
|
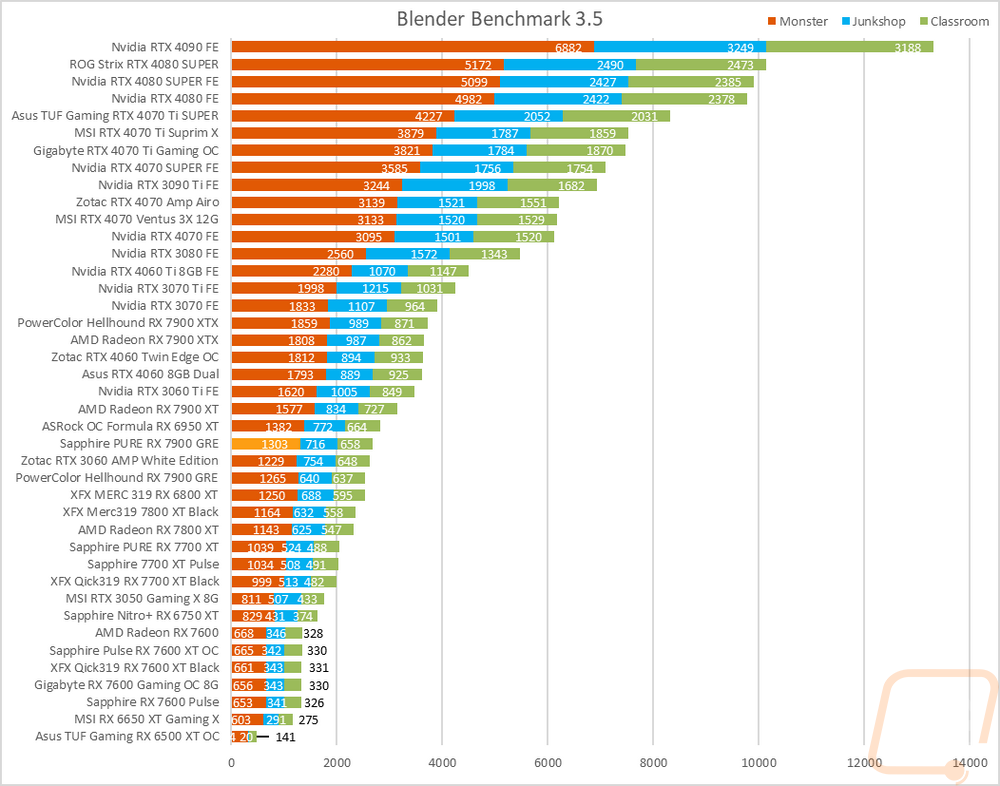
Blender |
Using the standard Blender Benchmark I run the test using the Blender 3.4 setting which tests using the Monster, Junkshop, and Classroom tests. |
|
Temperature Testing |
Using AIDA64, the GPU stress test is run for 30 minutes or until the result has leveled off. The test is run twice, once with the stock fan profile and a second time with 100% fan speed. During this, I also document the 100% fan speed RPM and document the delta between the fan profile and 100% fan speed as well as get thermal images. |
|
Power Testing |
Using a PCat v2 to monitor power between the PCIe slot and the card as well as power through the power cables I test the peak power when running ADIA64, 3DMark Speed Way, 3DMark Time Spy Extreme, FarCry 6 at 4k and Ultra Detail, Watch Dogs Legion at 4K and Ultra detail, and Blender 3.4.0. The results are then averaged as well as the highest result. |
|
Noise Testing |
Our Noise testing is done using a decibel meter 18 inches away from the video card on the bottom/fan side of the card. We test at 50% and 100% fan speeds as well as a third test while under load using AIDA64's stress test. This is done using a Protmex PT02 Sound Meter that is rated IEC651 type 2 and ANSI S1.4 type 2. Tests are done set weighted to A and set to a slow response using the max function. The ambient noise level in the testing area is 33.3 decibels. |
Synthetic Benchmarks
As always I like to start my testing with a few synthetic benchmarks. 3DMark especially is one of my favorites because it is very optimized in both Nvidia and AMD drivers. It's nice to not have to worry about it being favored too much either way and the repeatability of the results makes it a nice chance to compare from card to card, especially when comparing with the same GPU. For the PURE RX 7900 GRE, we have already taken a look at one RX 7900 GRE so I will be keeping an eye on how those compare, the PURE RX 7900 GRE does have a lower clock speed on base and boost clocks so with that in mind I wouldn’t expect it outperform the Hellhound but we will see. Beyond that, I want to keep an eye on how the PURE RX 7900 GRE compares to Nvidia’s RTX 4070 SUPER and the RTX 4070 Ti / Ti SUPER.
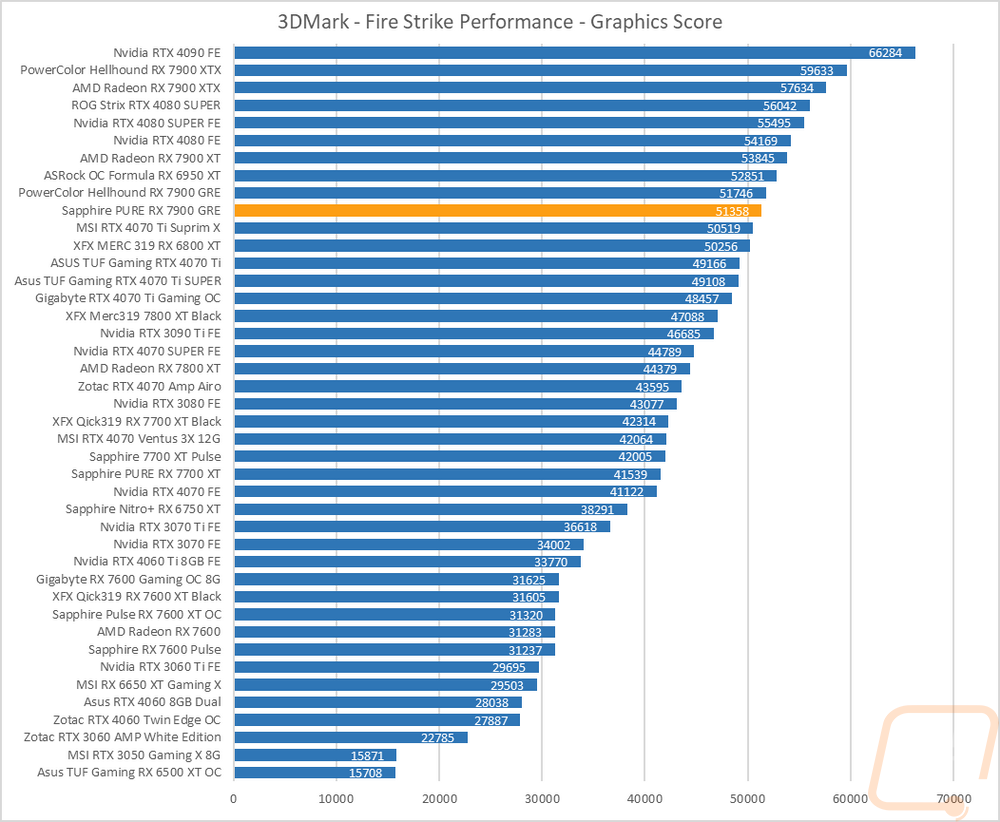
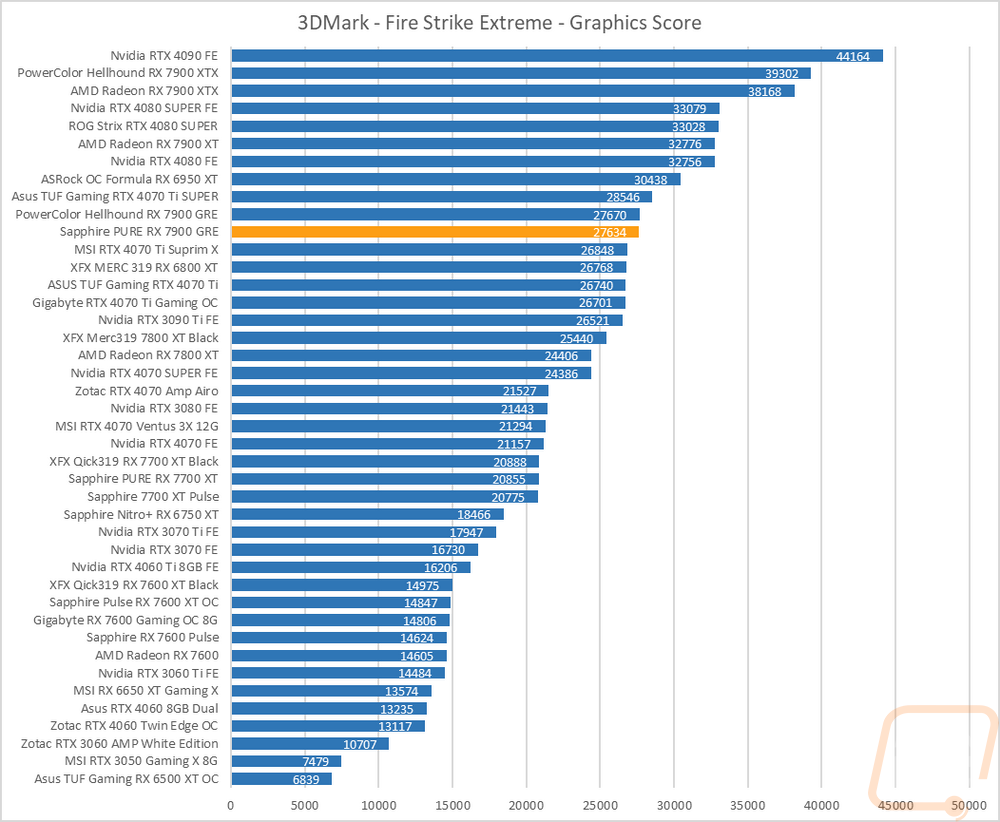
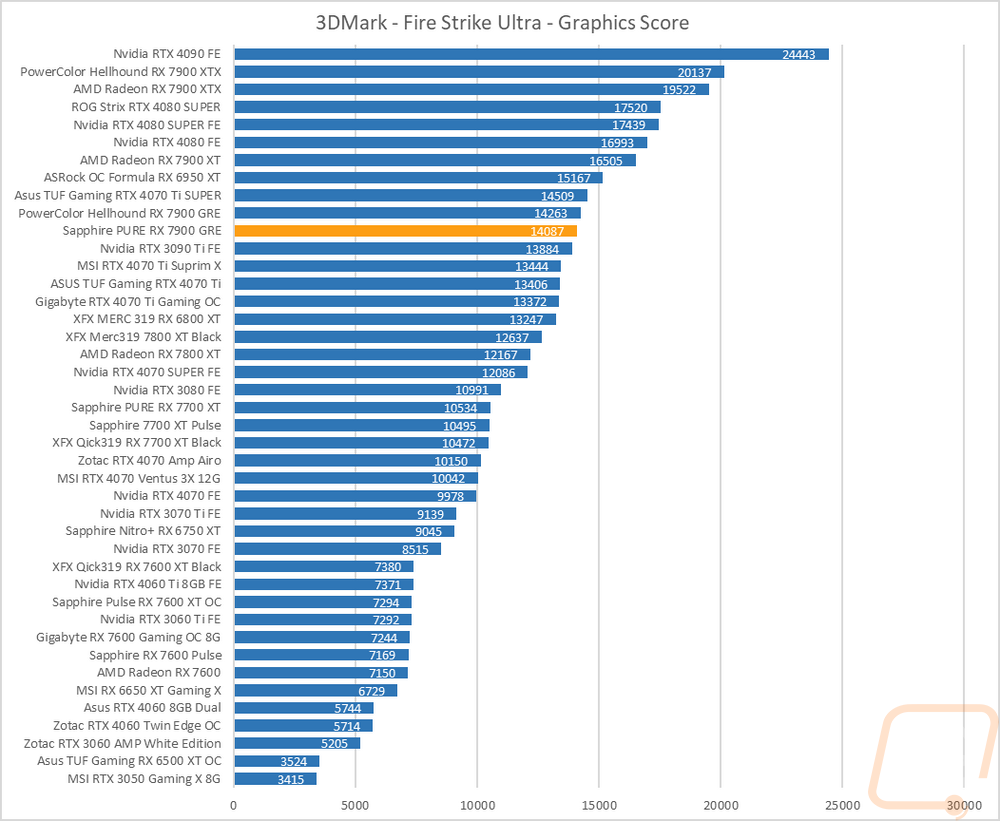
The first round of tests were done in the older Fire Strike benchmark which is a DX11 test. There are three detail levels, performance, extreme, and ultra. The PURE RX 7900 GRE scored a 51358 in base Fire Strike which was down from the 51746 of the Hellhound 7900 GRE. The two cards are much closer together on the Fire Strike Extreme test with both sitting behind the 4070 Ti SUPER and ahead of the older RTX 4070 Ti. The same goes for the Fire Strike Ultra test. The Hellhound is still out ahead of the PURE RX 7900 GRE but both cards are sitting behind the RTX 4070 Ti SUPER here and in front of the 4070 Ti as well as the 3090 Ti.
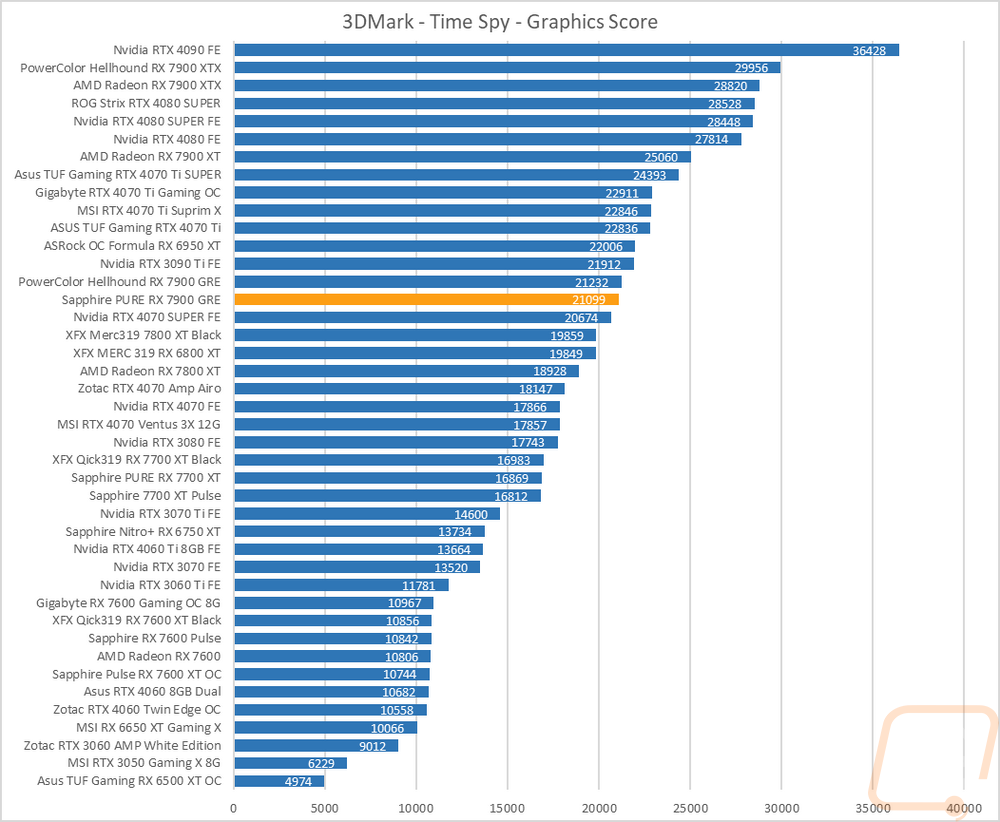
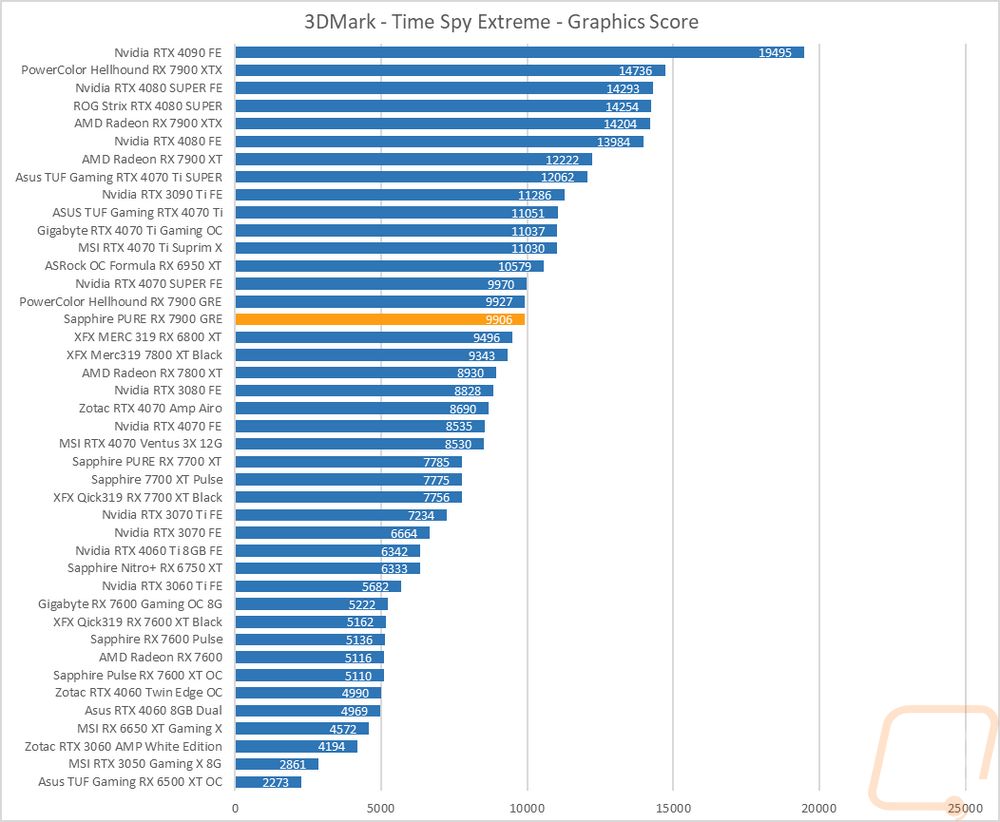
The next two were both based on the Time Spy benchmark. One is the standard test and then there is the extreme detail level. For Time Spy the PURE RX 7900 GRE scored a 21099 and is sitting just behind the Hellhound 7900 GRE which has a larger overclock. Both cards have a gap between them and the RTX 4070 SUPER and are then behind the 3090 Ti, 6950 XT, and the 4070 Ti. In Time Spy the RTX 4070 SUPER gains more of an edge and is just in front of both cards.
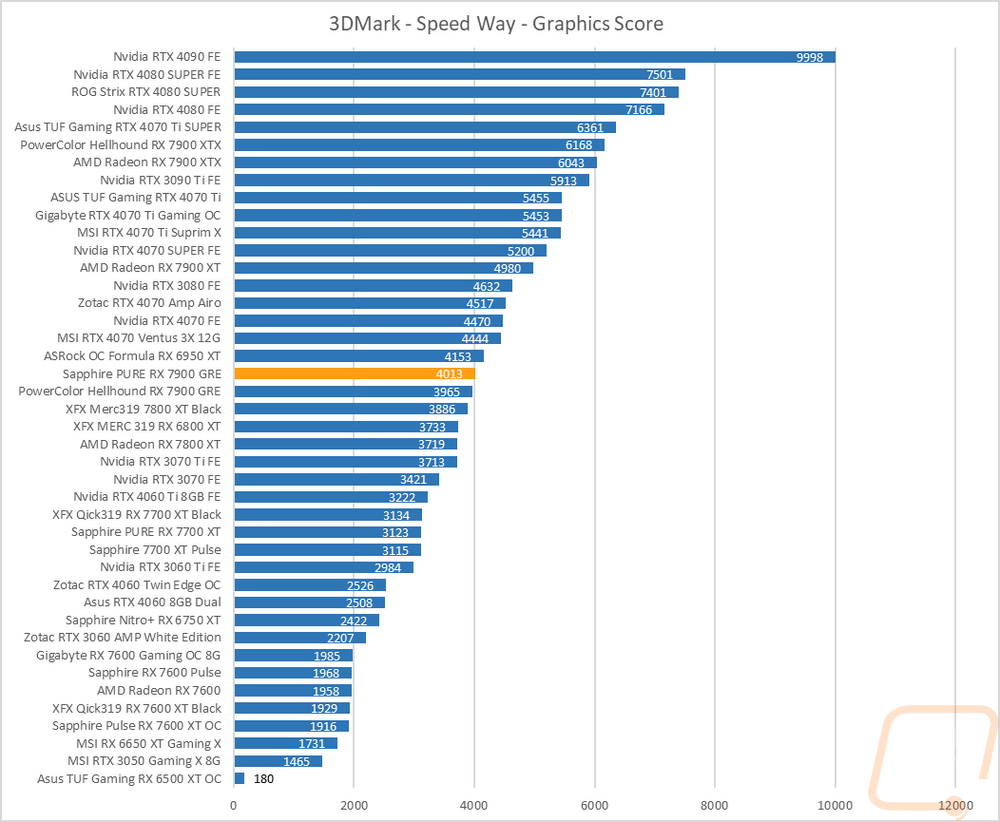
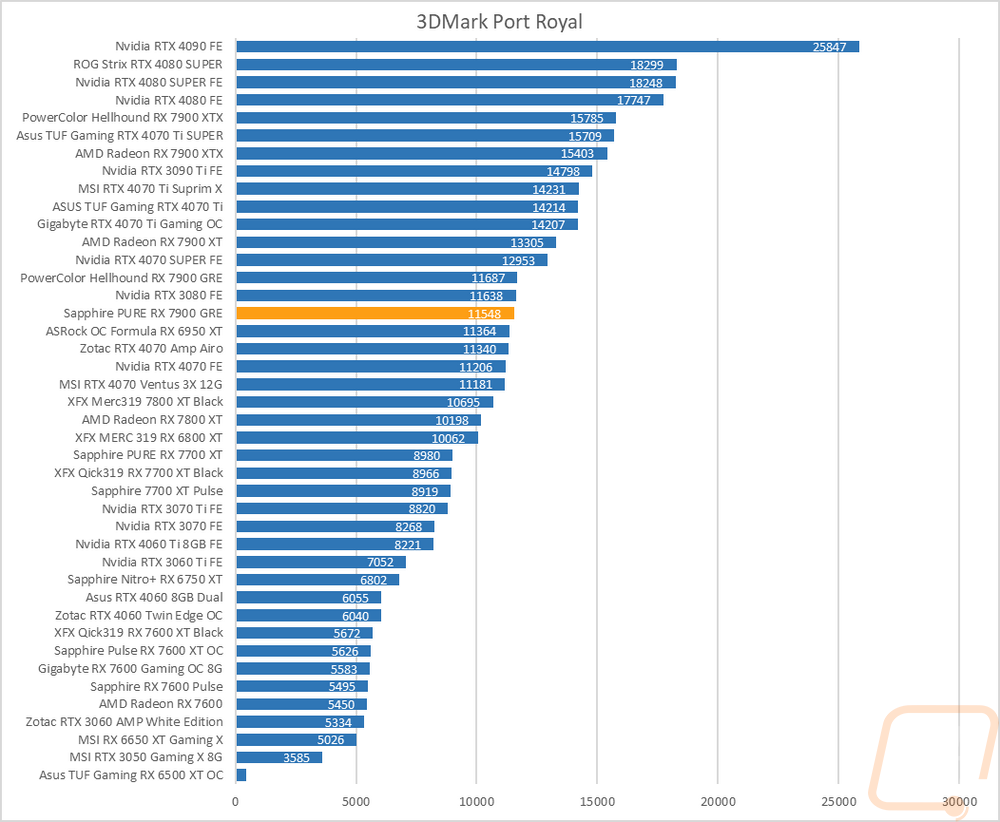
For ray tracing performance, I ran both the 3DMark Port Royal test which is ray tracing focused as well as the new 3DMark Speed Way test which tests all future-looking features including ray tracing. In Speed Way, the PURE RX 7900 GRE scored a 4013 and edged out in front of the Hellhound which was a surprise. Both card are still close together and sitting surprisingly close to the 7800 XT results and when we bring Nvidia into the mix they are behind the RTX 4070, let alone the 4070 SUPER. In Port Royal, the PURE RX 7900 GRE is behind the Hellhound and that was enough of a gap to drop down below the RTX 3080.
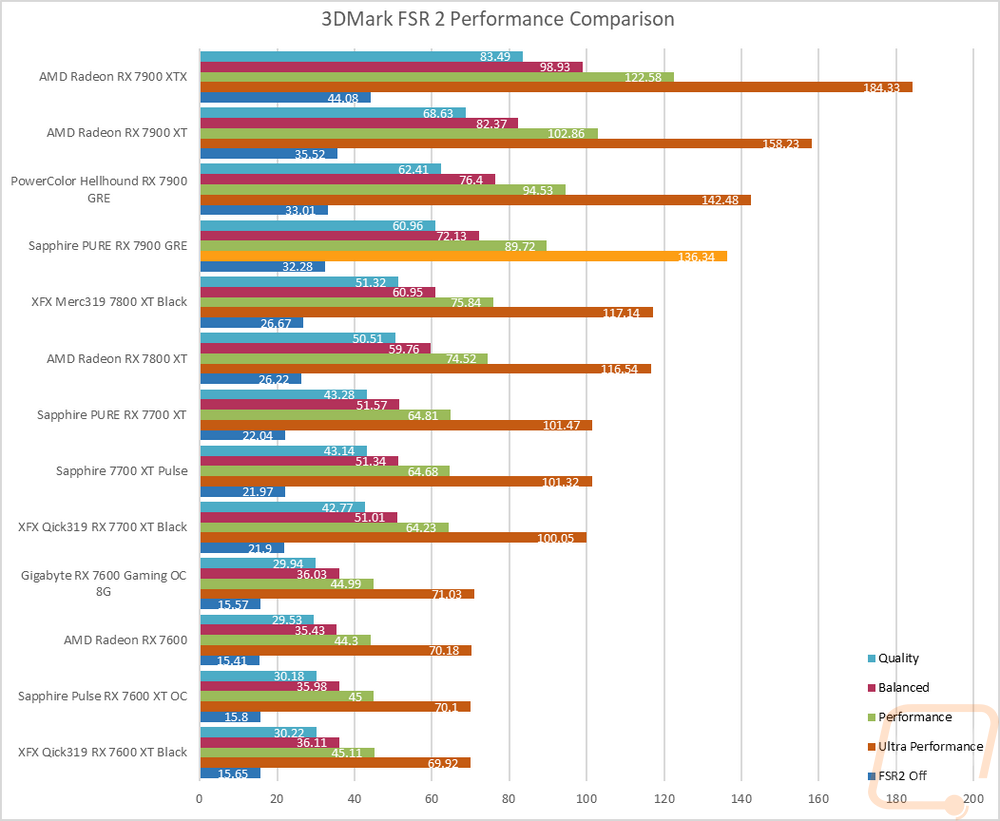
While testing in 3DMark I did also run the FSR2 benchmarks to get a look at how the PURE RX 7900 GRE performed with and without FSR2 and across different detail levels showing the best case scenario for performance improvement. The PURE RX 7900 GRE had a larger gap here than I expected when compared to the Hellhound but what I this test for was mostly to see the different improvements depending on detail settings. The PURE RX 7900 GRE ran at 32 FPS without FSR2 and jumped up to 51 FPS on the highest quality setting. Balanced and Performance jumped up to 60 and then 75 FPS. But Ultra Performance was the most impressive at 136 FPS, over 100 FPS higher than the original result without FSR2.
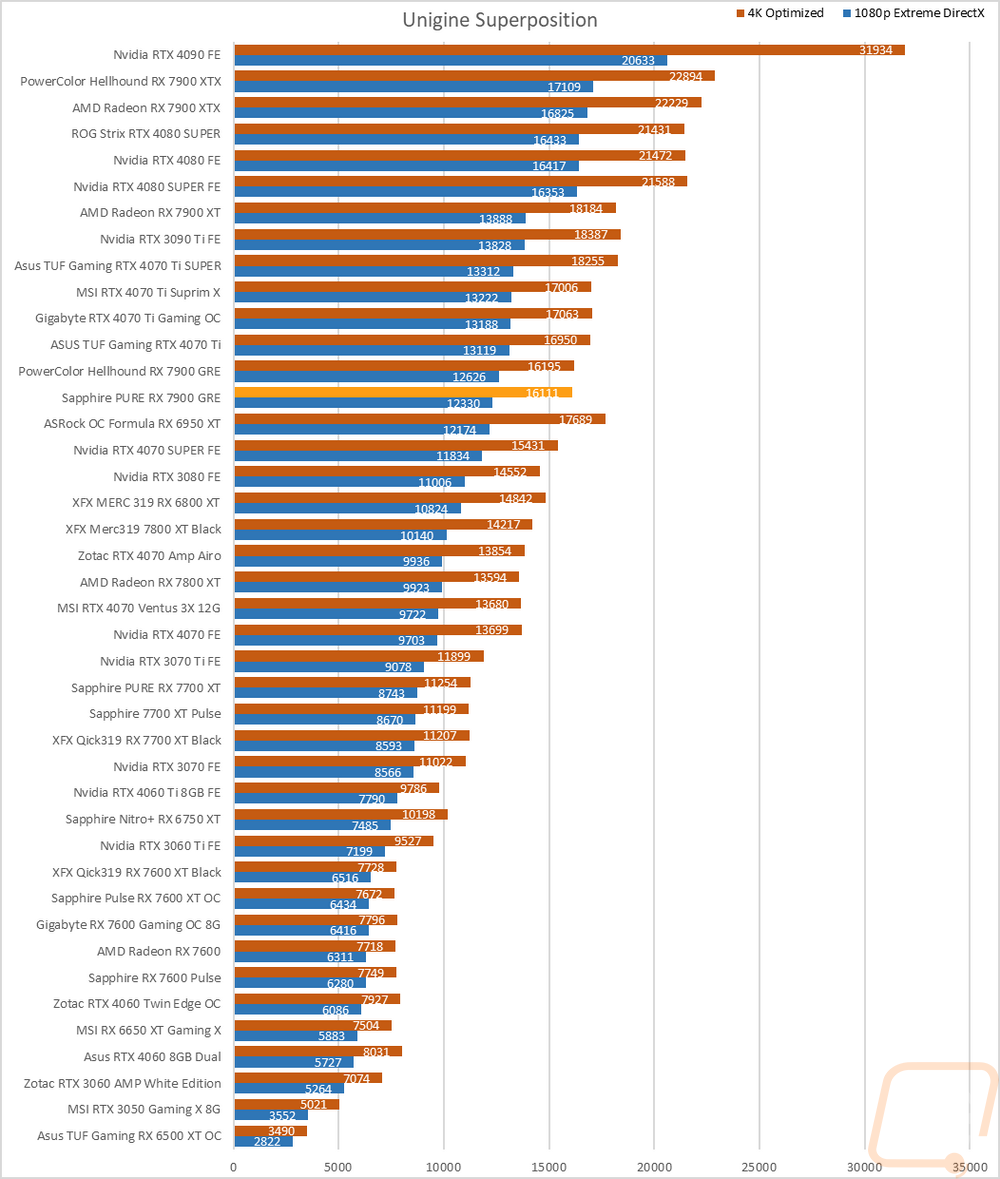
The last test was using the Unigine-based Superposition benchmark and I tested at 1080p with the extreme detail setting as well as the 4K optimized setting. In the extreme detail 1080p setting the PURE RX 7900 GRE scored a 12330 which was 296 points down from the Hellhound. Both cards are out ahead of the 4070 SUPER and the RX 6950 XT but behind the RTX 4070 Ti here. With the lower memory bus of the GRE, both cards are a little lower than the 6950 XT below them on the 4K test.
VR Benchmarks
As for Virtual Reality, I love it but it is more demanding than traditional gaming. This is partially because of the resolutions needed to render for two eyes and because they render more than what is immediately visible. But also because of post effects to get the proper “fisheye” effect for it to look proper in your eyes with the HMD. You also have to have much higher expectations for frame rates in VR, skipping frames or lower FPS can cause motion sickness in VR. Because of that, I ran a few tests.
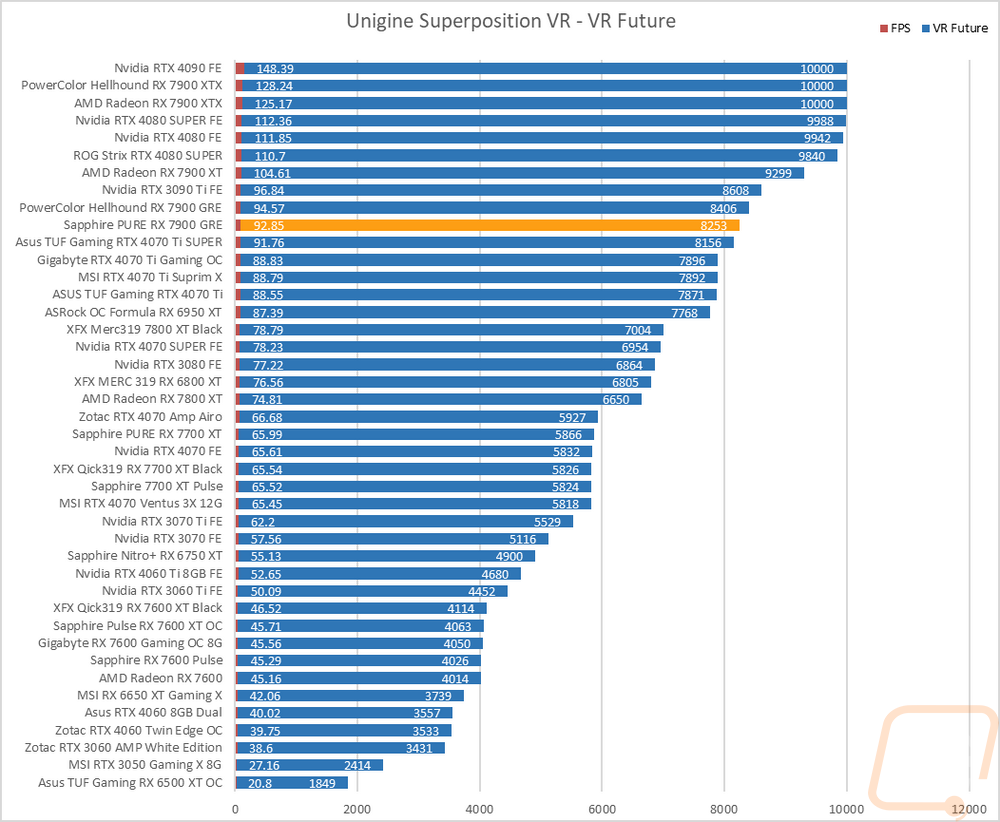
My first test was again in Superposition. This time I tested the VR Future test using the Oculus resolution. I have also included the average frame rate as well which is important for the cards at the top of the chart because for some reason Superposition is capped at 10,000 for its scores and that doesn’t show the performance gap in those cards at the top. The PURE RX 7900 GRE came in with a score of 8253, 153 points behind the Hellhound. It was however still up ahead of all of the original RTX 4070 Ti’s and 1249 points ahead of the RX 7800 XT.
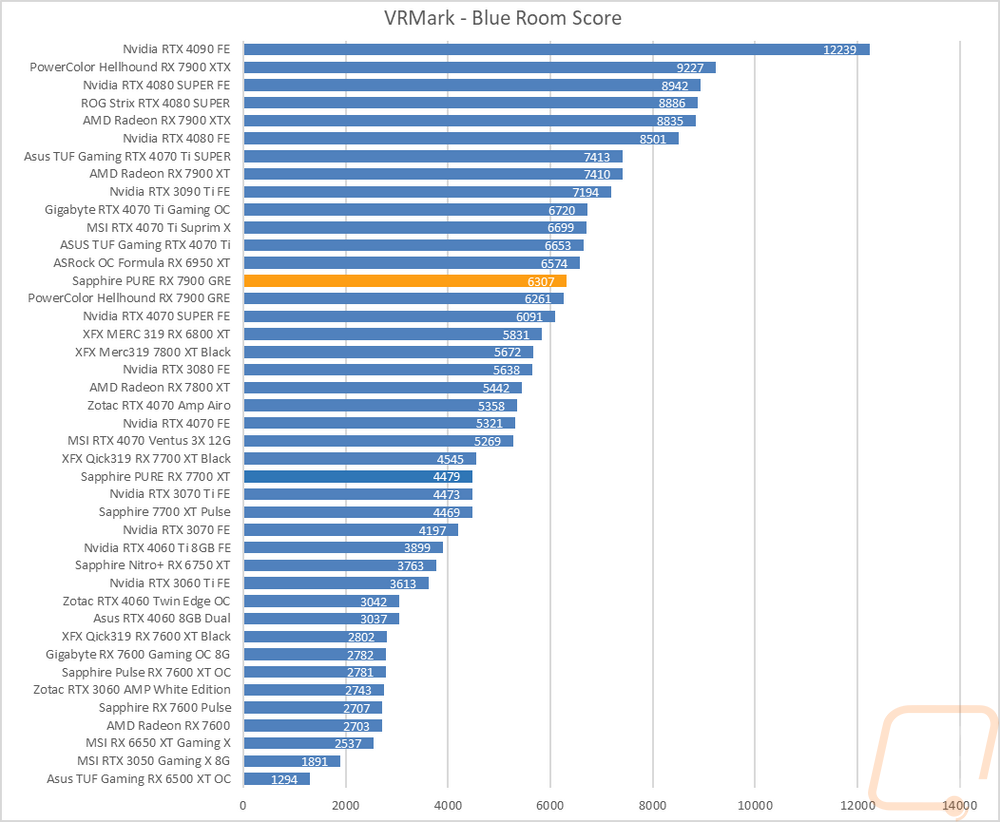
My second round of VR testing was in VRMark which has three tests that are similar to the VR tests in Superposition. I only focused on just the most demanding test called Blue Room which is looking more at future VR performance. The PURE RX 7900 GRE did better on this test, coming in ahead of the Hellhound. Both cards are below the 4070 Ti here and ahead of the new RTX 4070 SUPER.
In-Game Benchmarks
Now we finally get into the in game performance and that is the main reason people pick up a new video card. To test things out I ran through our new benchmark suite that tests 8 games at three different resolutions (1080p, 1440p, and 4k). Most of the games tested have been run at the highest detail setting and a mid-range detail setting to get a look at how turning things up hurts performance and to give an idea of whether turning detail down from max will be beneficial for frame rates. In total, each video card is tested 42 times and that makes for a huge mess of results when you put them all together. To help with that I like to start with these overall playability graphs that take all of the results and give an easier-to-read result. I have one for each of the three resolutions and each is broken up into four FPS ranges. Under 30 FPS is considered unplayable, over 30 is playable but not ideal, over 60 is the sweet spot, and then over 120 FPS is for high refresh rate monitors.
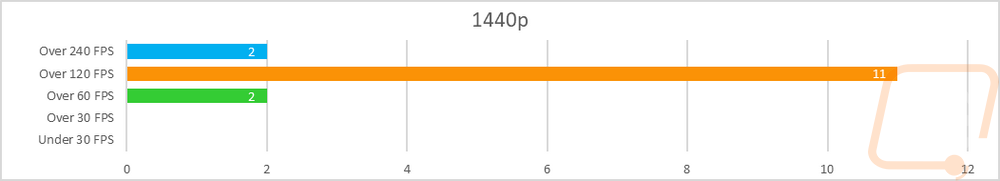
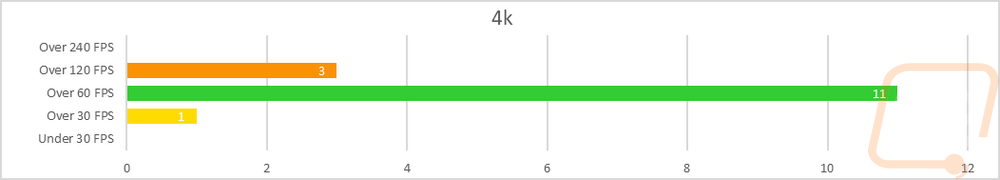
So how did the PURE RX 7900 GRE do when we look at its performance by resolution? Well no big surprises at 1080p, this is another card that is CPU limited in a lot of our 1080p tests. All of the results were up over 120 FPS and three of the results were also up over 240 FPS. 1440p was similar with two results in the 60-119 FPS range and a majority were all up over 120 FPS. There were also two that were up over 240 FPS. Then at 4K, we do finally start to see the limitations of the RX 7900 GRE with one result just barely under 60 FPS. Even still a majority of the results were smooth and in the 60+ range. This tracks with what AMD has designed the 7900 GRE to be, it is designed to be higher end at 1440p but still capable at 4K if needed and it is doing just that.

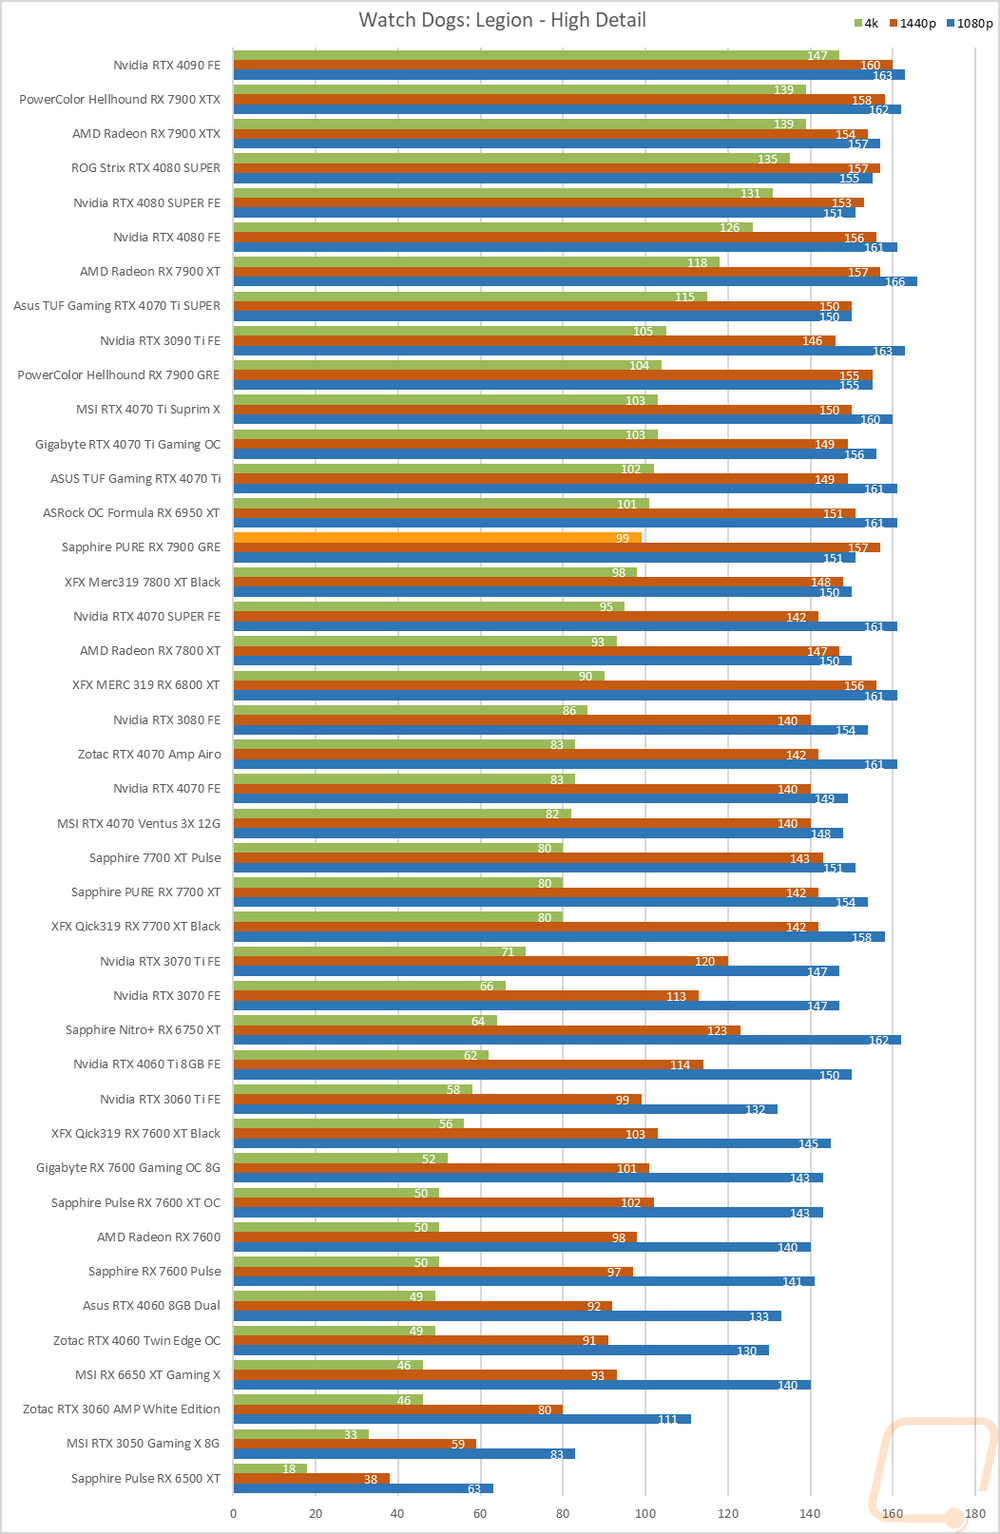
Of course, I have all of the actual in game results as well for anyone who wants to sort through the wall of graphs below. But I have also pulled all of the results for the range of cards above and beyond the PURE RX 7900 GRE and averaged them for each resolution so we can get a good comparison from card to card. 1080p isn’t worth looking at given the CPU limitations in this range but at 1440p and 4k we get a better look at things. The PURE RX 7900 GRE is just under 2 FPS below the Hellhound at 1440p and 1 FPS at 4k. That difference in base and boost overclock is noticeable but not enough to make any huge difference when compared to the other cards. Both 7900 GRE are just behind the original RTX 4070 Ti and have a good margin up over the RTX 4070 SUPER that just came out.
|
|
1080p |
1440p |
4K |
|
Nvidia RTX 4070 FE |
190.62 |
147.64 |
83.48 |
|
AMD Radeon RX 7800 XT |
190.74 |
156.30 |
89.33 |
|
XFX MERC 319 RX 6800 XT |
197.08 |
162.45 |
92.37 |
|
Nvidia RTX 4070 SUPER FE |
202.65 |
163.65 |
96.05 |
|
Sapphire PURE RX 7900 GRE |
199.42 |
171.79 |
99.54 |
|
Hellhound RX 7900 GRE |
201.40 |
173.47 |
101.59 |
|
ASUS TUF Gaming RTX 4070 Ti |
210.69 |
174.07 |
103.61 |
|
ASRock OC Formula RX 6950 XT |
205.27 |
176.52 |
105.86 |
|
AMD Radeon RX 7900 XT |
211.14 |
186.56 |
114.81 |
|
ASUS TUF Gaming RTX 4070 Ti SUPER |
213.44 |
183.76 |
114.07 |
Compute Benchmarks
Now some people don’t need a video card for gaming, they need the processing power for rendering or 2D/3D production, or in some cases, people who game also do work on the side. So it is also important to check out the compute performance on all of the video cards that come in. That includes doing a few different tests. My first test was a simple GPU Compute benchmark using Passmark’s Performance Test 10 and the PURE RX 7900 GRE didn’t do as well here, scoring 18341, 546 points lower than the Hellhound which is interesting. This was enough to drop it down below the RTX 4070.
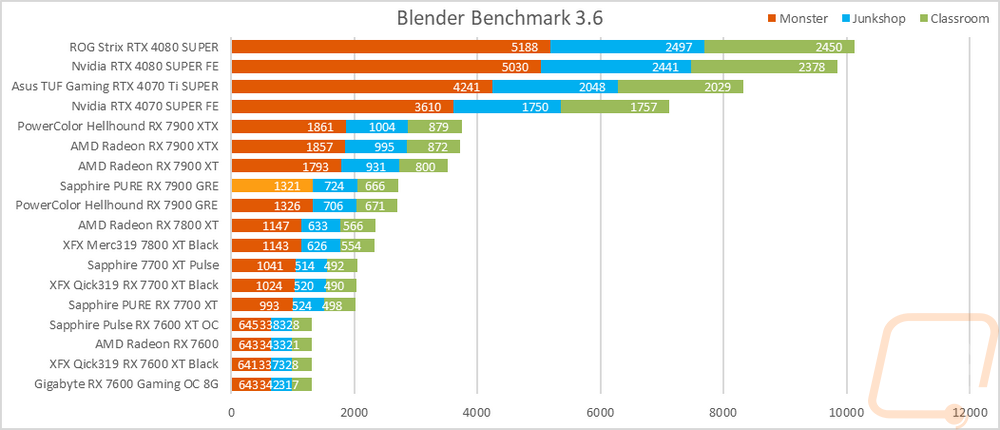
Blender is always my favorite compute benchmark because the open-source 3D rendering software is very popular and it isn’t a synthetic benchmark. With the latest version of Blender, they redid the benchmark so we now have a new test that runs three different renderings and gives each a score. I have all three stacked together so we can see the overall performance. The PURE RX 7900 GRE and really all of the Radeon cards struggle with Blender when compared to where Nvidia is at right now. The PURE RX 7900 GRE did come in ahead of the Hellhound and sitting behind the RX 6950 XT but to put that into perspective, those cards are all behind the RTX 3060 Ti.
Cooling Noise and Power
For my last few tests, rather than focusing on in game performance, I like to check out other aspects of video card performance. These are also the most important ways to differentiate the performance between cards that have the same GPU. To start things off I took a look at power usage.
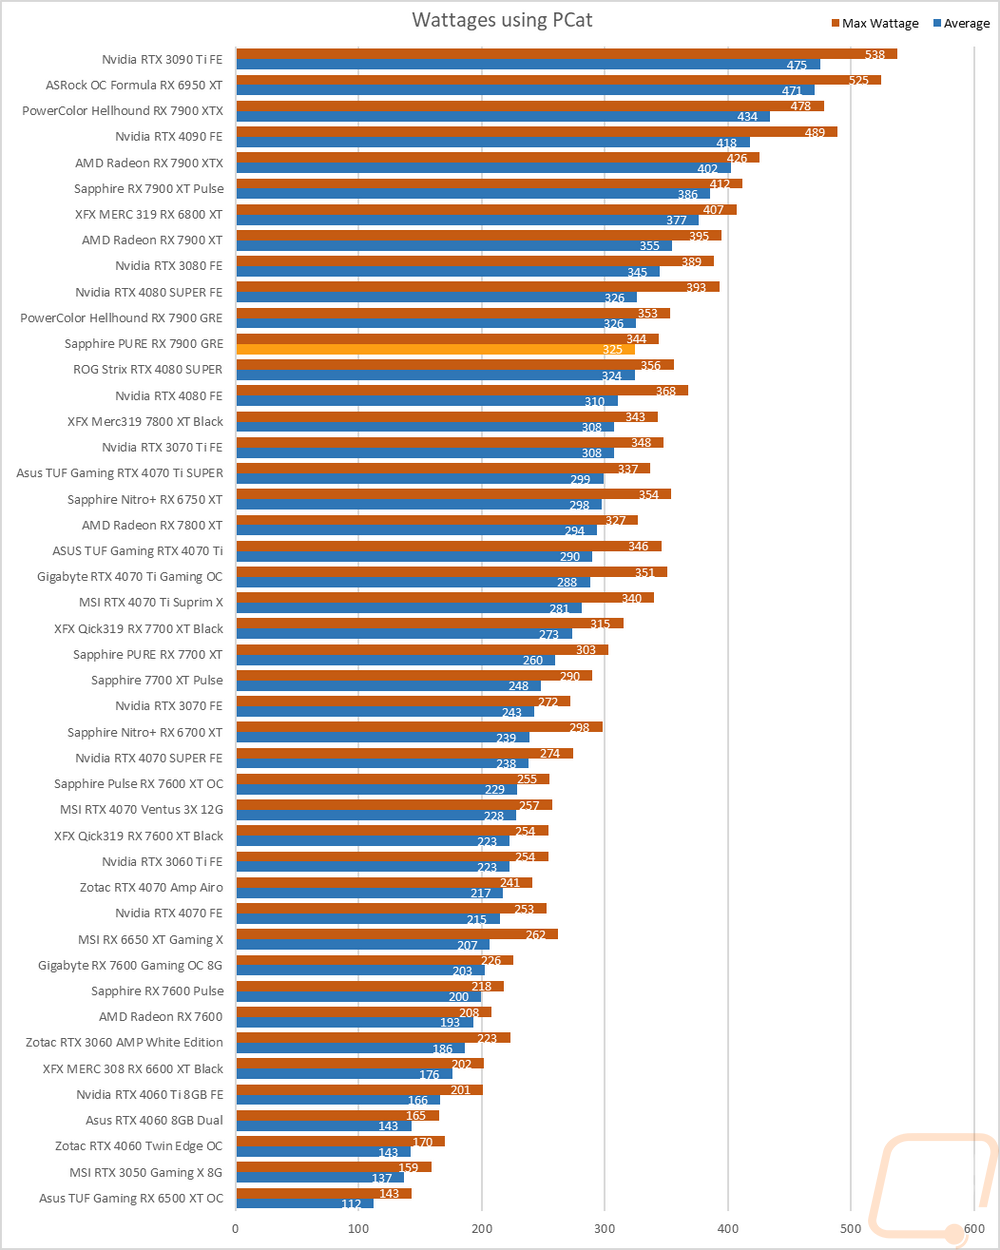
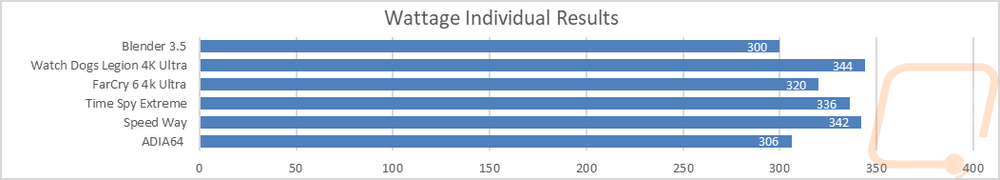
For this, our new test setup utilizes the Nvidia-designed PCat v2 along with cables to handle both traditional 6 or 8-pin connections as well as the new 12VHPWR. The PCat also utilizes a PCIe adapter to measure any power going to the card through the PCIe slot so we can measure the video card wattage exclusively, not the entire system as we have done in the past. I test with a mix of applications to get both in game, synthetic benchmarks, and other workloads like Blender and AIDA64. Then everything is averaged together for our result. I also have the individual results for this specific card and I document the peak wattage result as well which is almost always Time Spy Extreme but this time around was Watch Dogs at 344 watts peak for the PURE RX 7900 GRE. The PURE RX 7900 GRE then averaged 325 watts across the tests. The average was just 1 watt lower than the Hellhound which I was surprised about but the peak power being 9 watts lower made more sense with the Hellhound having a bigger overclock. The peak power result put the PURE RX 7900 GRE in line with an overclocked RX 7800 XT but the average watts put it just below the RTX 4080 SUPER.
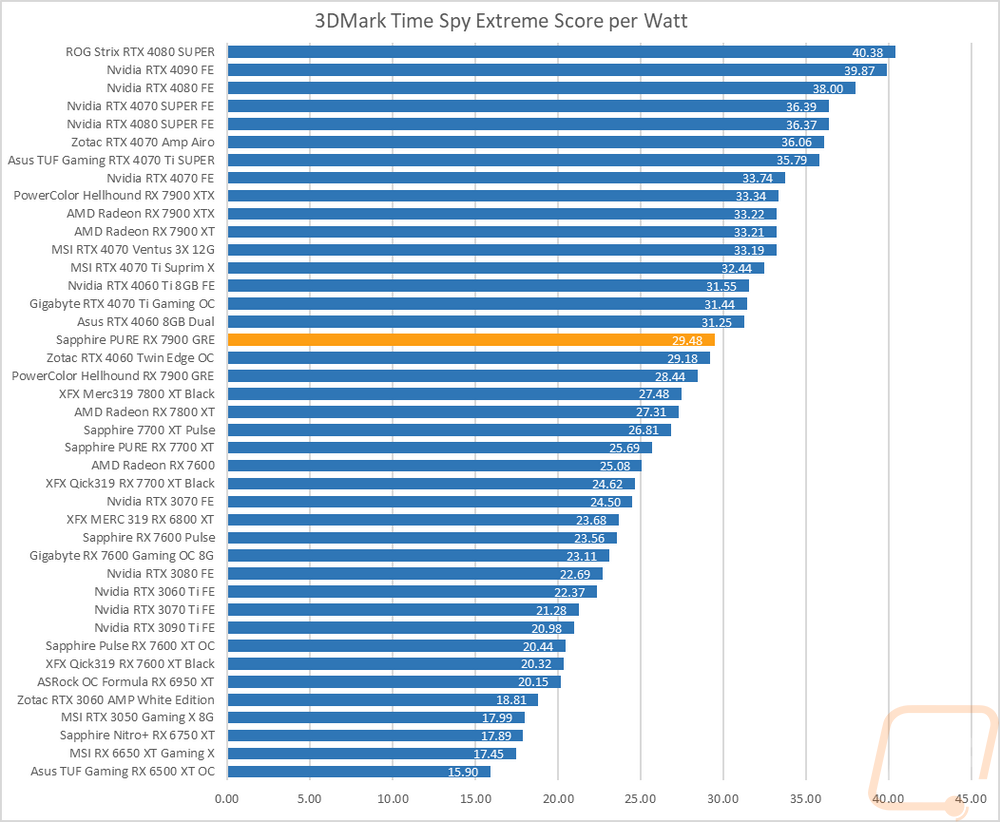
With having exact peak wattage numbers when running Time Spy Extreme I was also able to put together a graph showing the total score for each watt that a card draws which gives us an interesting look at overall power efficiency in the popular and demanding benchmark. With the PURE RX 7900 GRE pulling 336 watts at peak in Time Spy Extreme it ended up with a score per watt of 29.48 which was a big improvement compared to the Hellhound and was enough to jump up past the overclocked RTX 4060. The Radeon cards as a whole are a little behind Nvidia in power efficiency here and the PURE RX 7900 GRE being overclocked isn’t up in the same range as the RX 7900 XT and XTX but AMD did improve on efficiency compared to the 7800 XT with the GRE.
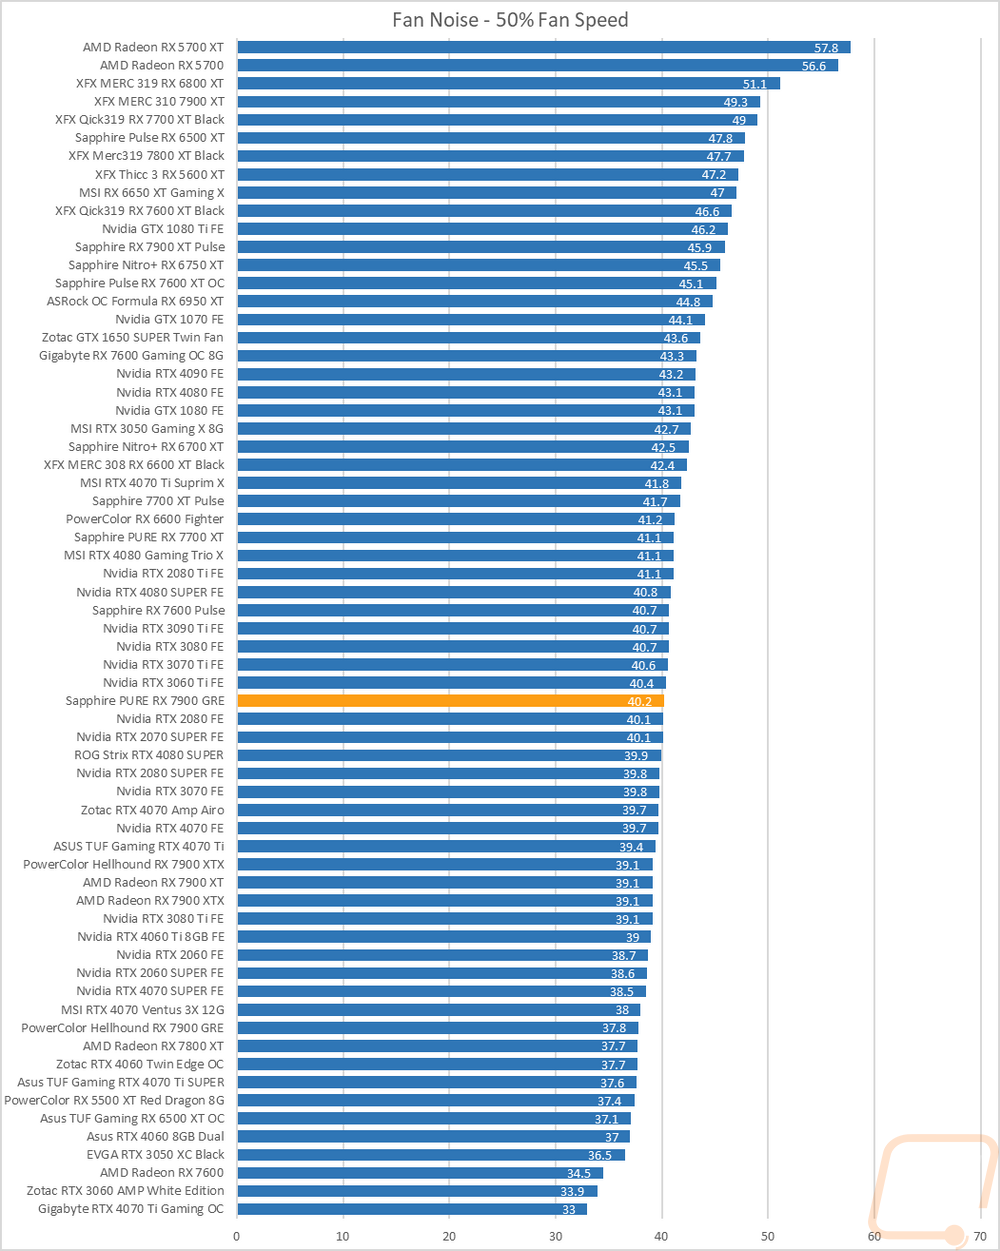
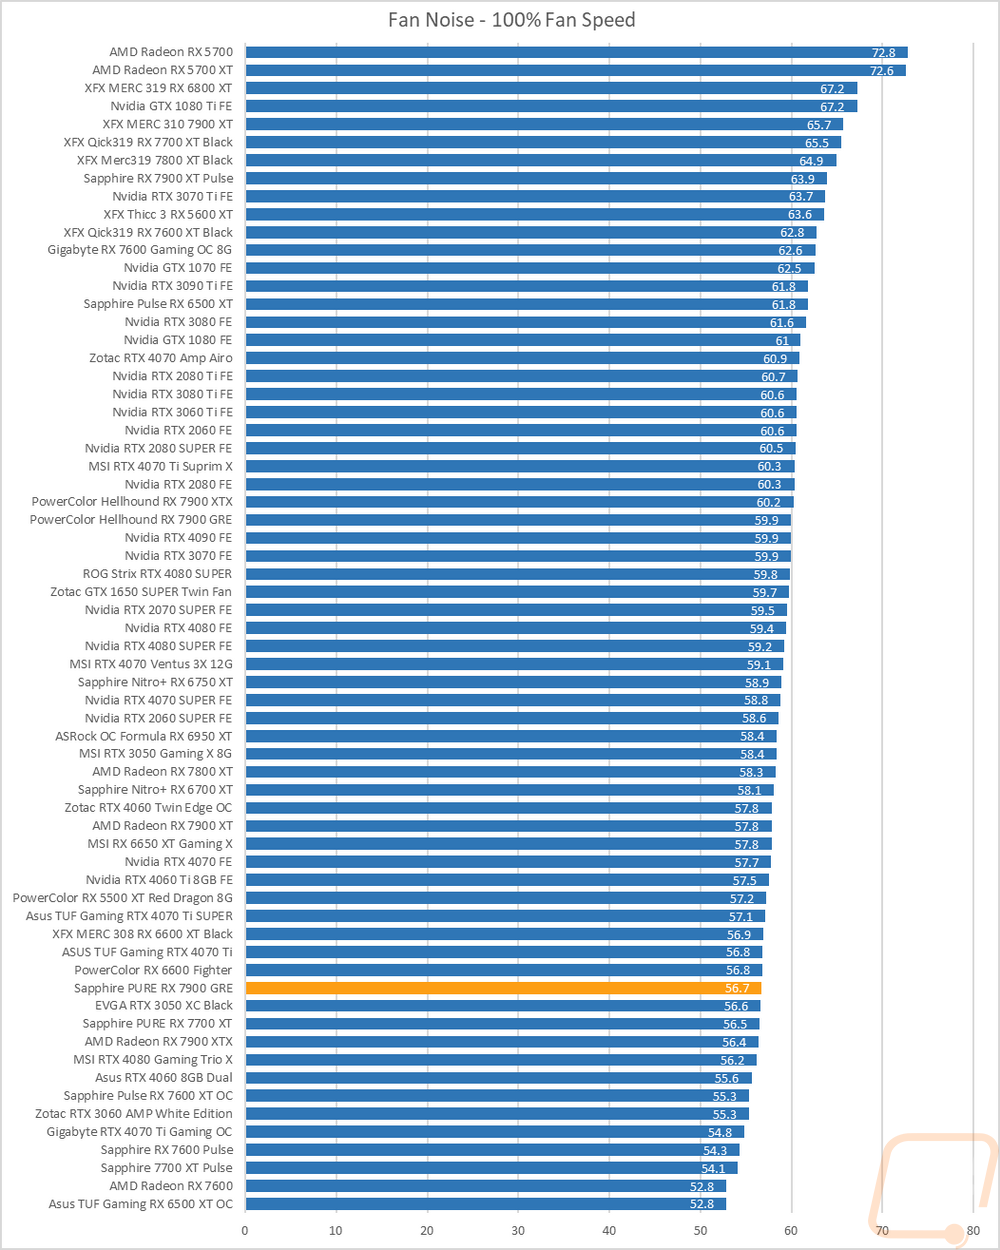
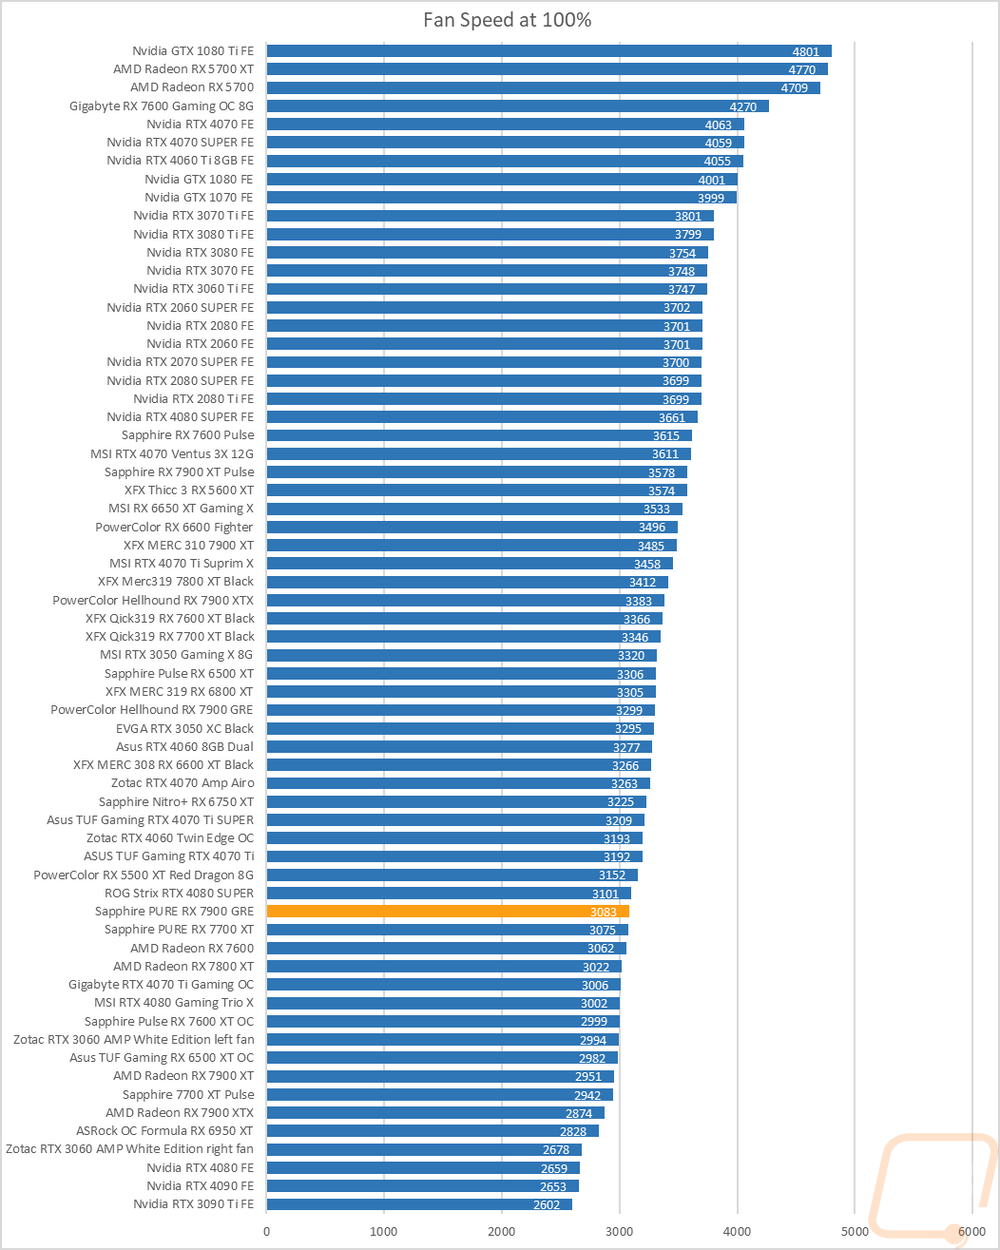
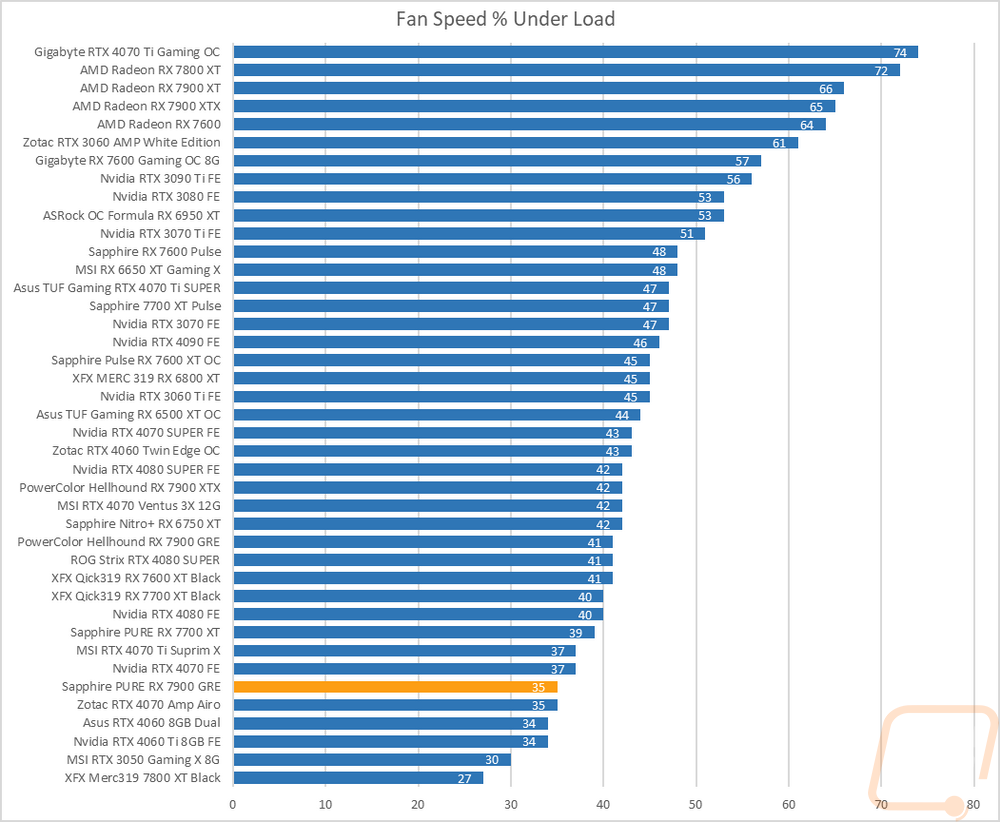
My next round of tests were looking at noise levels. These are especially important to me because I can’t stand to listen to my PC whirling. Especially when I’m not in game and other applications are using the GPU. For my testing, though I first tested with the fan cranked up to 100% to get an idea of how loud it can get, then again at 50% to get an idea of its range. The PURE RX 7900 GRE came in at 40.2 dB in the 50% fan speed which was louder than the Hellhound in the same test but still below the average. But when we crank the fan speed up to 100% the PURE RX 7900 GRE drops down in the chart where the Hellhound went up. This helps somewhat with the PURE RX 7900 GRE running at a lower max fan speed but it does mean that you can take advantage of the full range of fan speed without worrying as much.
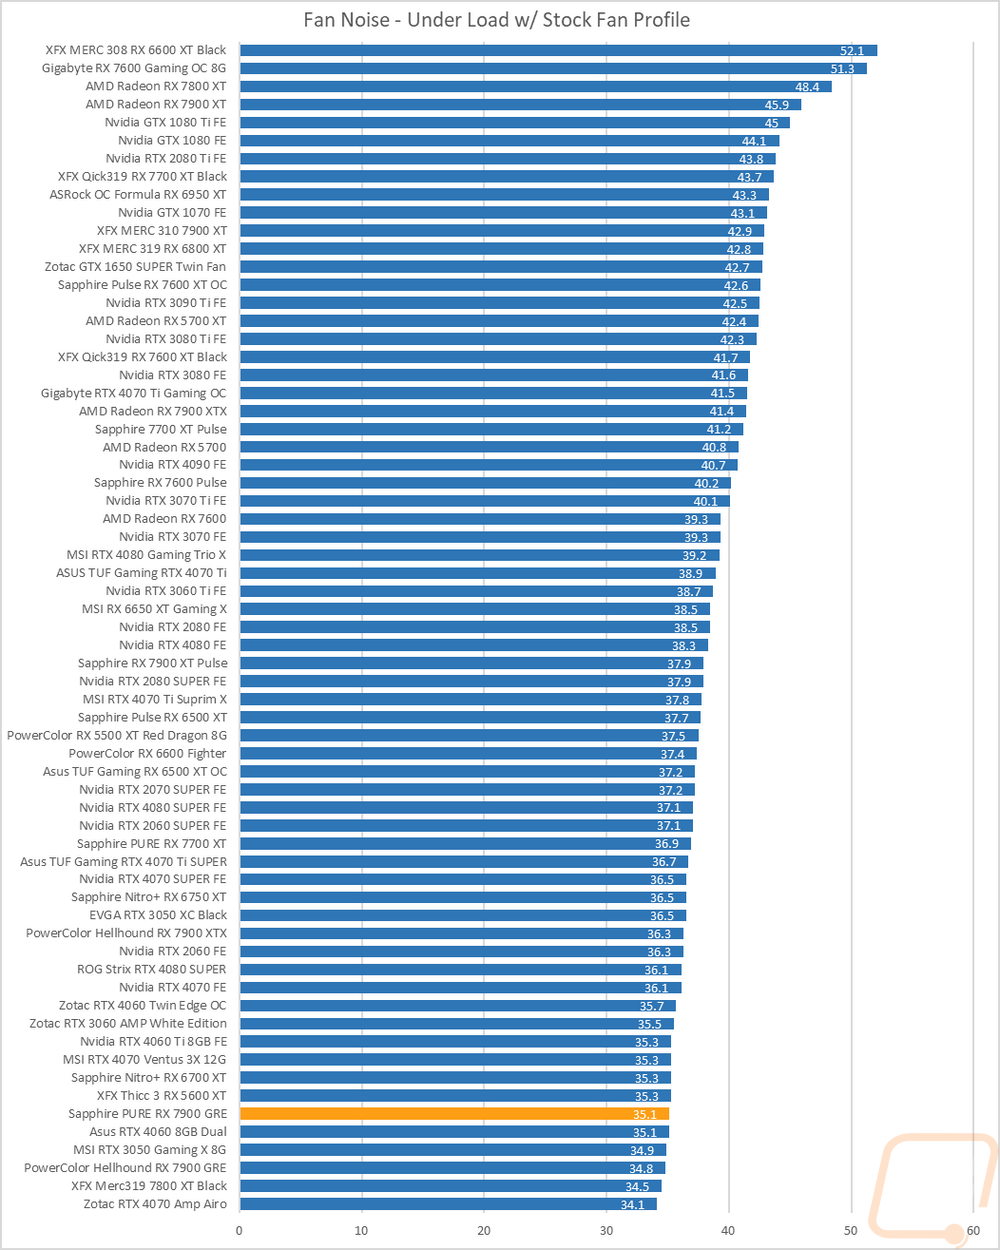
I also take a look at noise performance while under load. For that when running AIDA64’s stress test I wait until the temperature of the card has leveled off and then measure how loud things are when the card is at its worst-case scenario with the stock fan profile. This is the most important noise test because it is as loud as most people will ever experience and the PURE RX 7900 GRE did well here sitting at just 35.1 dB, helped with the fans running at just 35% fan speed when under load.
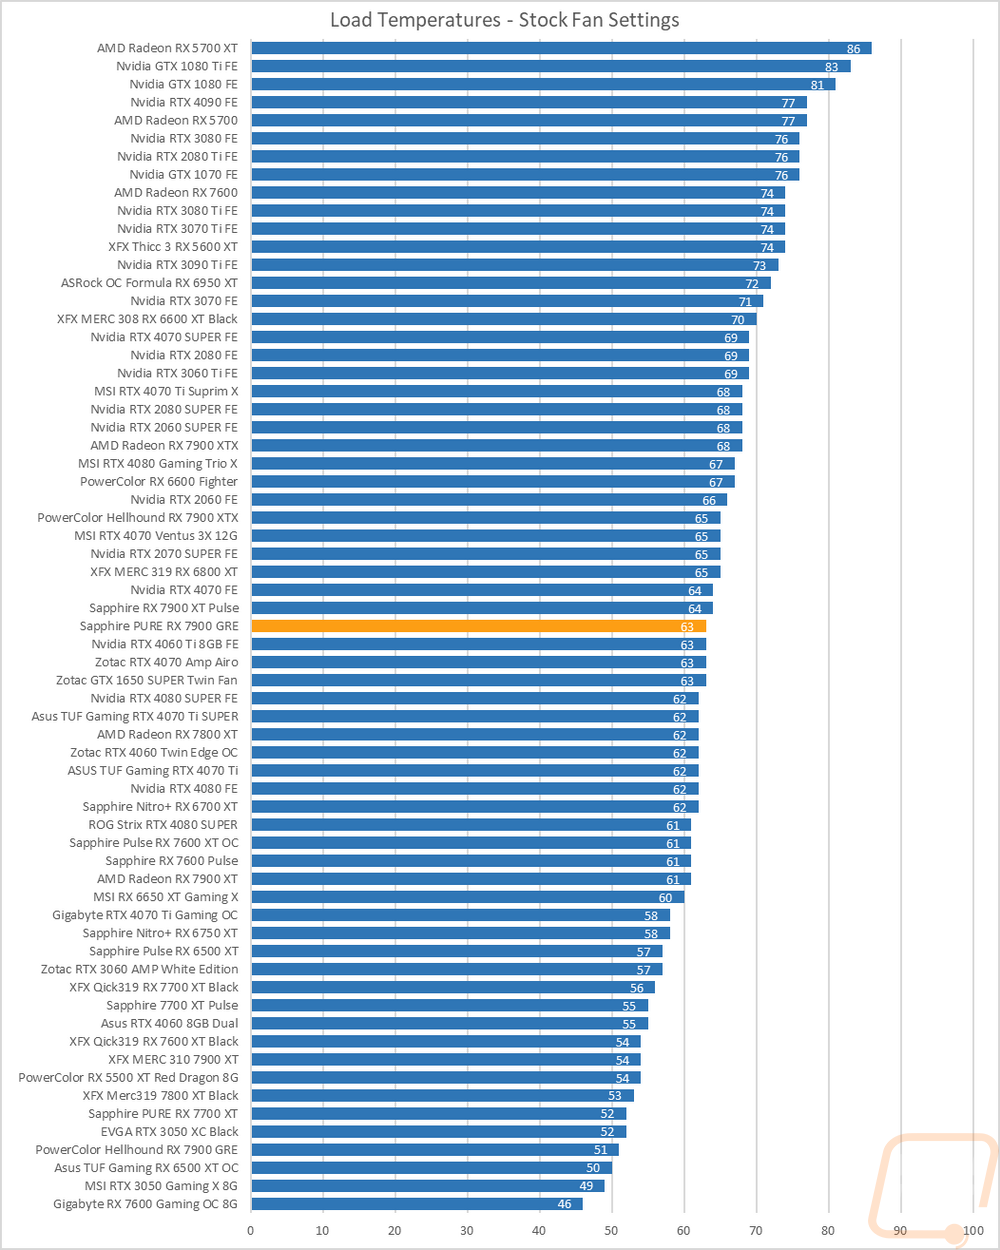
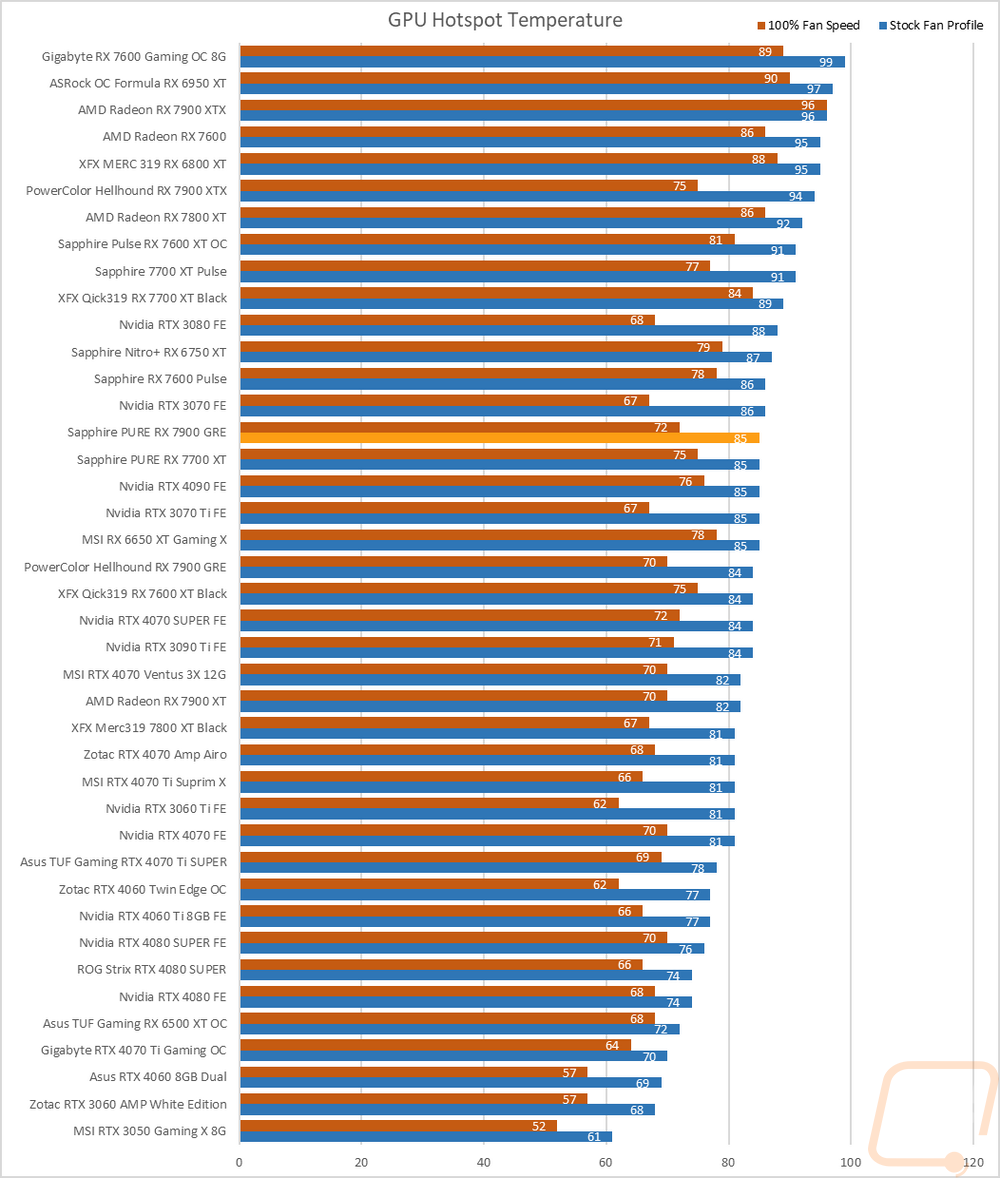
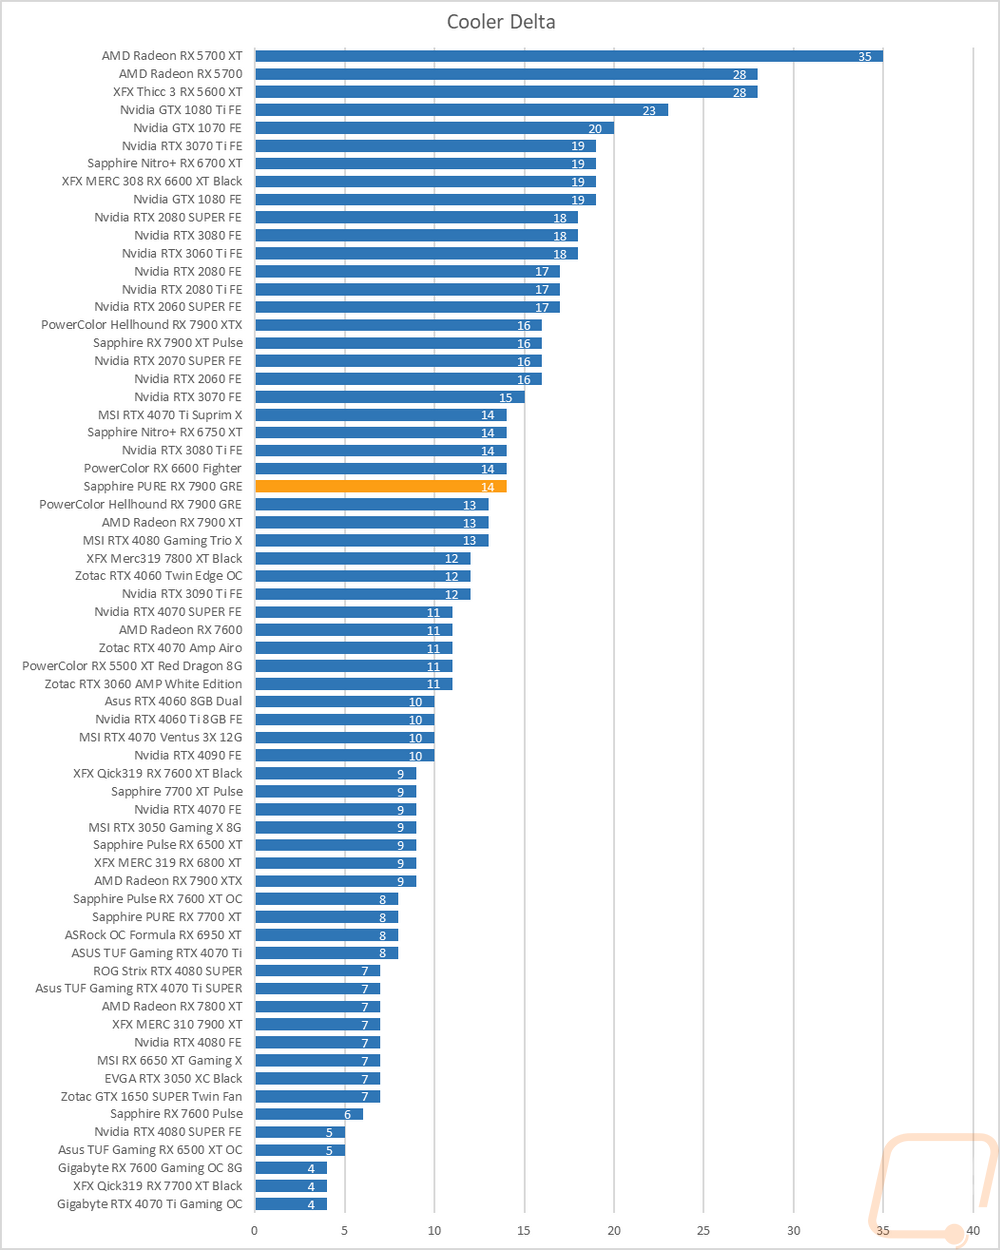
To finish up my testing I of course had to check out the cooling performance. To do this I ran two different tests. I used AIDA64’s Stress Test run for a half-hour each to warm things up. Then I documented what temperature the GPU leveled out at with the stock fan profile and then again with the fans cranked up to 100%. With the stock profile, the PURE RX 7900 GRE came in right into the middle of the pack for cards tested at 63c. Where the Hellhound went for full cooling performance at the cost of noise Sapphire set their target temperature a little higher but not high enough to be a concern but kept things quiet. Of course, like with the Hellhound the GPU Hotspot was a little warm at 85c, just one degree above the Hellhound.
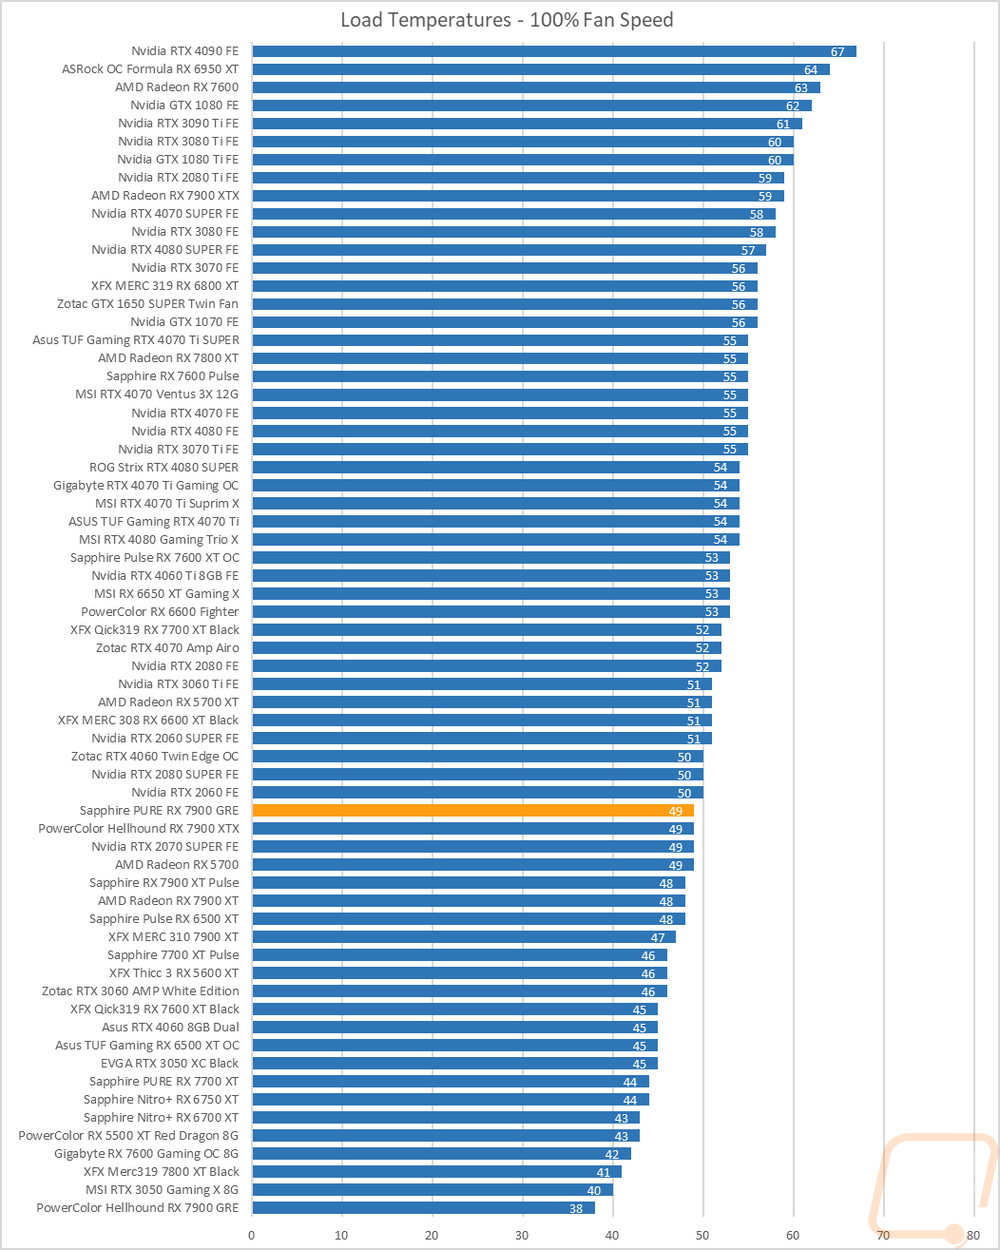
Then with the fans cranked up, the PURE RX 7900 GRE ran significantly cooler at 49c. This put the delta between the stock fan profile and 100% fan speed at 14c which is a little higher than average. That isn’t a big surprise though, we saw that they were soft on their stock fan profile to tune it better for noise performance but if you need the extra cooling the cooling is there. This really shows just how overkill this same cooler was on the RX 7700 XT PURE.
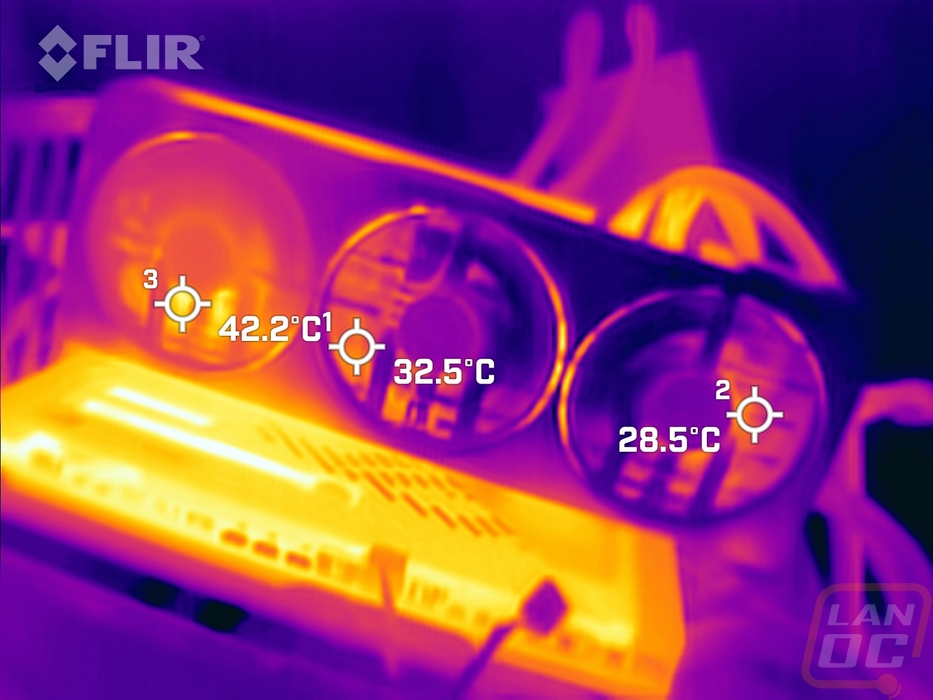
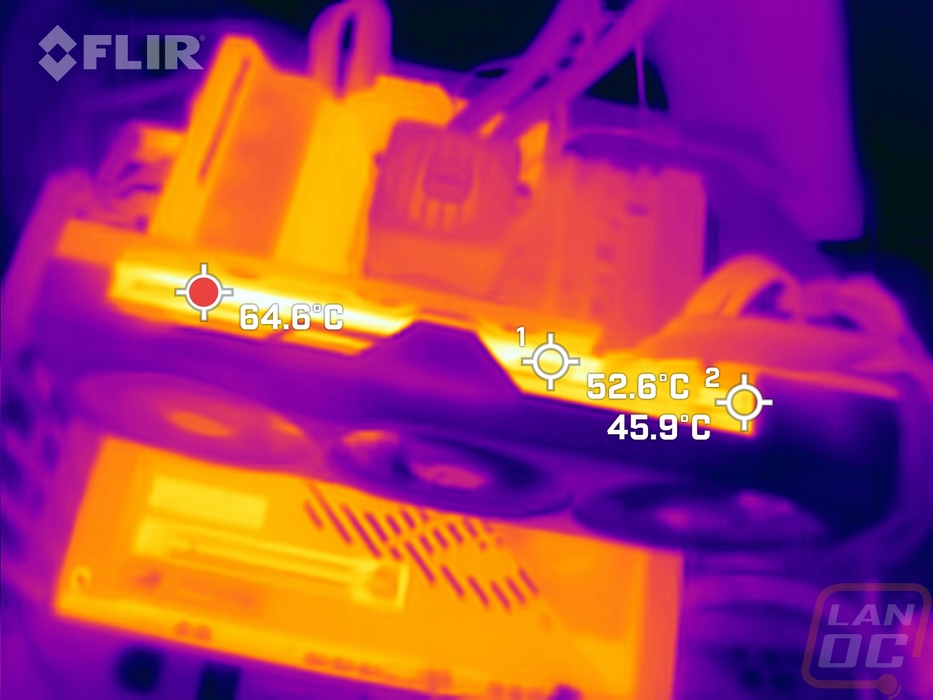
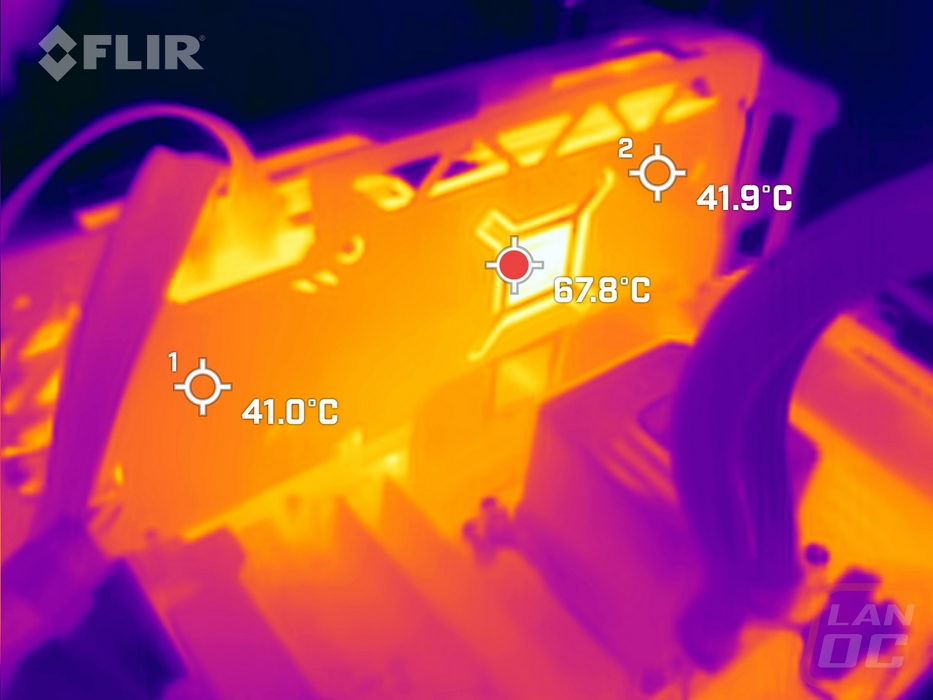
While running the stock fan profile testing I also took the time to get a few thermal images so we could see what is going on. The fan side of the PURE RX 7900 GRE is a lot warmer on the left side, especially at the bottom of the first fan. Over on the right side, the blow-through area has things running nice and cool at 28.5c. Of course with the cooler design pushing air out of the top and bottom edge of the card, we can see the top is a lot farther than the front, especially in the spots where you can see the PCB which is up to 64.6c here. But the hottest spot is the exposed PCB directly behind the GPU at 67.8c. The rest of the metal backplate is warm but consistent with both readings in the 41c range on either end of the card so it is pulling heat out and across the back.
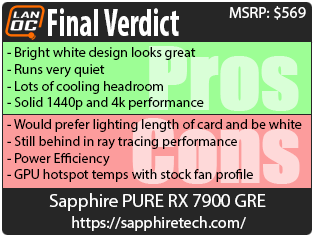
Overall and Final Verdict
After my previous Sapphire PURE experience, I had high hopes for the Sapphire PURE RX 7900 GRE, and in a majority of ways it didn’t disappoint. The bright white design is the highlight though, Sapphire did a great job putting together a clean design that still does integrate a little bit of flair. They did that with a few accent grooves and the use of grey accent lines. Having the shroud, backplate, and fans all matching with that bright white helps a lot. White can be tough and sometimes it can look good and not hold up but with our first PURE RX 7700 XT on hand to put next to the PURE RX 7900 GRE you can’t tell them apart. Not just because the white hasn’t changed at all but Sapphire’s design is the same between the two. It shows just how overkill that 7000 XT design was as well. Especially with the PURE RX 7900 GRE doing a good job with its cooling performance and leaving plenty of headroom for anyone who wants to overclock the card a little more. The Hellhound 7900 GRE that I previously took a look at does run cooler but the PURE RX 7900 GRE has done a better job on its fan profile to balance cooling and noise performance with it running extremely quiet in those important tests. The RX 7900 GRE as a whole of course performs well at both 1440p and 4k with 1440p performance capable of higher refresh rates and 4k performance that will stay smooth when playing demanding newer games. Of course, with esport-focused titles both resolutions aren’t going to be a problem at high refresh rates as well. That said, the PURE RX 7900 GRE did come in behind the Hellhound in almost all of our performance tests. The Hellhound had a more aggressive overclock and would most likely match up better against Sapphire's flagship line the RX 7900 GRE Nitro+. But the PURE RX 7900 GRE does still have the headroom for an overclock to catch up if needed.
As far as faults go. Aesthetically the main downside for me, which was an issue when I took a look at the PURE previously as well, is the lighting. They have the Sapphire logo up top backlit with red lighting and it glows through most of the white card. I think the red looks good actually but because it is in the center it should run the full length of the card. White lighting would better match the card though if we are changing things. Like with the Hellhound, the GPU Hotspot temps were a touch high, not concerning but I do wish they were a few degrees lower. The 7900 GRE, like with all of the Radeon cards right now, is still struggling in comparison with the competition in ray tracing even with improvements this generation. The same goes for power efficiency. The PURE RX 7900 GRE did help things, being a lot more efficient than the Hellhound but it is still running in the range where the last generation of Nvidia cards were at.
Overall though, the PURE RX 7900 GRE was outperforming the RTX 4070 SUPER cards that were just recently introduced and came close to the performance of the recently replaced RTX 4070 Ti. It is doing that at a lower price. The official MSRP of the RX 7900 GRE is $549 and Sapphire hasn’t gone too far beyond that for the PURE RX 7900 GRE which is selling for $569. This makes this a great buy. Especially in a world where we see a lot of all-white cards like this selling for a big premium, Sapphire hasn’t done that at all. For those looking for great 1440p performance and 4k capabilities the 7900 GRE is looking to be a good value and the Sapphire PURE RX 7900 GRE is THE option for anyone going for a while build.

Live Pricing: HERE


