Cooling Noise and Power
For my last few tests, rather than focusing on in game performance, I like to check out other aspects of video card performance. These are also the most important ways to differentiate the performance between cards that have the same GPU. To start things off I took a look at power usage.
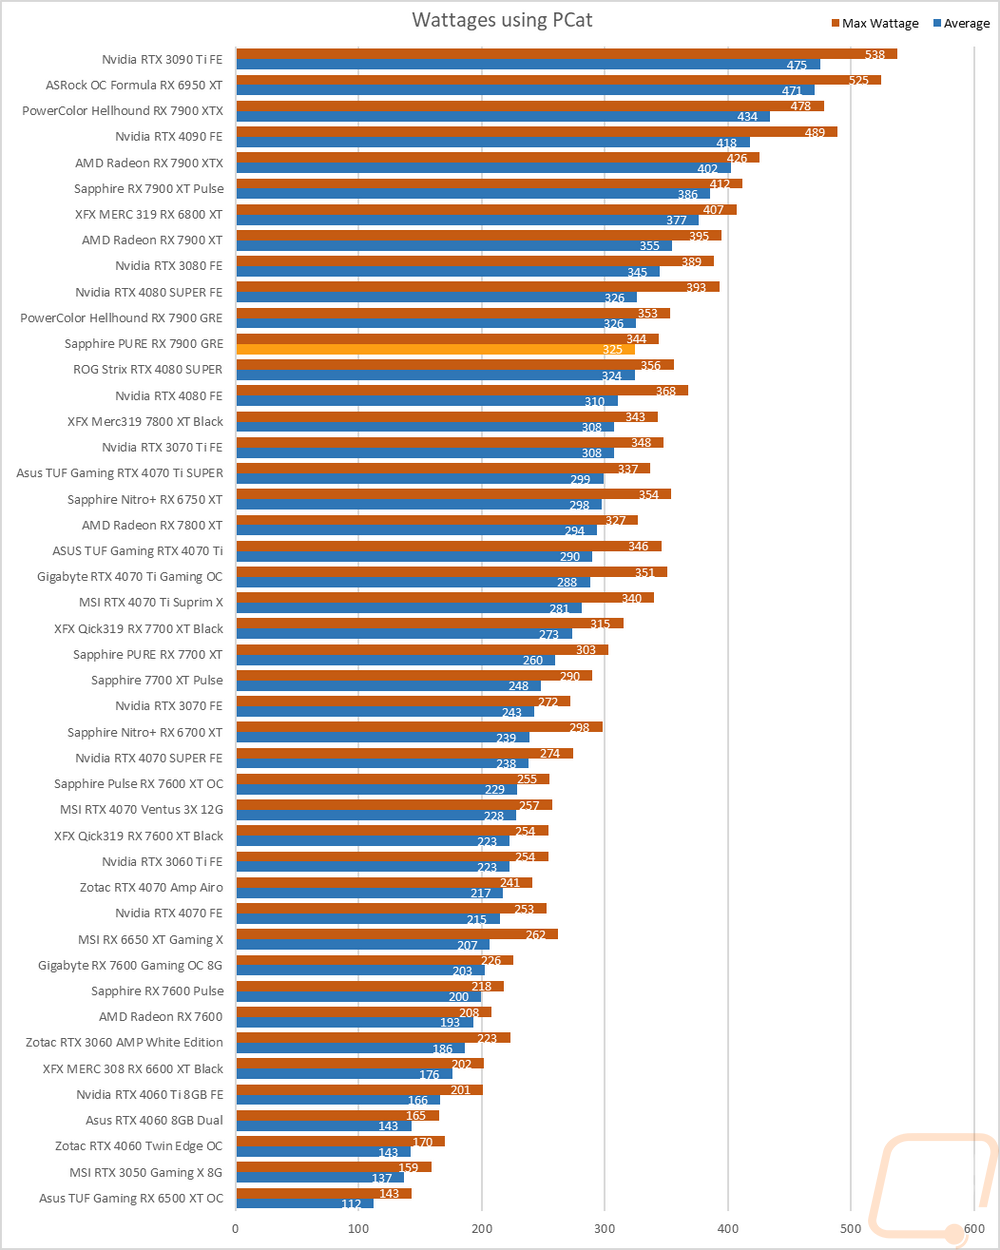
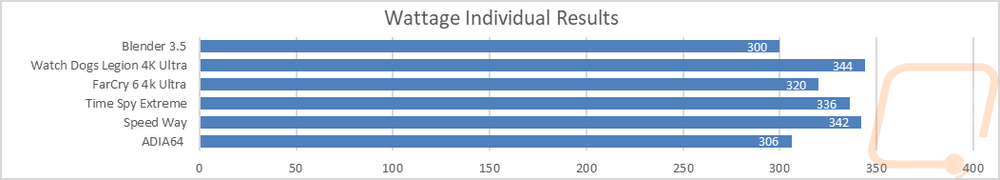
For this, our new test setup utilizes the Nvidia-designed PCat v2 along with cables to handle both traditional 6 or 8-pin connections as well as the new 12VHPWR. The PCat also utilizes a PCIe adapter to measure any power going to the card through the PCIe slot so we can measure the video card wattage exclusively, not the entire system as we have done in the past. I test with a mix of applications to get both in game, synthetic benchmarks, and other workloads like Blender and AIDA64. Then everything is averaged together for our result. I also have the individual results for this specific card and I document the peak wattage result as well which is almost always Time Spy Extreme but this time around was Watch Dogs at 344 watts peak for the PURE RX 7900 GRE. The PURE RX 7900 GRE then averaged 325 watts across the tests. The average was just 1 watt lower than the Hellhound which I was surprised about but the peak power being 9 watts lower made more sense with the Hellhound having a bigger overclock. The peak power result put the PURE RX 7900 GRE in line with an overclocked RX 7800 XT but the average watts put it just below the RTX 4080 SUPER.
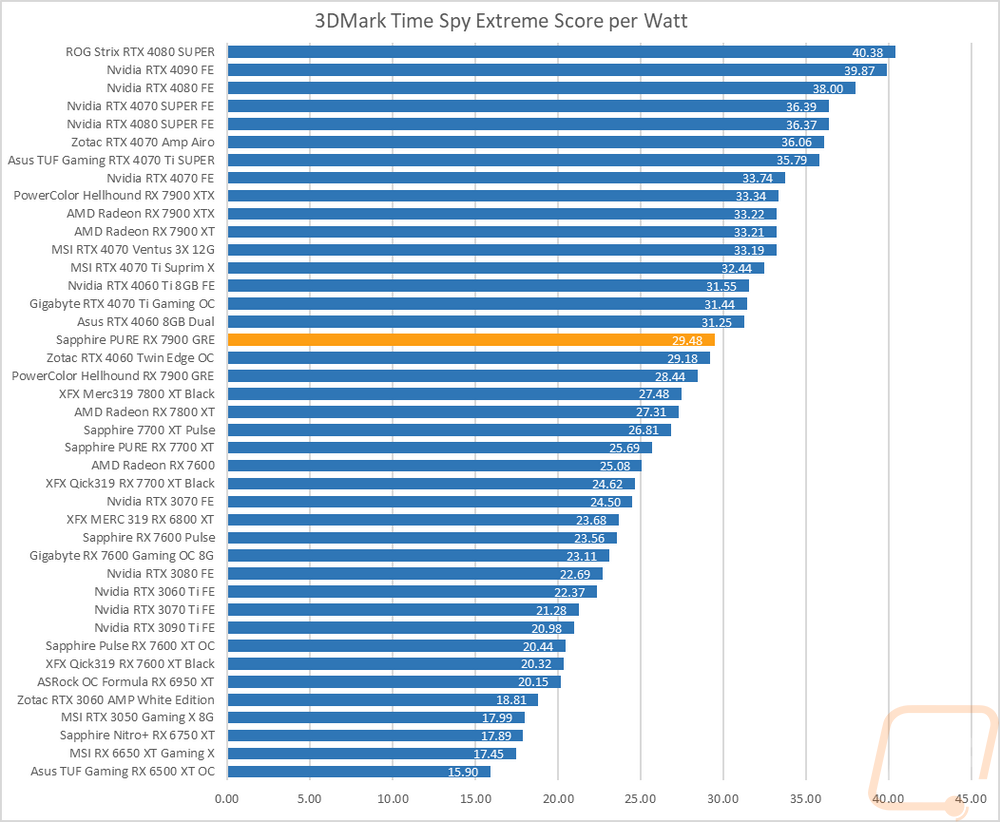
With having exact peak wattage numbers when running Time Spy Extreme I was also able to put together a graph showing the total score for each watt that a card draws which gives us an interesting look at overall power efficiency in the popular and demanding benchmark. With the PURE RX 7900 GRE pulling 336 watts at peak in Time Spy Extreme it ended up with a score per watt of 29.48 which was a big improvement compared to the Hellhound and was enough to jump up past the overclocked RTX 4060. The Radeon cards as a whole are a little behind Nvidia in power efficiency here and the PURE RX 7900 GRE being overclocked isn’t up in the same range as the RX 7900 XT and XTX but AMD did improve on efficiency compared to the 7800 XT with the GRE.
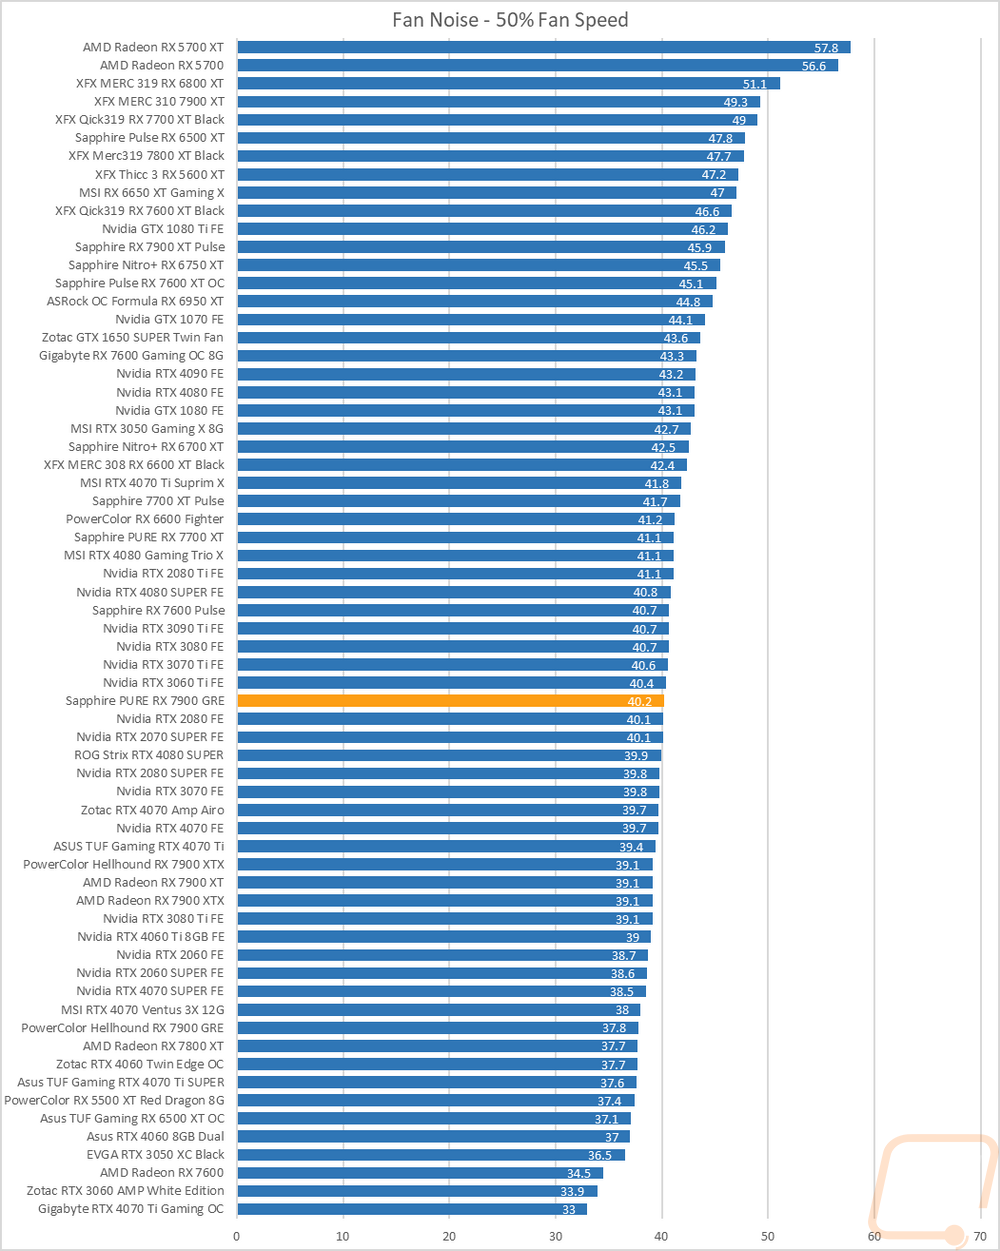
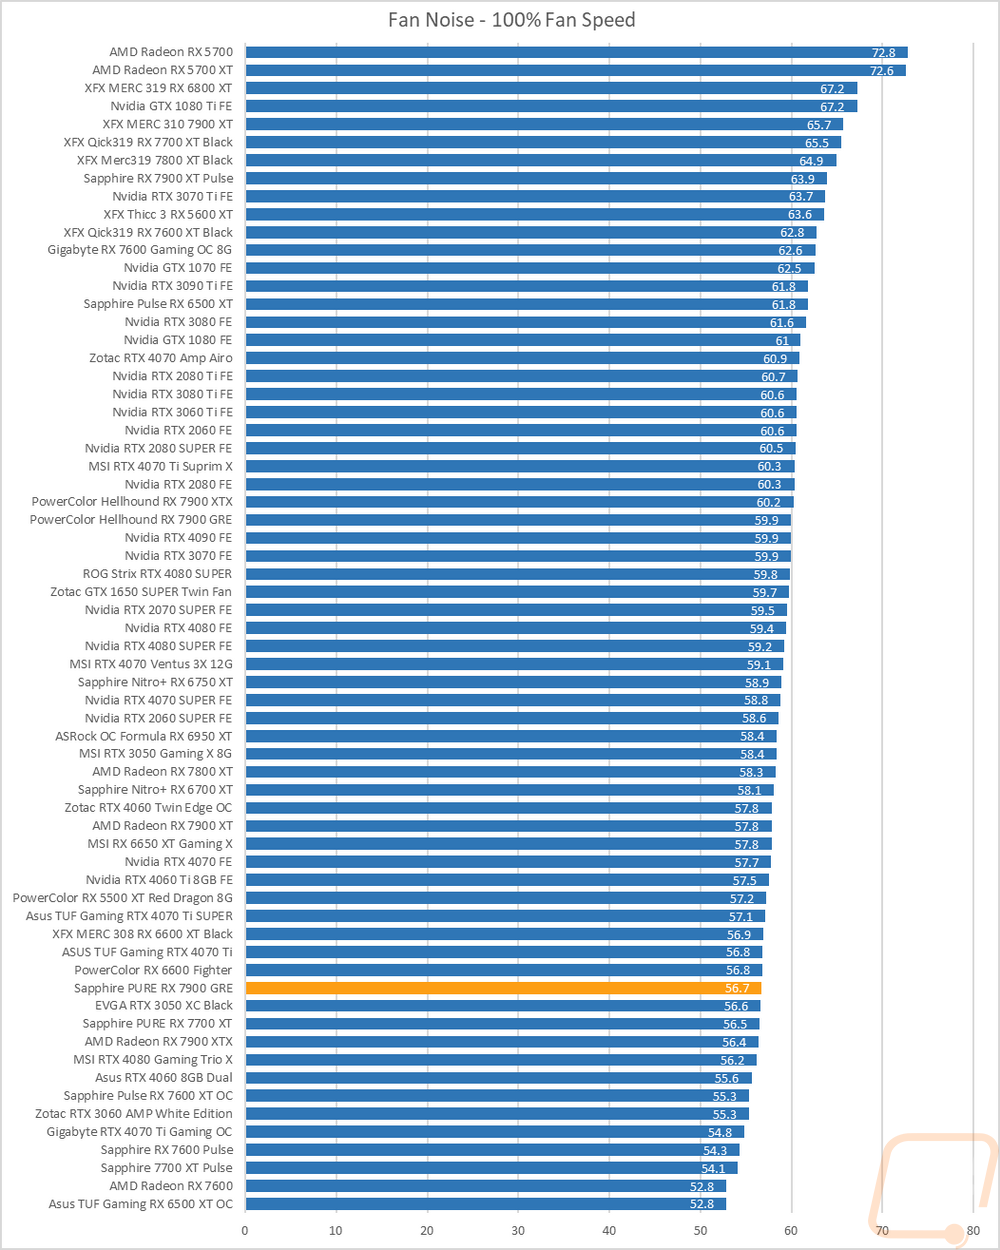
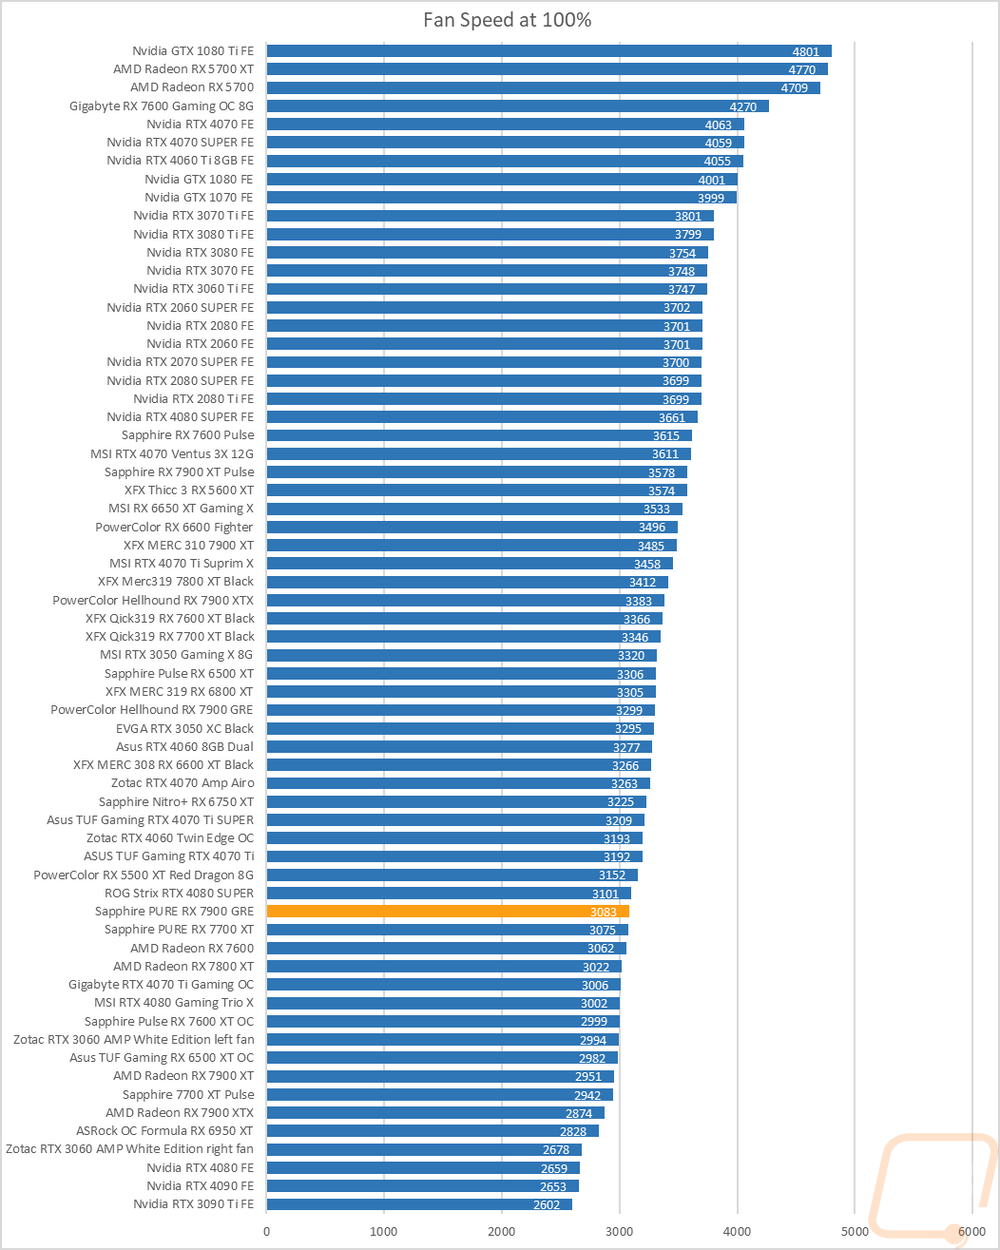
My next round of tests were looking at noise levels. These are especially important to me because I can’t stand to listen to my PC whirling. Especially when I’m not in game and other applications are using the GPU. For my testing, though I first tested with the fan cranked up to 100% to get an idea of how loud it can get, then again at 50% to get an idea of its range. The PURE RX 7900 GRE came in at 40.2 dB in the 50% fan speed which was louder than the Hellhound in the same test but still below the average. But when we crank the fan speed up to 100% the PURE RX 7900 GRE drops down in the chart where the Hellhound went up. This helps somewhat with the PURE RX 7900 GRE running at a lower max fan speed but it does mean that you can take advantage of the full range of fan speed without worrying as much.
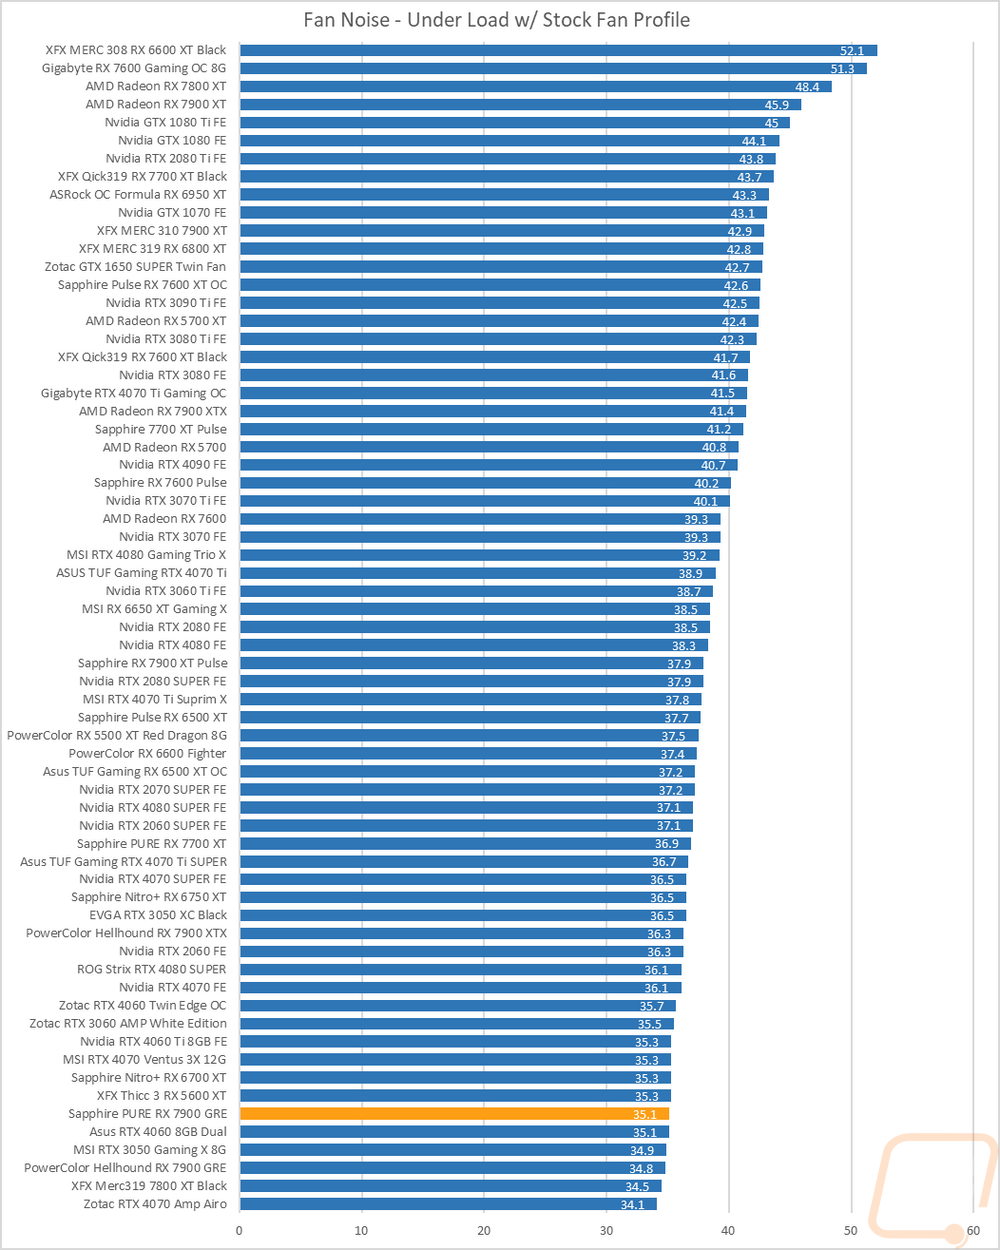
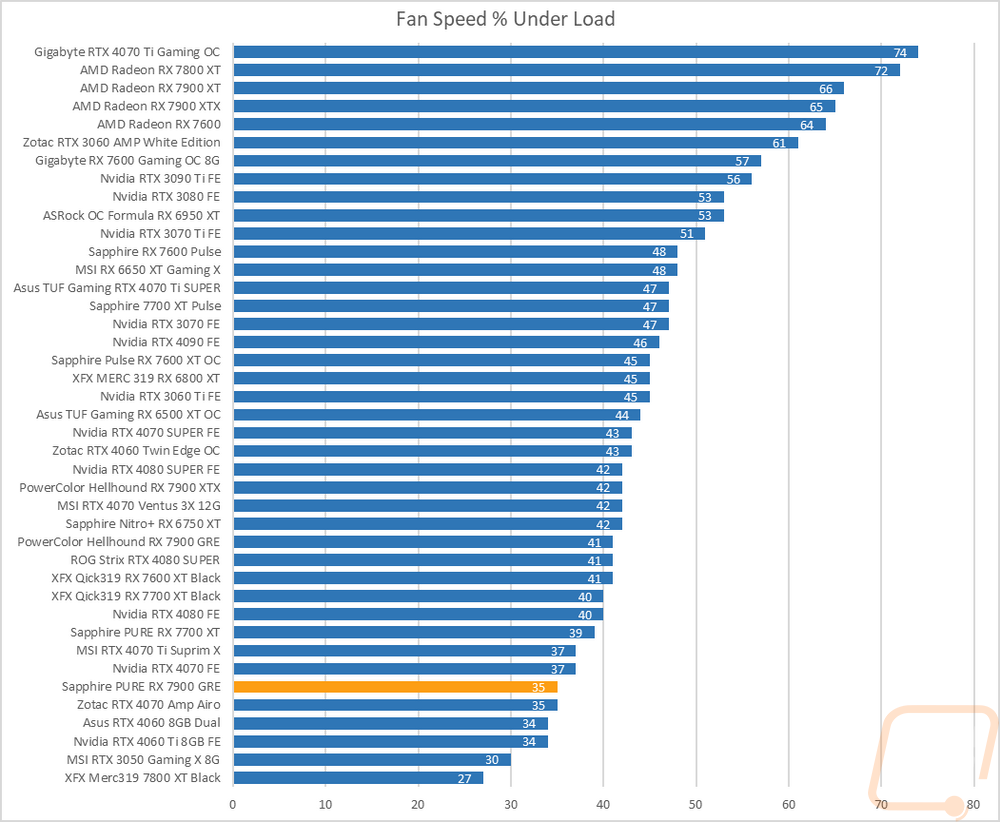
I also take a look at noise performance while under load. For that when running AIDA64’s stress test I wait until the temperature of the card has leveled off and then measure how loud things are when the card is at its worst-case scenario with the stock fan profile. This is the most important noise test because it is as loud as most people will ever experience and the PURE RX 7900 GRE did well here sitting at just 35.1 dB, helped with the fans running at just 35% fan speed when under load.
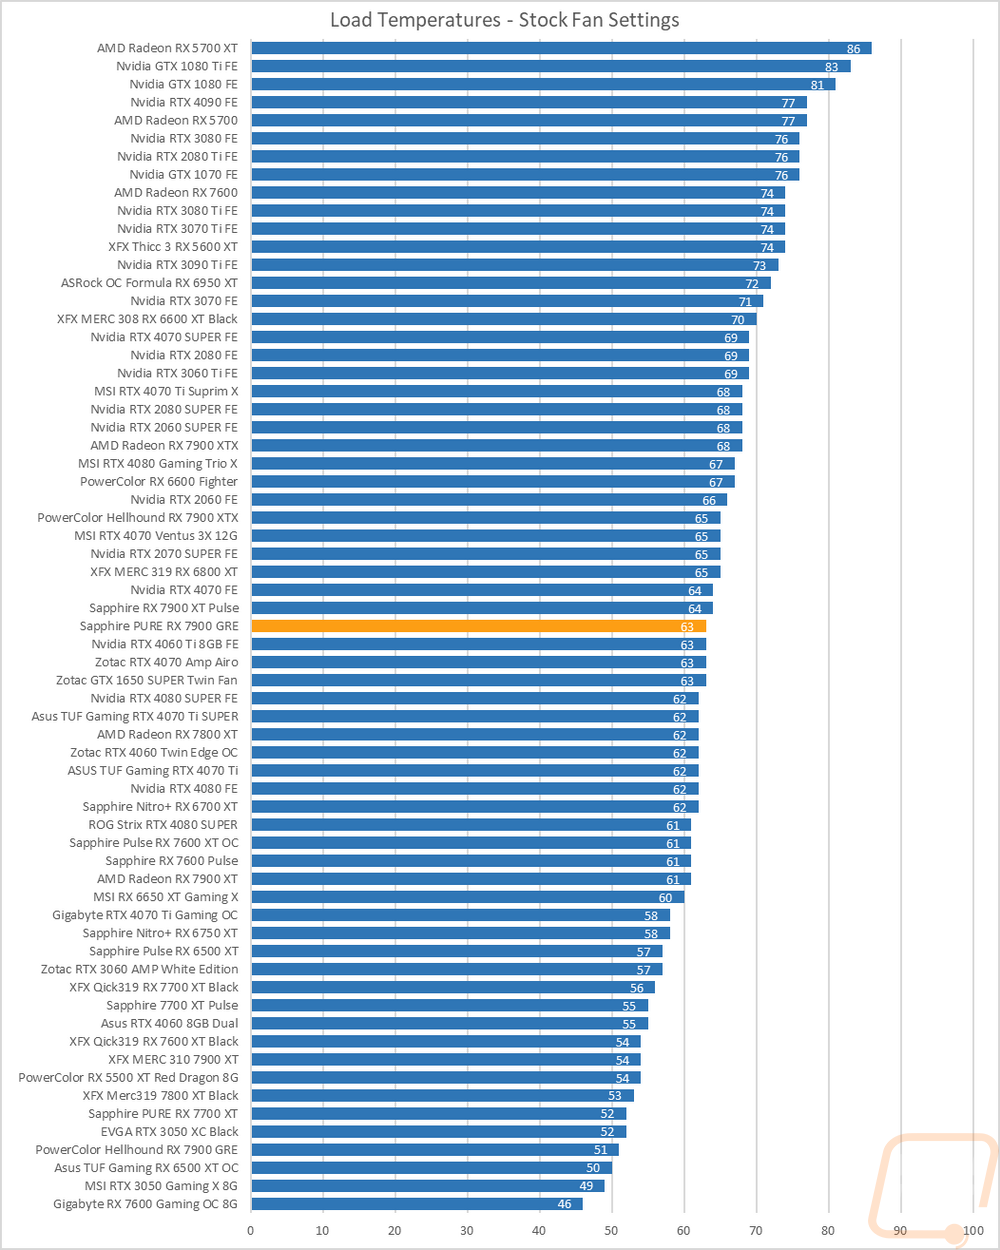
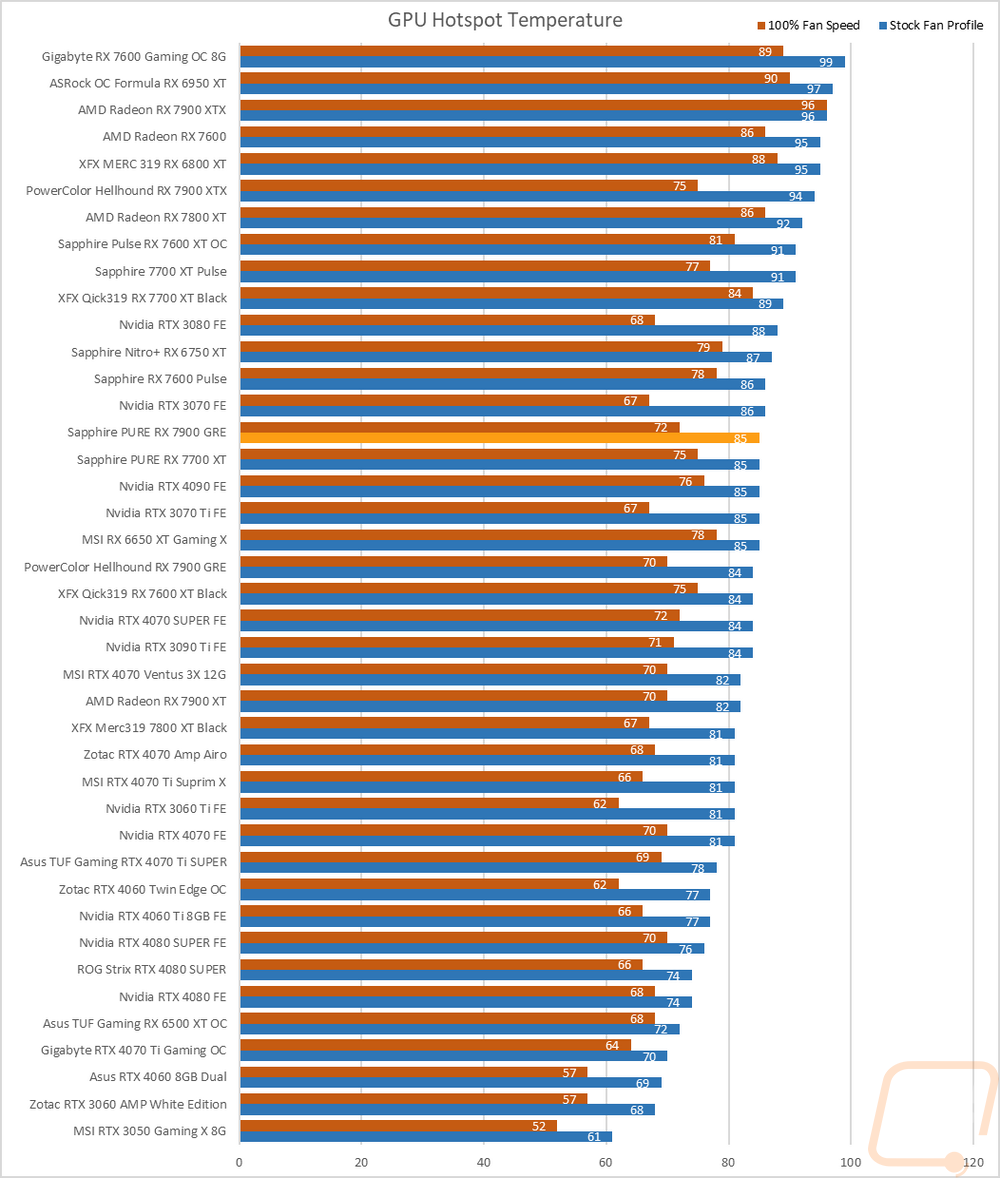
To finish up my testing I of course had to check out the cooling performance. To do this I ran two different tests. I used AIDA64’s Stress Test run for a half-hour each to warm things up. Then I documented what temperature the GPU leveled out at with the stock fan profile and then again with the fans cranked up to 100%. With the stock profile, the PURE RX 7900 GRE came in right into the middle of the pack for cards tested at 63c. Where the Hellhound went for full cooling performance at the cost of noise Sapphire set their target temperature a little higher but not high enough to be a concern but kept things quiet. Of course, like with the Hellhound the GPU Hotspot was a little warm at 85c, just one degree above the Hellhound.
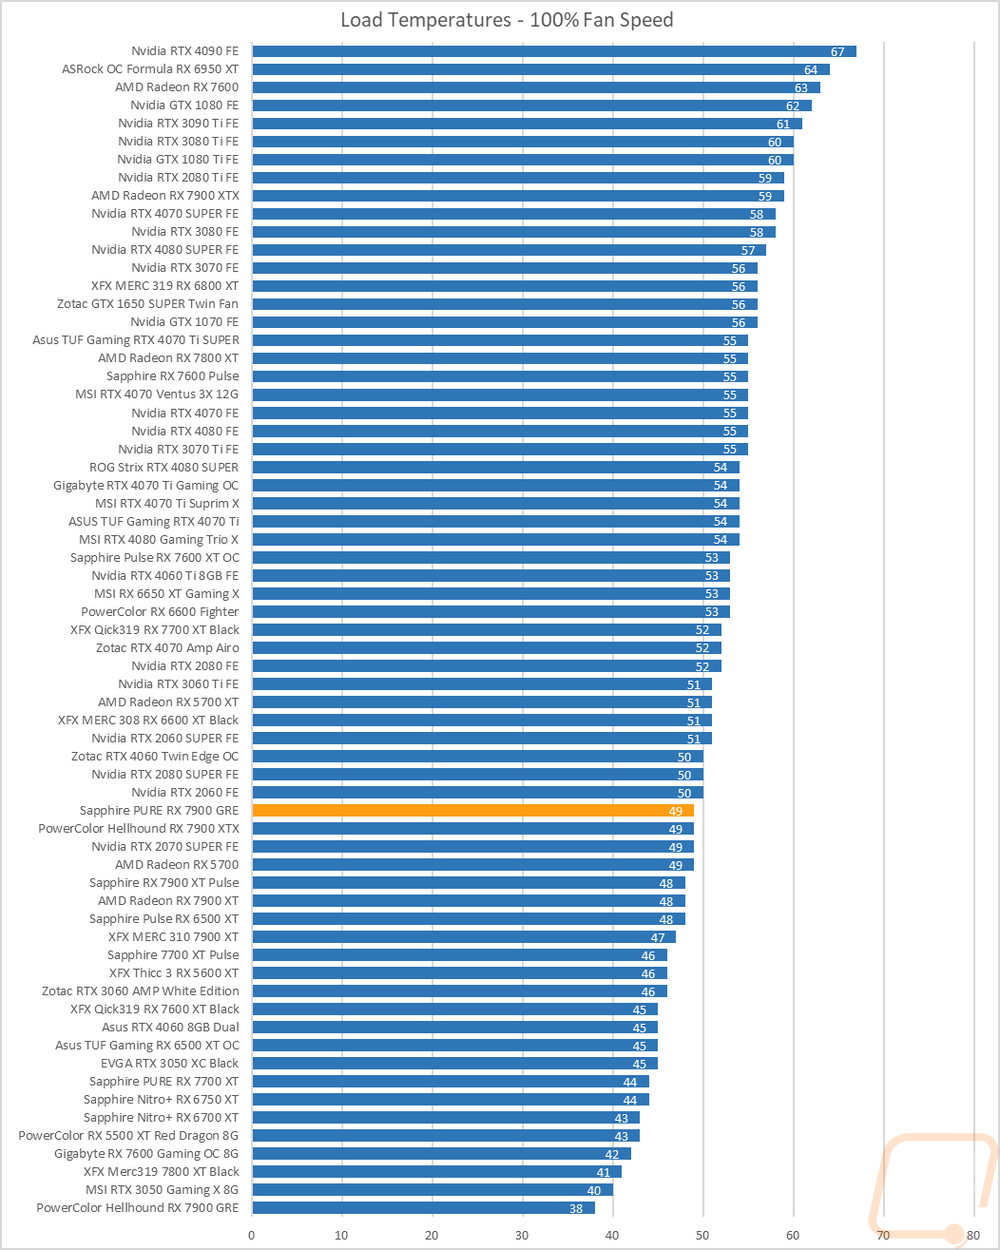
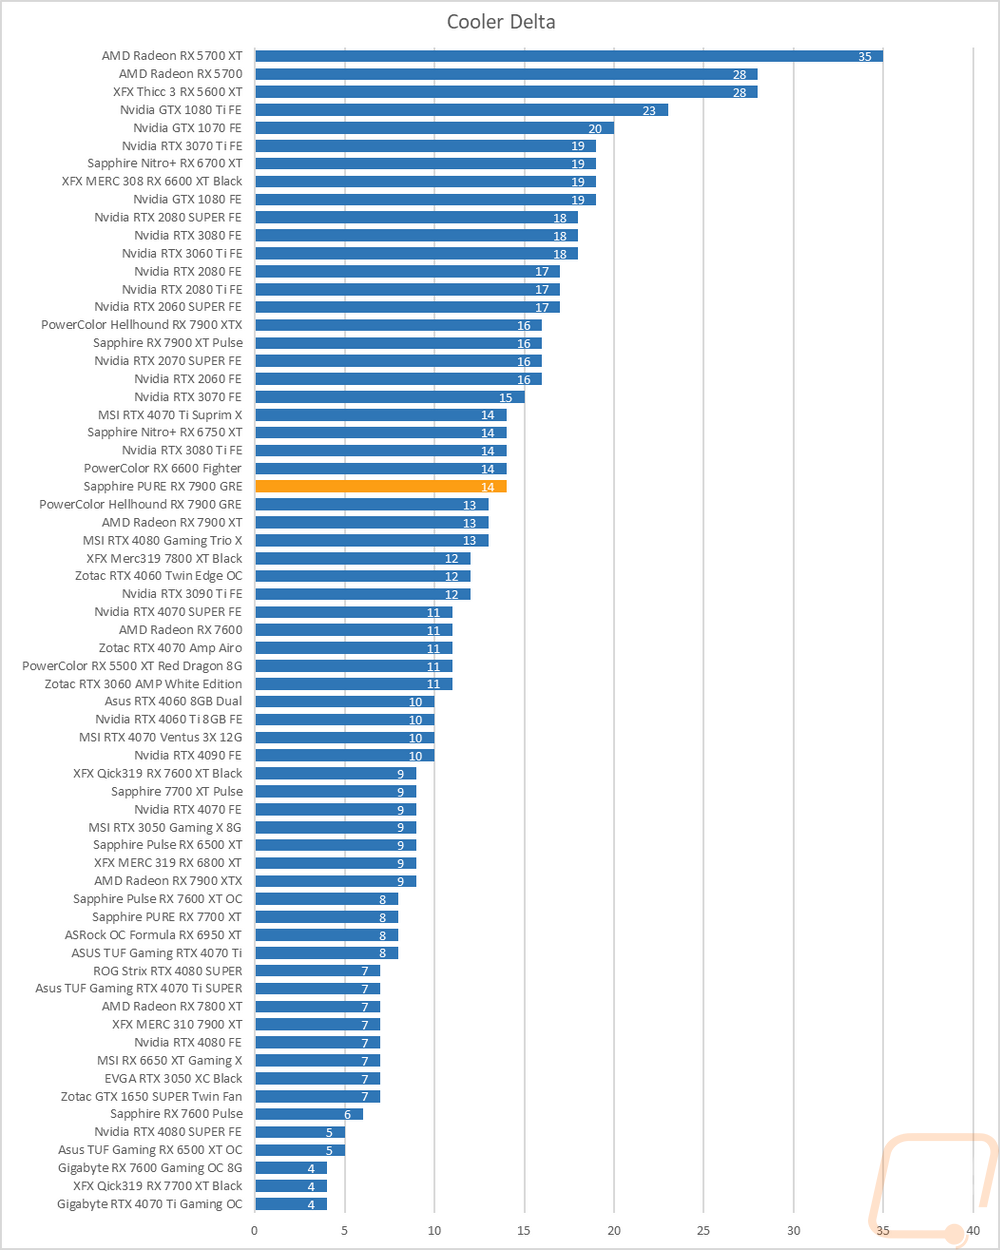
Then with the fans cranked up, the PURE RX 7900 GRE ran significantly cooler at 49c. This put the delta between the stock fan profile and 100% fan speed at 14c which is a little higher than average. That isn’t a big surprise though, we saw that they were soft on their stock fan profile to tune it better for noise performance but if you need the extra cooling the cooling is there. This really shows just how overkill this same cooler was on the RX 7700 XT PURE.
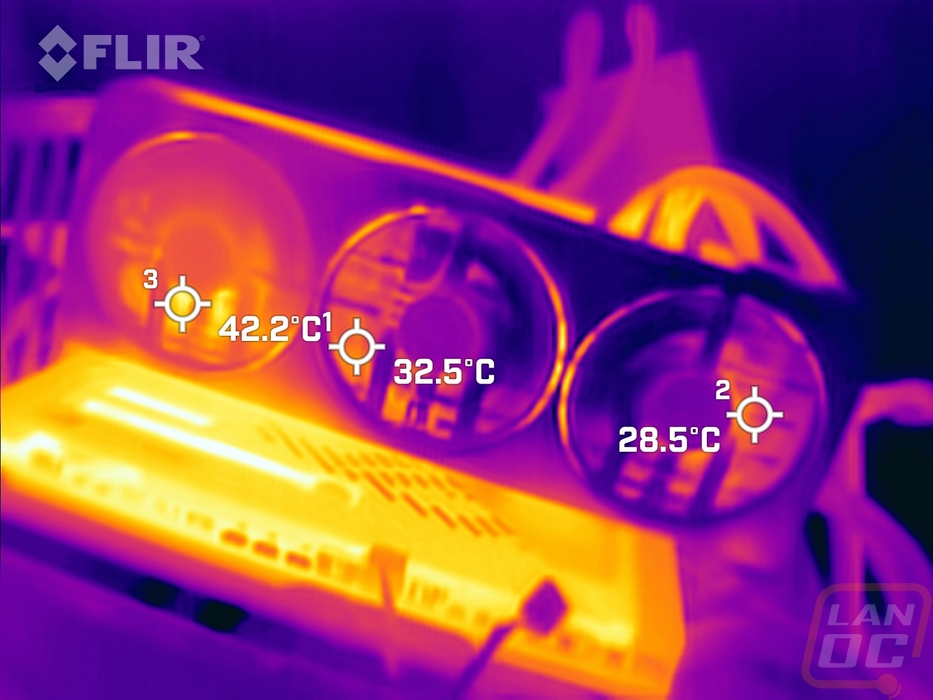
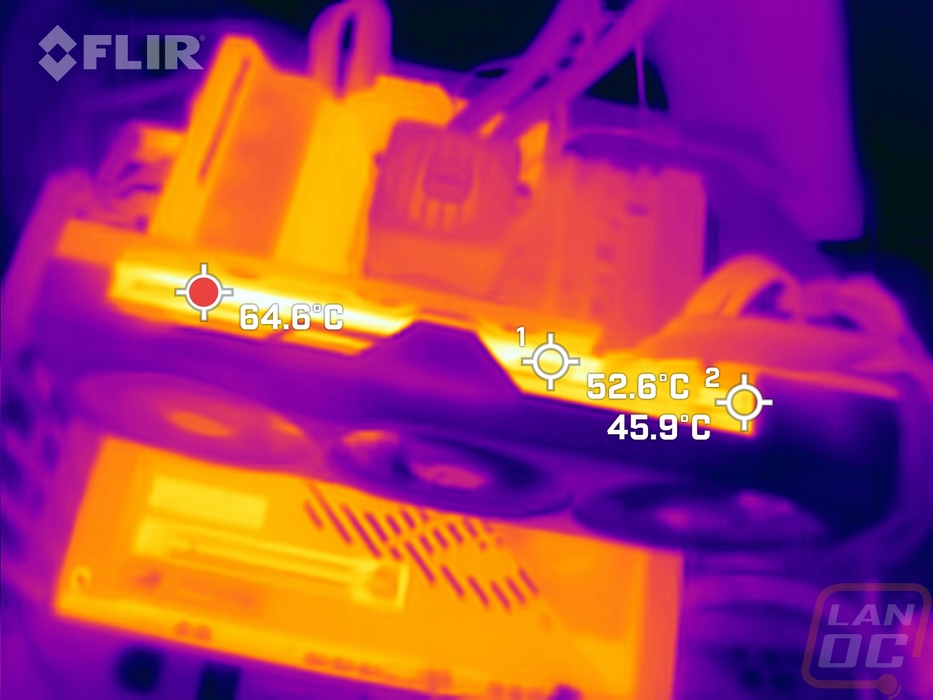
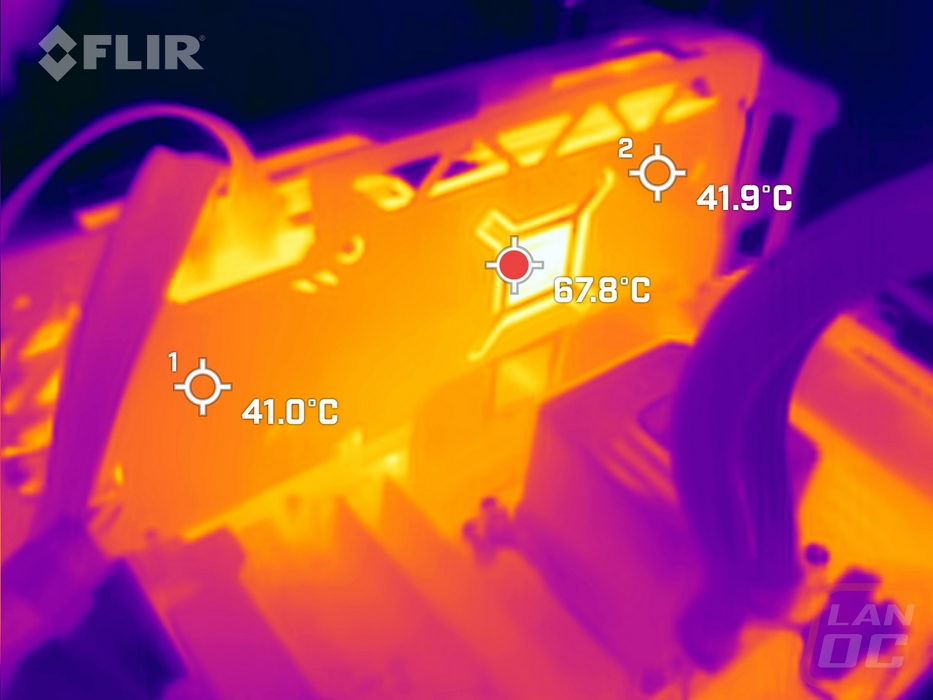
While running the stock fan profile testing I also took the time to get a few thermal images so we could see what is going on. The fan side of the PURE RX 7900 GRE is a lot warmer on the left side, especially at the bottom of the first fan. Over on the right side, the blow-through area has things running nice and cool at 28.5c. Of course with the cooler design pushing air out of the top and bottom edge of the card, we can see the top is a lot farther than the front, especially in the spots where you can see the PCB which is up to 64.6c here. But the hottest spot is the exposed PCB directly behind the GPU at 67.8c. The rest of the metal backplate is warm but consistent with both readings in the 41c range on either end of the card so it is pulling heat out and across the back.