Synthetic Benchmarks
As always I like to start my testing with a few synthetic benchmarks. 3DMark especially is one of my favorites because it is very optimized in both Nvidia and AMD drivers. It's nice to not have to worry about it being favored too much either way and the repeatability of the results makes it a nice chance to compare from card to card, especially when comparing with the same GPU. For the PURE RX 7900 GRE, we have already taken a look at one RX 7900 GRE so I will be keeping an eye on how those compare, the PURE RX 7900 GRE does have a lower clock speed on base and boost clocks so with that in mind I wouldn’t expect it outperform the Hellhound but we will see. Beyond that, I want to keep an eye on how the PURE RX 7900 GRE compares to Nvidia’s RTX 4070 SUPER and the RTX 4070 Ti / Ti SUPER.
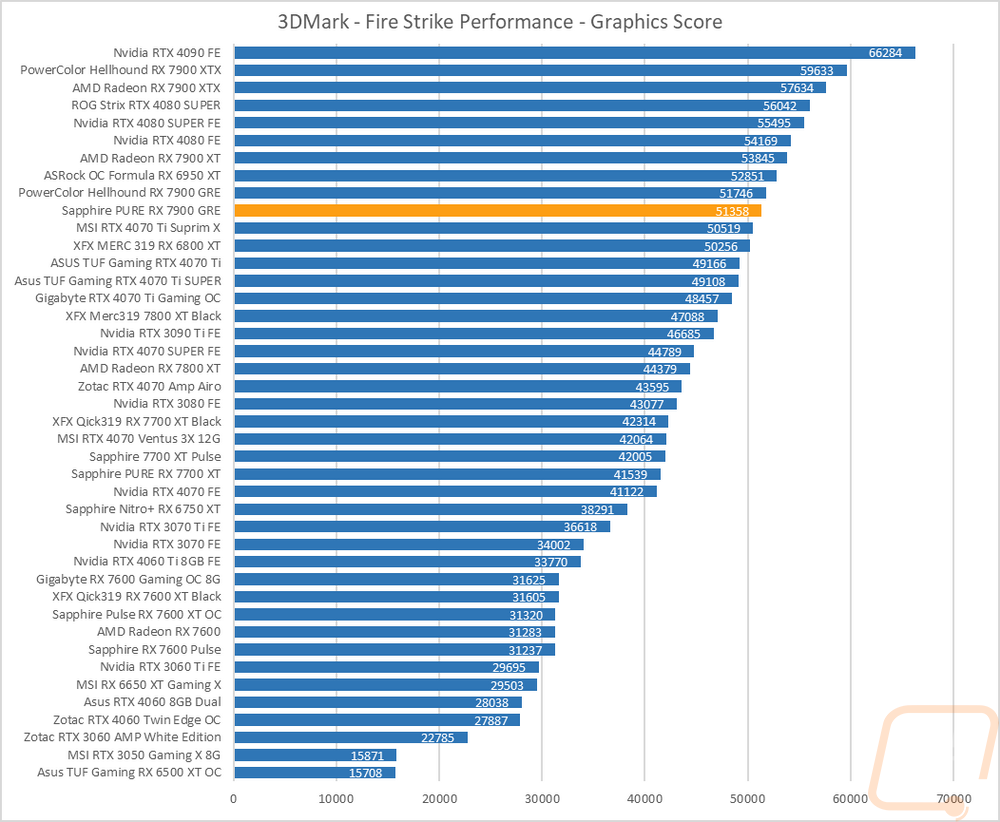
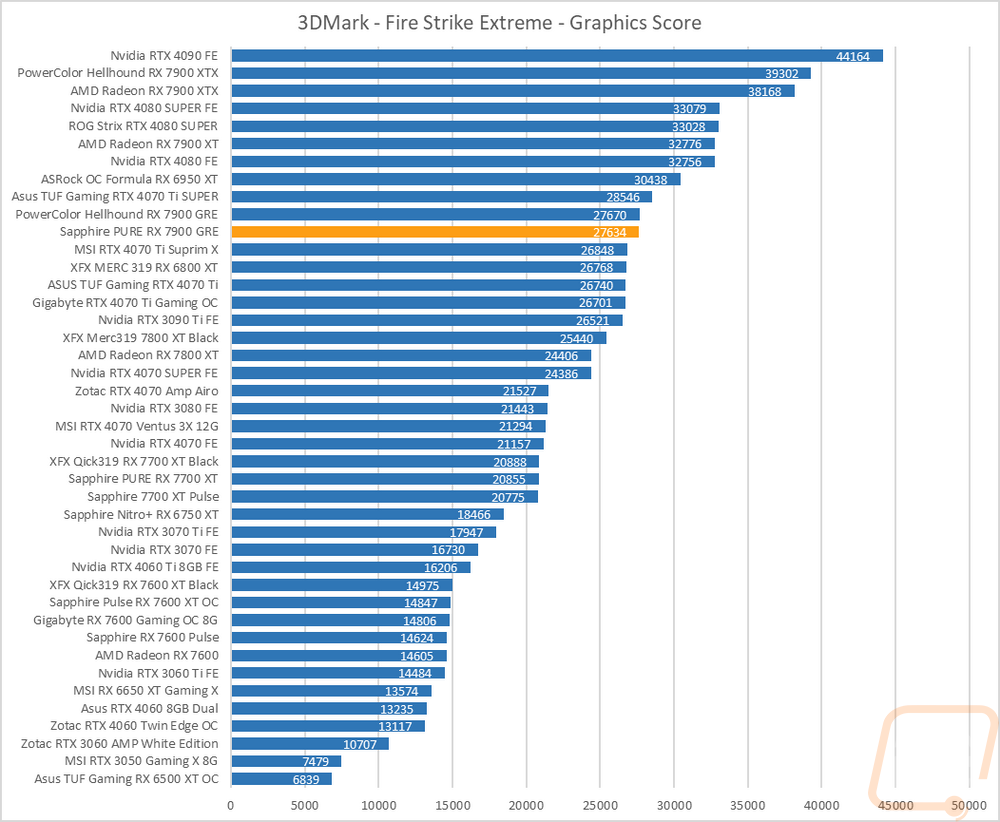
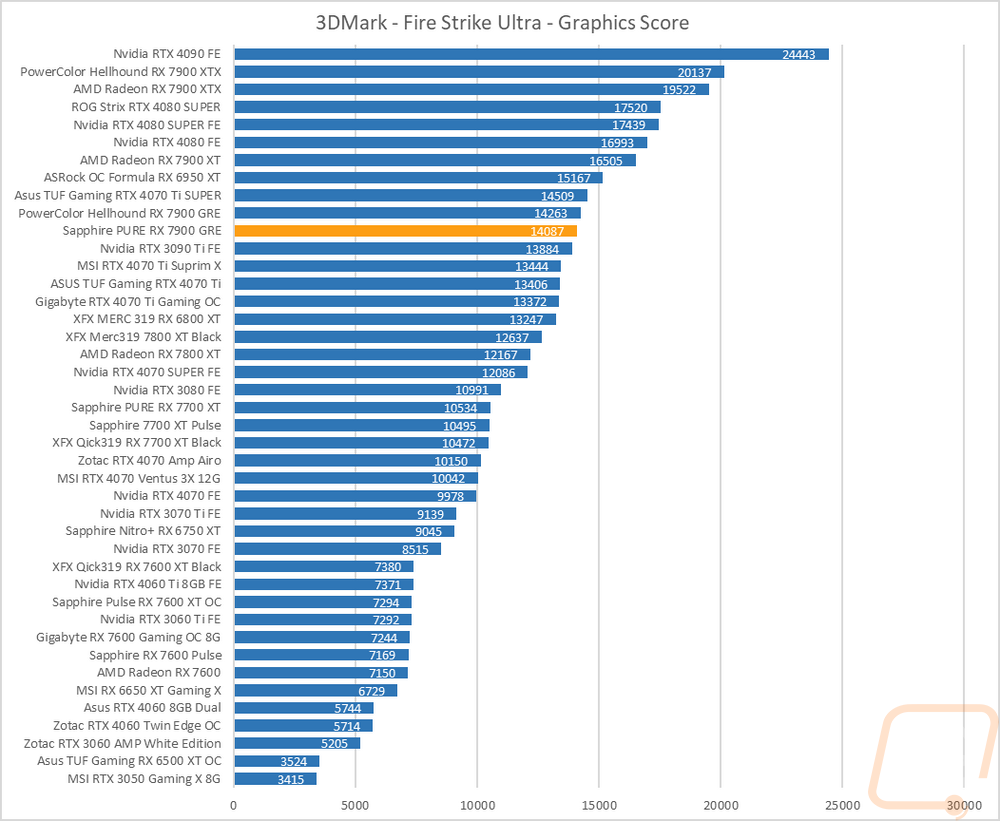
The first round of tests were done in the older Fire Strike benchmark which is a DX11 test. There are three detail levels, performance, extreme, and ultra. The PURE RX 7900 GRE scored a 51358 in base Fire Strike which was down from the 51746 of the Hellhound 7900 GRE. The two cards are much closer together on the Fire Strike Extreme test with both sitting behind the 4070 Ti SUPER and ahead of the older RTX 4070 Ti. The same goes for the Fire Strike Ultra test. The Hellhound is still out ahead of the PURE RX 7900 GRE but both cards are sitting behind the RTX 4070 Ti SUPER here and in front of the 4070 Ti as well as the 3090 Ti.
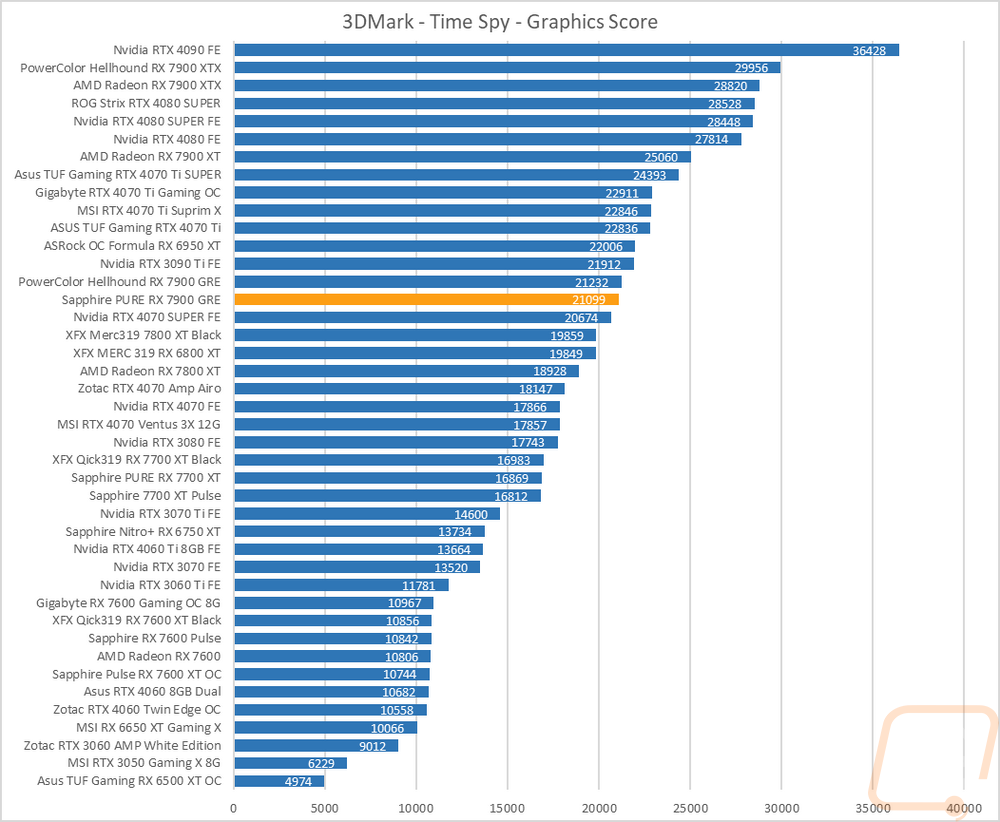
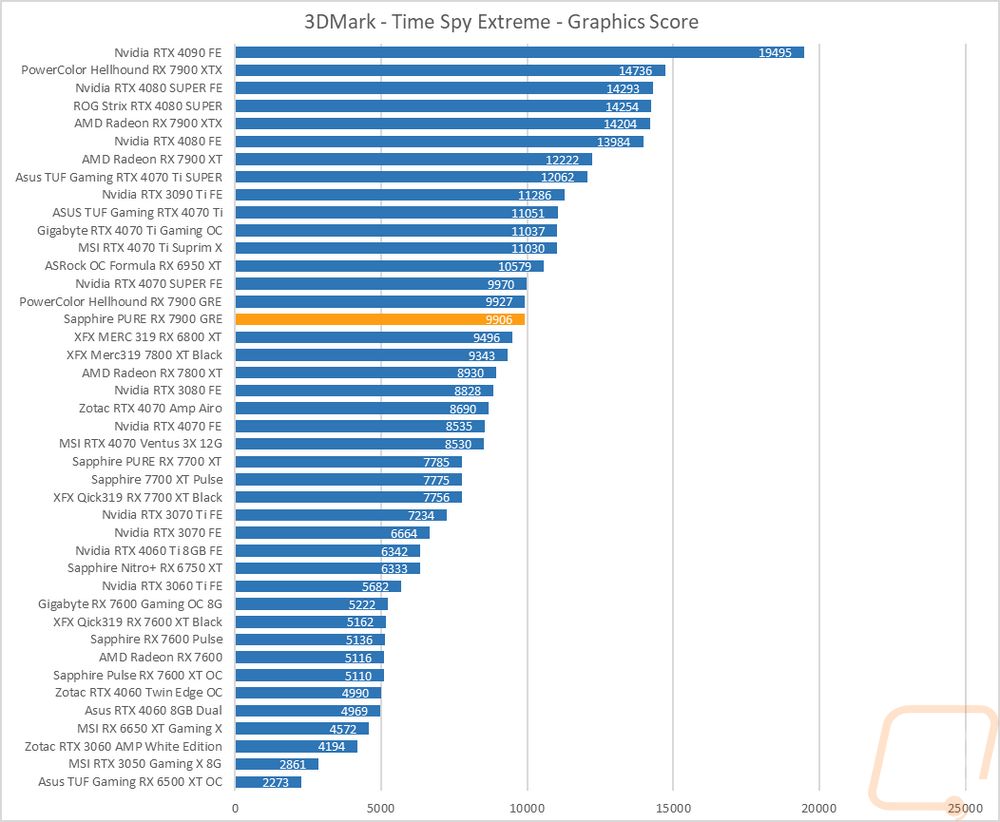
The next two were both based on the Time Spy benchmark. One is the standard test and then there is the extreme detail level. For Time Spy the PURE RX 7900 GRE scored a 21099 and is sitting just behind the Hellhound 7900 GRE which has a larger overclock. Both cards have a gap between them and the RTX 4070 SUPER and are then behind the 3090 Ti, 6950 XT, and the 4070 Ti. In Time Spy the RTX 4070 SUPER gains more of an edge and is just in front of both cards.
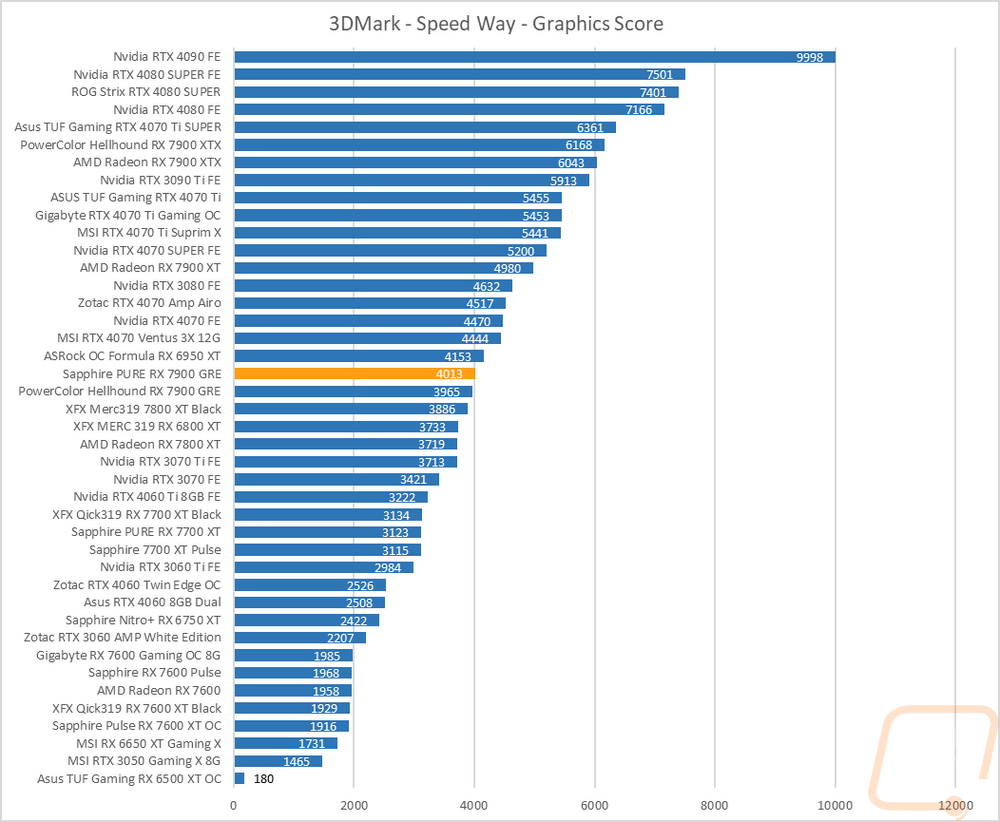
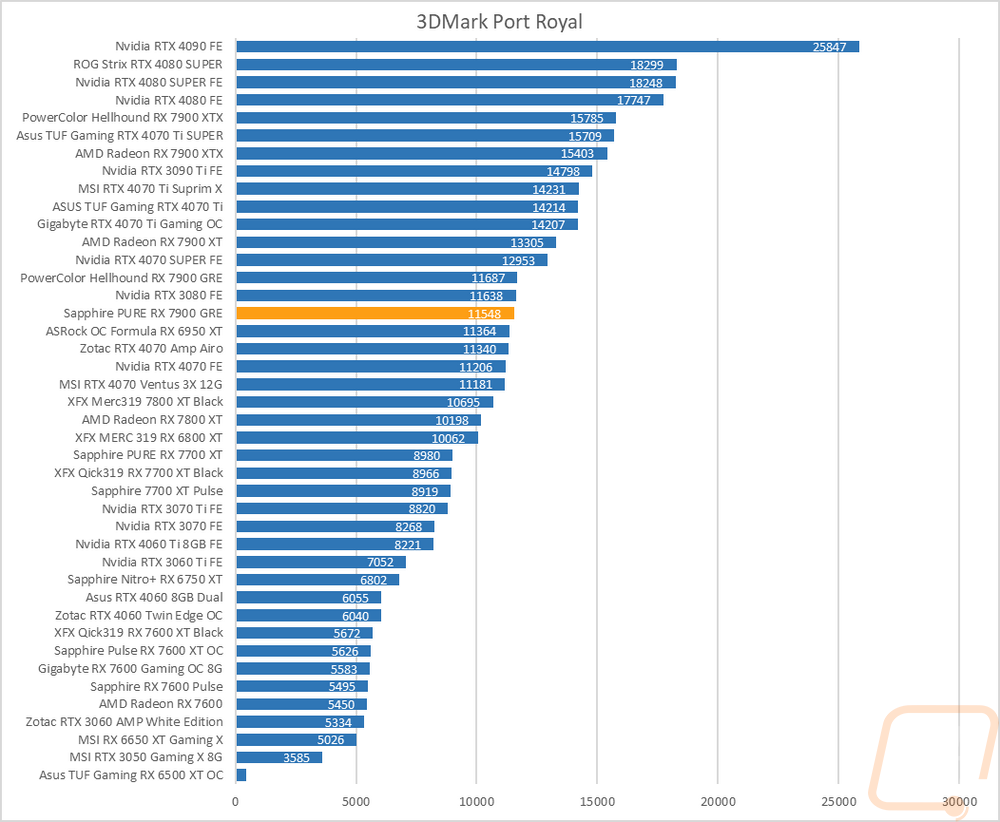
For ray tracing performance, I ran both the 3DMark Port Royal test which is ray tracing focused as well as the new 3DMark Speed Way test which tests all future-looking features including ray tracing. In Speed Way, the PURE RX 7900 GRE scored a 4013 and edged out in front of the Hellhound which was a surprise. Both card are still close together and sitting surprisingly close to the 7800 XT results and when we bring Nvidia into the mix they are behind the RTX 4070, let alone the 4070 SUPER. In Port Royal, the PURE RX 7900 GRE is behind the Hellhound and that was enough of a gap to drop down below the RTX 3080.
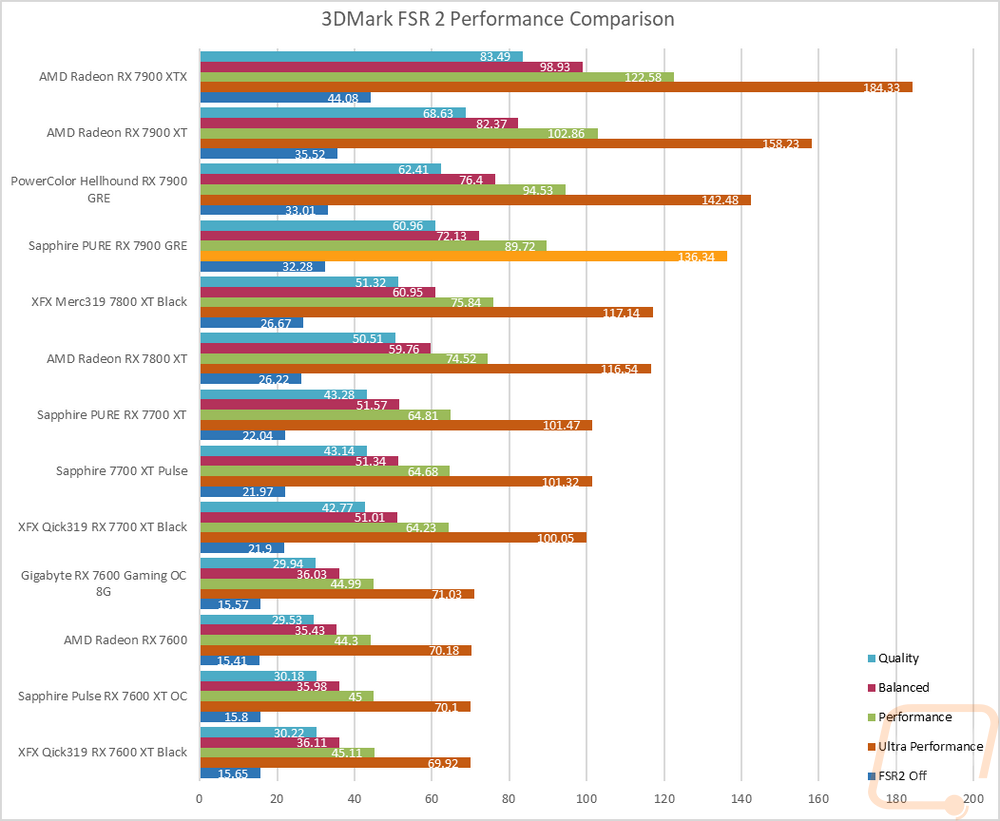
While testing in 3DMark I did also run the FSR2 benchmarks to get a look at how the PURE RX 7900 GRE performed with and without FSR2 and across different detail levels showing the best case scenario for performance improvement. The PURE RX 7900 GRE had a larger gap here than I expected when compared to the Hellhound but what I this test for was mostly to see the different improvements depending on detail settings. The PURE RX 7900 GRE ran at 32 FPS without FSR2 and jumped up to 51 FPS on the highest quality setting. Balanced and Performance jumped up to 60 and then 75 FPS. But Ultra Performance was the most impressive at 136 FPS, over 100 FPS higher than the original result without FSR2.
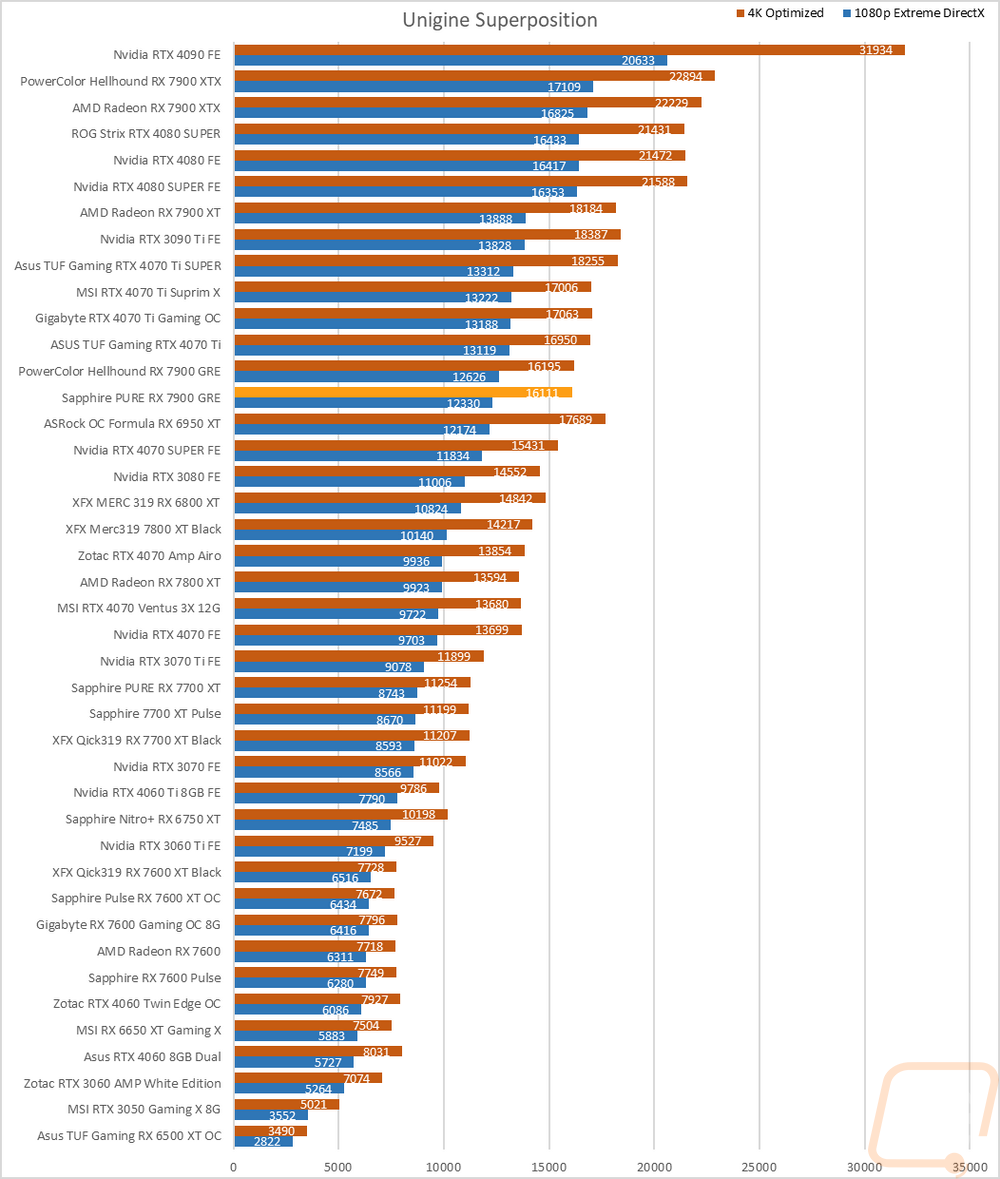
The last test was using the Unigine-based Superposition benchmark and I tested at 1080p with the extreme detail setting as well as the 4K optimized setting. In the extreme detail 1080p setting the PURE RX 7900 GRE scored a 12330 which was 296 points down from the Hellhound. Both cards are out ahead of the 4070 SUPER and the RX 6950 XT but behind the RTX 4070 Ti here. With the lower memory bus of the GRE, both cards are a little lower than the 6950 XT below them on the 4K test.