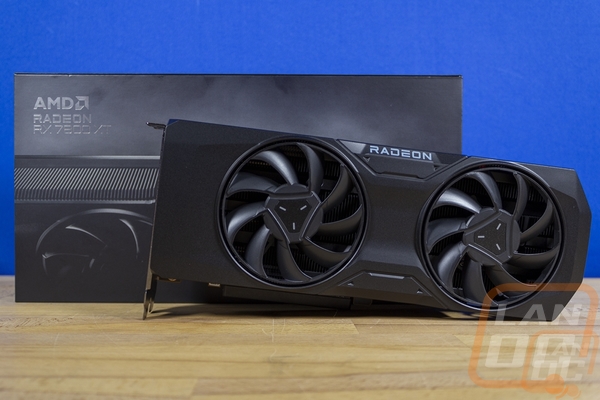
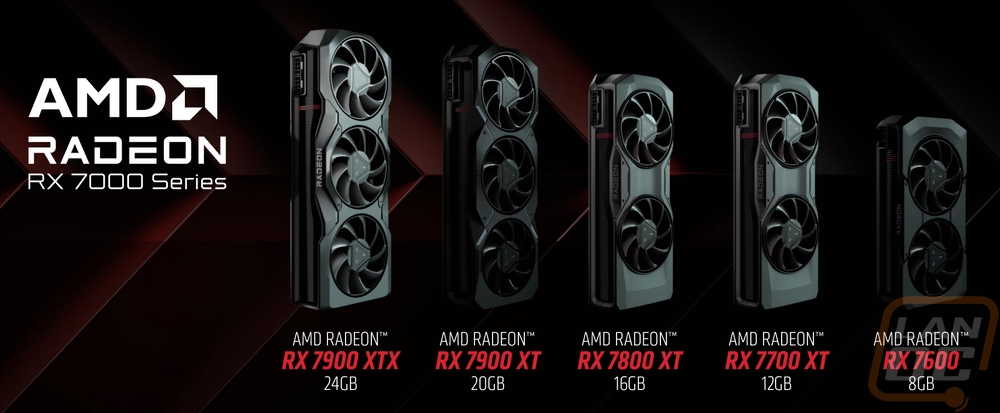
AMD launched their first 7000 Series cards back in December with the RX 7900 XT and RX 7900 XTX. They have also launched the lower end of their 7000 Series with the RX 7600 but the middle of the lineup has been completely missing until now. At Gamescom, AMD announced both the Radeon RX 7800 XT and RX 7700 XT to fill in some of the middle of the lineup with a focus on 1440p performance. Today I’m going to check out a few options from both GPUs but to start things off I am going to check out the Radeon RX 7800 XT reference card to get a look at the base performance the 7800 XT is capable of then we can go from there.
Product Name: AMD Radeon RX 7800 XT
Review Sample Provided by: AMD
Written by: Wes Compton
Amazon Affiliate Link: HERE
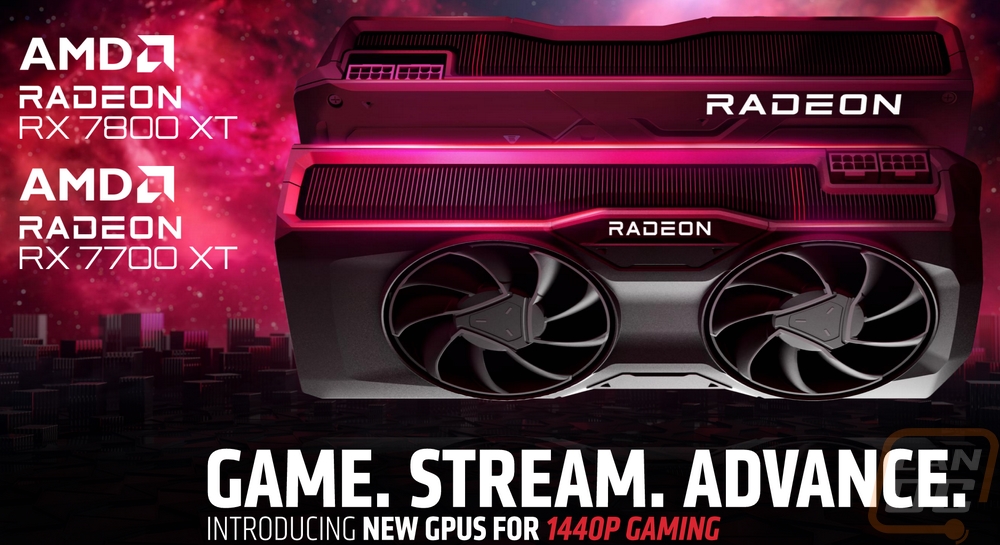
AMDs new RX 7700 XT and 7800 XT
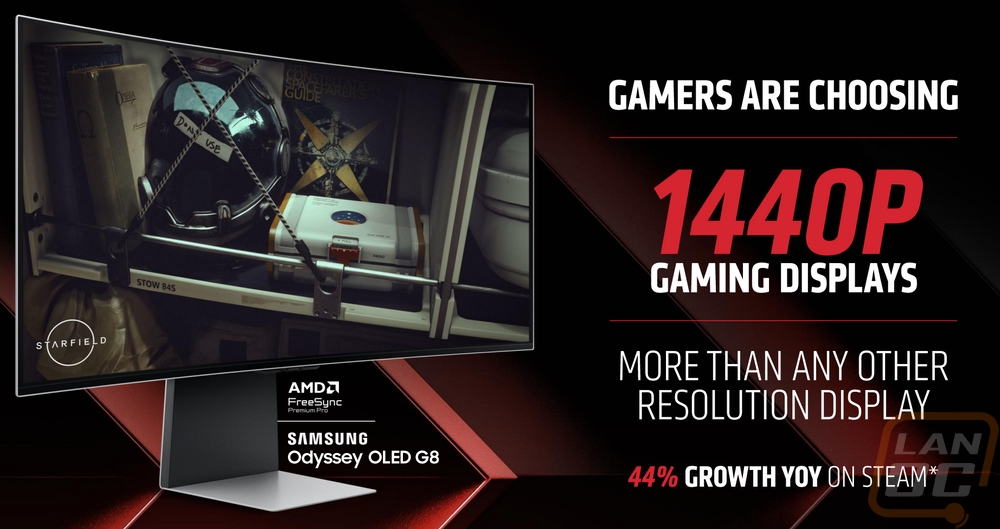
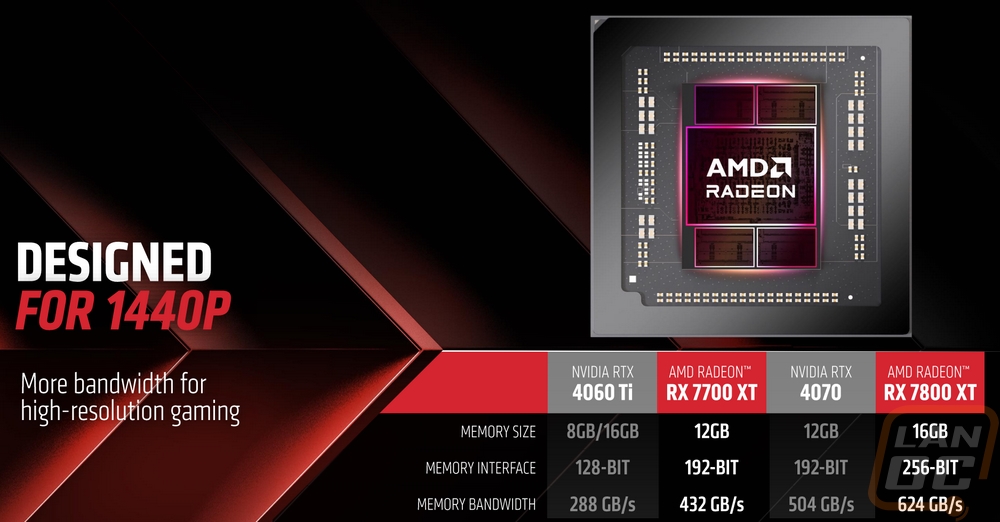
At Gamescom this year AMD announced two new GPUs to fill in a few big gaps in their current 7000 Series GPU lineup. Before the announcement, they had the RX 7600, RX 7900 XT, and RX 7900 XTX. That covered the higher end of the market with their 4K focused cards and the 7600 which is a mid-range 1080p focused card. The two new models fit in the middle with a 1440p resolution focus. While 1080p is still the most widely used resolution on Steam hardware surveys, the 1440p resolution is growing quickly, AMD highlighted this in the presentation pointing out a 44% growth year on year on the Steam hardware survey.
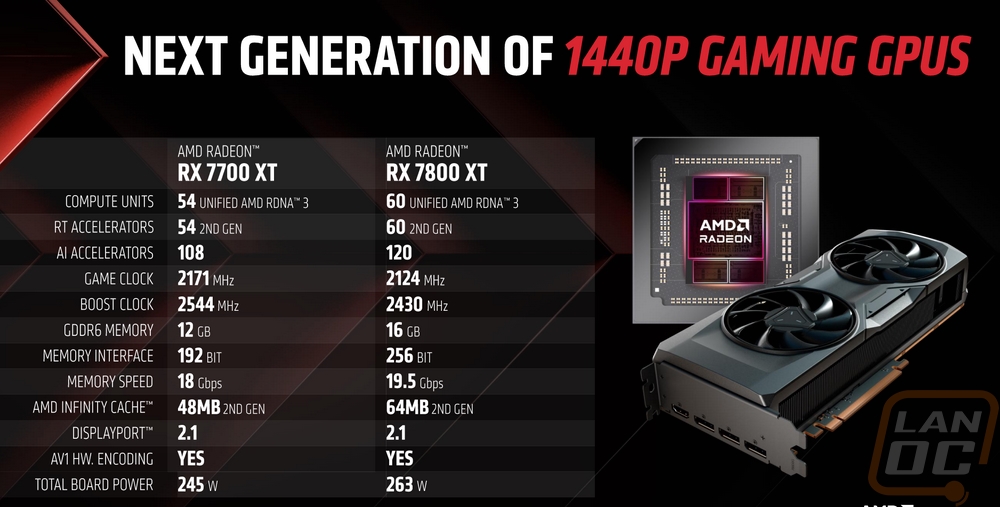
To get a look at where the new RX 7700 XT and RX 7800 XT sit spec wise I have the specs from the AMD briefing as well as a full breakdown that includes the RX 7600 and RX 7900 XT which for the 7000 Series sit above and below the two cards as well as the RX 6700 XT and RX 6800 which are the comparable cards from last generation. Both the 7700 XT and the 7800 XT have the same 5nm and 6nm combination of manufacturing process that the 7900 XT has. The two GPUs have the same die size and transistor count with them sharing the same base GPU but the compute units and the stream processor counts show us that it has been cut down slightly for the 7700 XT compared to the 7800 XT. The 7800 XT is right with the 6800 in stream processors as well as compute units and ray accelerators but last generation's cards didn’t have the AI accelerators which the 7800 XT has 120 and the 7700 XT has 108. The 7800 XT has a slightly lower game GPU clock than the 7700 XT with it at 2124 MHz to 2171 MHz on the 7700 XT. The same goes for the boost clock which the 7800 XT can see up to 2430 MHz whereas the 7700 XT can do up to 2544 MHz. The single precision performance numbers give us an idea of what the lower clock speeds but higher core counts translate to. The 7700 XT can do up to 35 TFLOPS whereas the 7800 XT is slightly higher at 37 TFLOPS. The 7900 XT is way out ahead of that at 51 TFLOPS and the 7600 is well below the two at 21 TFLOPS. Then both the 6700 XT and the 6800 are well below the 7600 at 13.21 TFLOPS and 16.17 TFLOPS.
The 7700 XT has 48 MB of the 2nd generation Infinity Cache whereas the 7800 XT has 64 MB. Then for memory, the 7700 XT has 12GB of GDDR6 memory to the 16GB on the 7800 XT. They also have different memory bus interfaces with a 192-bit interface for the 7700 XT and 256-bit for the 7800 XT and the memory on the 7800 XT is also clocked faster with it running at 19.5 Gbps and 18 Gbps for the 7700 XT. Overall the higher cache and everything else translates to the 7700 XT having an effective memory bandwidth of 1995.3 GB/s to the 2708.4 GB/s for the 7800 XT. Both cards have a traditional PCIe 4.0 x16 interface, not the x8 that the RX 7600 had. Then for power, the two cards do have different total board power ratings with the 7700 XT at 245 watts and the 7800 XT at 263 watts. AMD also announced the base pricing of the cards at Gamescom with the RX 7700 XT at $449 and the RX 7800 XT at $499. The 7800 XT is available in a reference design directly from AMD as well as designs from their partners but the 7700 XT doesn’t have a reference design and will only be available with the partner designs.
|
Specifications |
RX 7600 |
RX 6700 XT |
RX 7700 XT |
RX 6800 |
RX 7800 XT |
RX 7900 XT |
|
Architecture |
RDNA 3 |
RDNA 2 |
RDNA 3 |
RDNA 2 |
RDNA 3 |
RDNA 3 |
|
Manufacturing Process |
6nm |
7nm |
5nm GCD + 6nm MCD |
7nm |
5nm GCD + 6nm MCD |
5nm GCD + 6nm MCD |
|
Transistor Count |
13.3 Billion |
17.2 Billion |
28.1 Billion |
26.8 Billion |
28.1 Billion |
57.7 Billion |
|
Dia Size |
204 mm² |
335 mm² |
200mm² GCD 150mm² MCD |
520 mm² |
200mm² GCD 150mm² MCD |
529 mm² |
|
Compute Units |
32 |
40 |
54 |
60 |
60 |
84 |
|
Ray Accelerators |
32 |
40 |
54 |
60 |
60 |
84 |
|
AI Accelerators |
64 |
-- |
108 |
-- |
120 |
168 |
|
Stream Processors |
2048 |
2560 |
3456 |
3840 |
3840 |
5376 |
|
Game GPU Clock |
2250 MHz |
2424 MHz |
2171 MHZ |
1815 MHZ |
2124 MHz |
2025 MHz |
|
Boost GPU Clock |
Up to 2655 MHz |
Up to 2581 MHz |
Up to 2544 MHz |
Up to 2105 MHz |
Up to 2430 MHz |
Up to 2394 MHz |
|
Peak Single Precision Perf. |
Up to 21 TFLOPS |
Up to 13.21 TFLOPS |
Up to 35 TFLOPS |
Up to 16.17 TFLOPS |
Up to 37 TFLOPS |
Up to 51 TFLOPS |
|
Peak Half Precision Perf. |
Up to 43 TFLOPS |
Up to 26.43 TFLOPS |
Up to 70 TFLOPS |
Up to 32.33 TFLOPS |
Up to 74 TFLOPS |
Up to 103 TFLOPS |
|
Peak Texture Fill-Rate |
Up to 339 GT/s |
Up to 413 GT/s |
Up to 550 GT/s |
Up to 505.2 GT/s |
Up to 583 GT/s |
Up to 804 GT/s |
|
ROPs |
64 |
64 |
96 |
64 |
96 |
192 |
|
Peak Pixel Fill-Rate |
Up to 169 GP/s |
Up to 165.2 GP/s |
Up to 244 GP/s |
Up to 202.1 GP/s |
Up to 233 GP/s |
Up to 459 GP/s |
|
AMD Infinity Cache |
32 MB (2nd Gen) |
96 MB (1st Gen) |
48 MB (2nd Gen) |
128 MB (1st Gen) |
64 MB (2nd Gen) |
80 MB (2nd Gen) |
|
Memory |
8GB GDDR6 |
12GB GDDR6 |
12GB GDDR6 |
16GB GDDR6 |
16GB GDDR6 |
20GB GDDR6 |
|
Memory Speed |
18 Gbps |
16 Gbps |
18 Gbps |
16 Gbps |
19.5 Gbps |
20 Gbps |
|
Effective Memory Bandwidth w/AMD Infinity Cache |
Up to 476.9 GB/s |
Up to 1278.0 GB/s |
Up to 1995.3 GB/s |
Up to 1664.2 GB/s |
Up to 2708.4 GB/s |
Up to 2900 GB/s |
|
Memory Bus Interface |
128-bit |
256*bit |
192-bit |
256-bit |
256-bit |
320-bit |
|
PCIe Interface |
PCIe 4.0 x8 |
PCIe 4.0 x16 |
PCIe 4.0 x16 |
PCIe 4.0 x16 |
PCIe 4.0 x16 |
PCIe 4.0 x16 |
|
Total Board Power |
165W |
230W |
245W |
250W |
263W |
300W |
|
Launch MSRP |
$269 |
$479 |
$449 |
$649 |
$499 |
$899 |
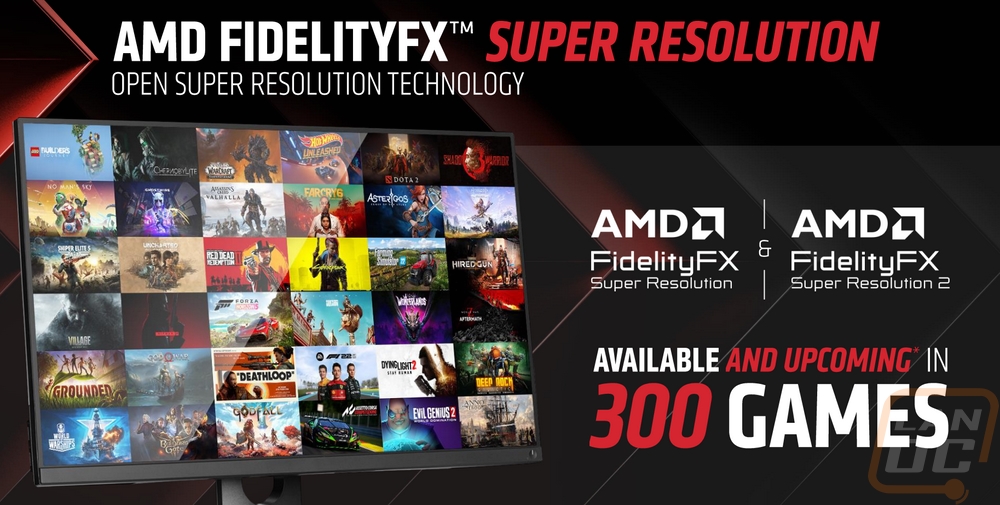
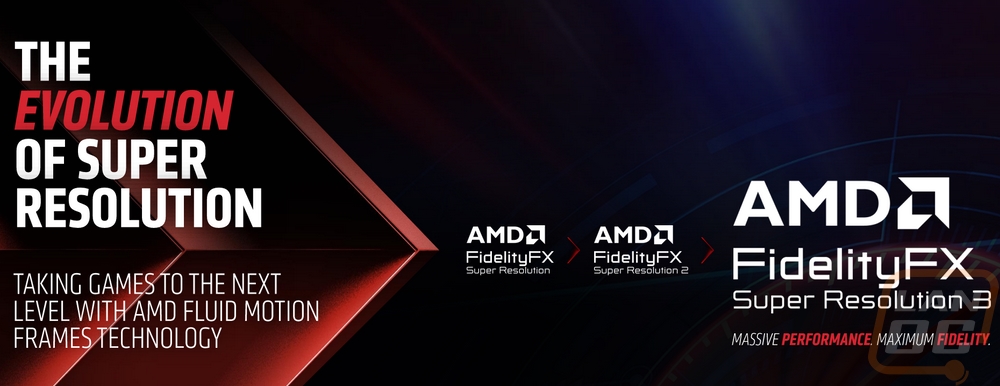
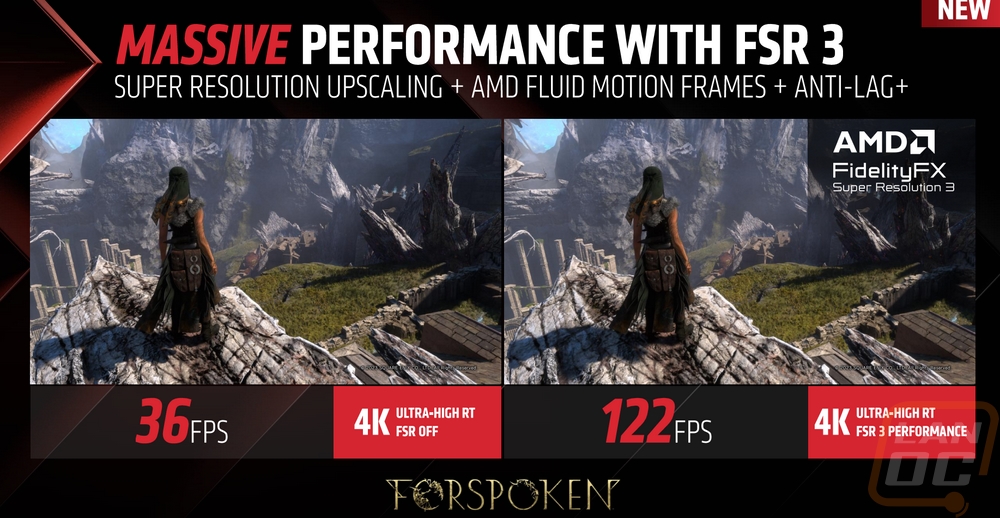
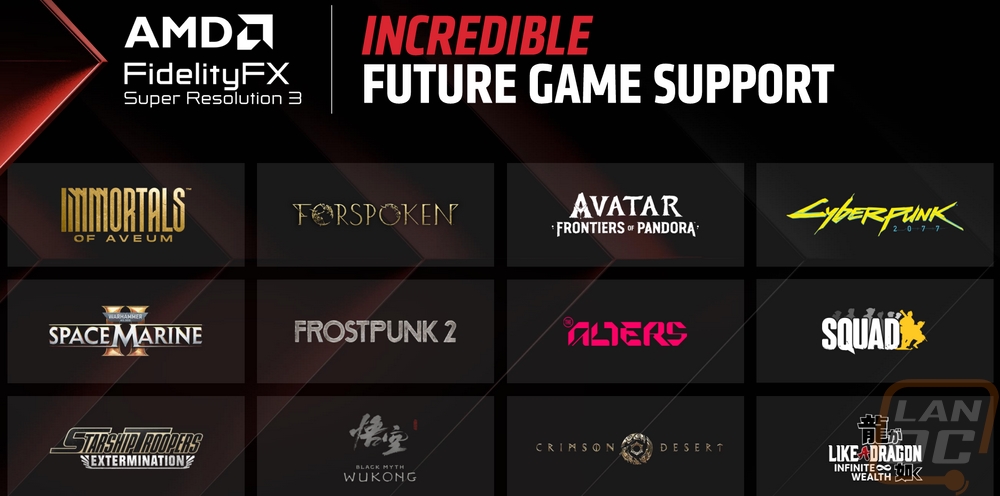
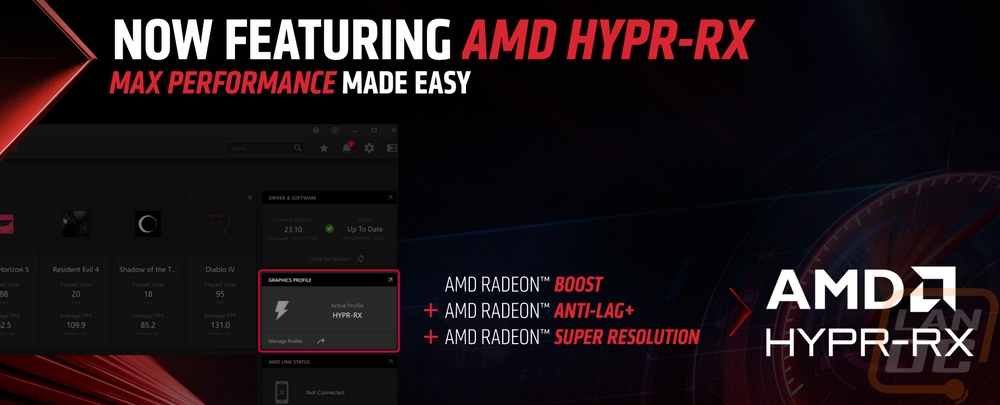
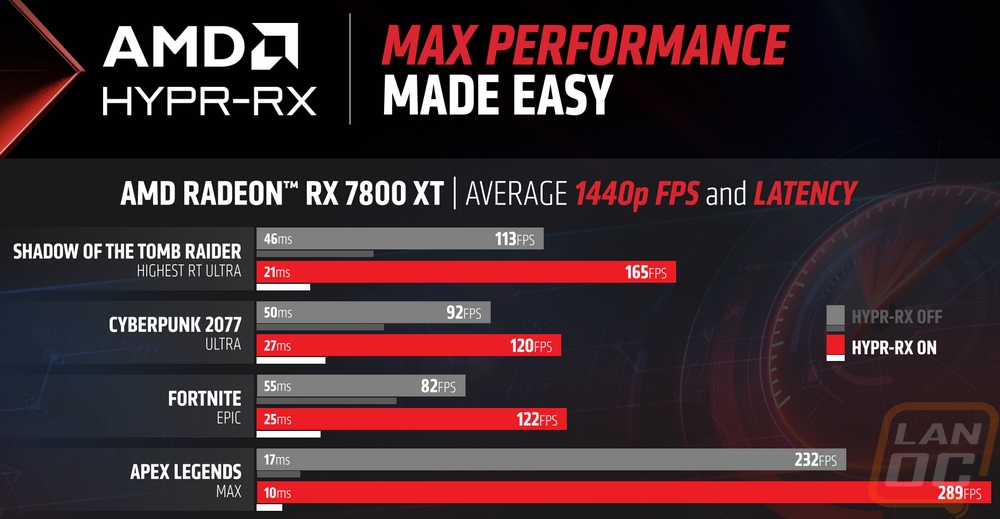
Alongside of the two new cards, AMD also announced their FidelityFX Super Resolution 3 which brings frame generation to AMD cards. Unlike DLSS from Nvidia AMD has this as an open standard so it can not only work with all of AMDs cards, but it can also work with Nvidia cards as well. FSP 3 with upscaling can work with AMD cards back to the RX 590 and Nvidia 10 Series cards but that doesn’t include frame generation. For that, you will need an AMD 5700 or better and RTX 20 Series or higher. They showed off the performance differences that you can see with Forspoken from Square Enix where they were able to go from 36 FPS up to 122 FPS at 4K by using FSR 3 performance mode. FSR 3 has a list of upcoming games and game support of course will make or break this as a feature. The performance is great, but if none of the games you play support It, well that doesn’t help at all. FSR and FSR 2 have 300 games with current or upcoming support so if that is any indication. They also have combined Radeon Boost, Anti-Lag+, and Super Resolution on the driver side into one feature they are calling Hyper-RX which helps make getting better performance easier, with that they showed off some performance improvements you can see with average FPS improving and latency dropping by big margins in all of the games shown.
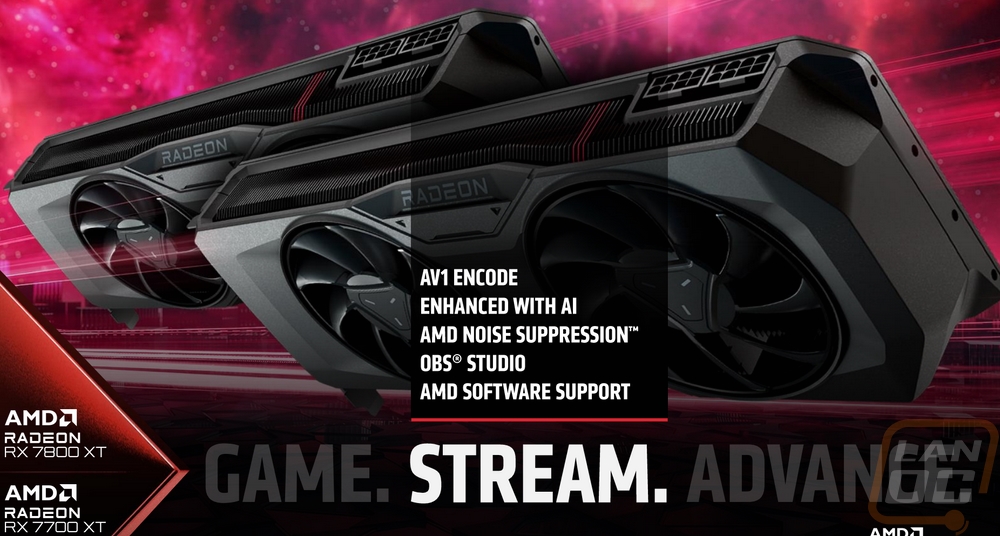
AMD also touched on the streaming capabilities as well on their call. Highlighting AV1 support which is the future of streaming. AV1 can get you higher quality while lowering the bandwidth needs. They also touched on AMDs noise suppression which can help cut out background noise from your microphone.
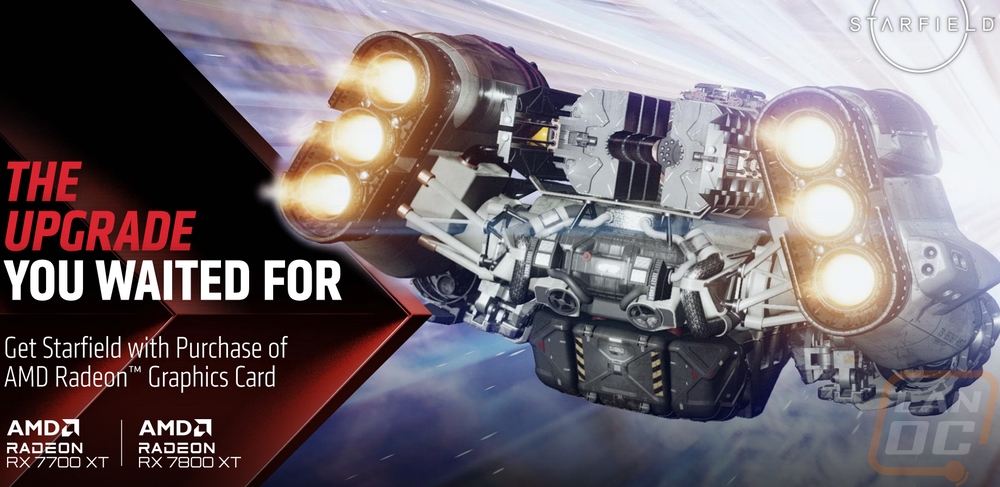
With the RX 7700 XT and RX 7800 XT hitting stores tomorrow September 6th, the cards are also timed to launch the same day as Starfield which utilizes AMDs technology. AMD is also offering a copy of the game to anyone who picks up the 7700 XT or the 7800 XT. This is a great way to add some value to the cards and also make sure everyone has access to a brand new game to check out how your new cards can perform.
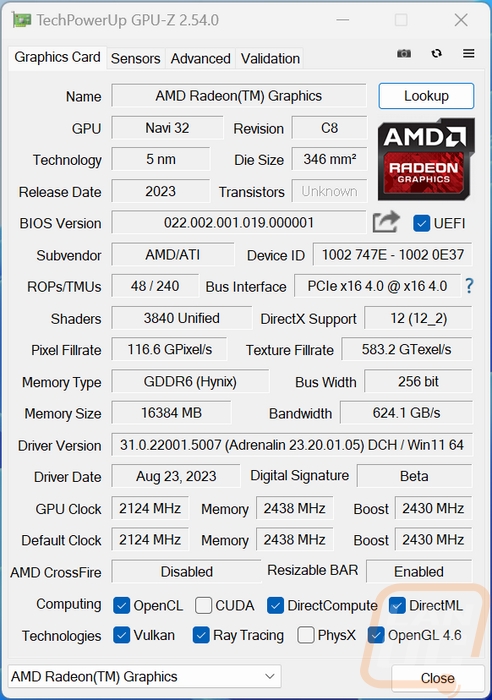
Before getting into testing I did also run GPUz to double-check that our clock speeds matched up with the specifications. The Radeon RX 7800 XT that I am checking out right now is AMDs reference design so it’s no surprise that it is sitting at the reference 2430 MHz for the boost clock and 2124 MHz for the default clock speed. This does also document the driver I tested on which is the Adrenalin 23.20.01.05 driver that AMD sent out ahead of the launch and it documents the BIOS revision as well.
Packaging
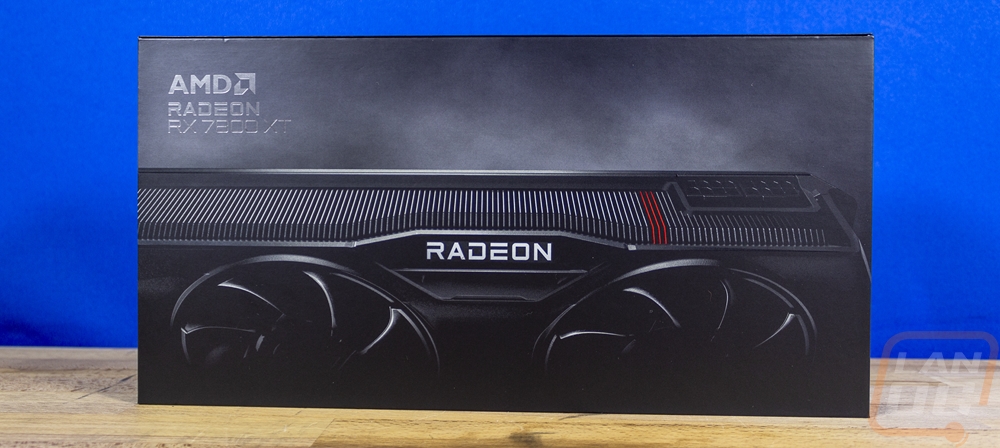
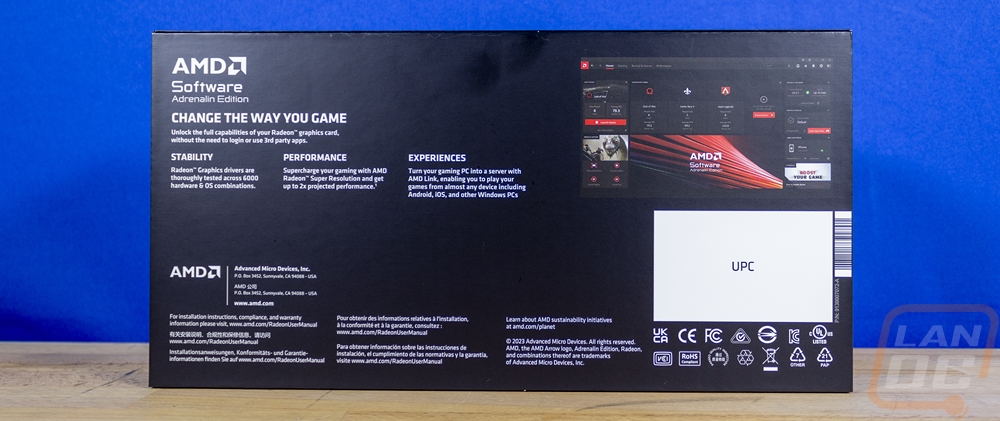
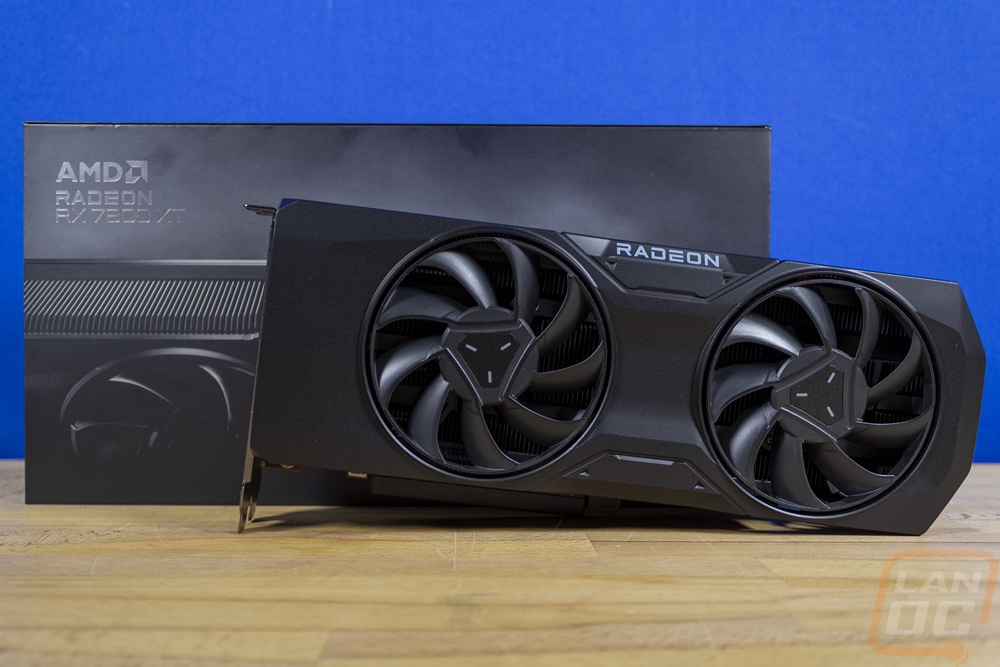
Because these cards are made and sold by AMD, the packaging doesn’t have to have the red wrap-around that all AMD cards normally have to keep all of the branding consistent. Without all of that, the packaging for the Radeon RX 7800 XT is very dark. Like with the 7600 and 7900 XT/XTX the front of the box has a black background with a haze floating in the air and a zoomed-in picture of the card across half of the box. This shows the dual fans, the exposed heatsink including the red accent, and the power connections up on top. It also shows off the Radeon branding on the card. Beyond that, the front of the box has the AMD Radeon RX 7800 XT branding in the top left corner with a metallic finish that blends in with the dark background. Then on the back, they do show off their software with a screenshot of that. The back has a large spot for a UPC sticker and has all of the required certification logos around it.
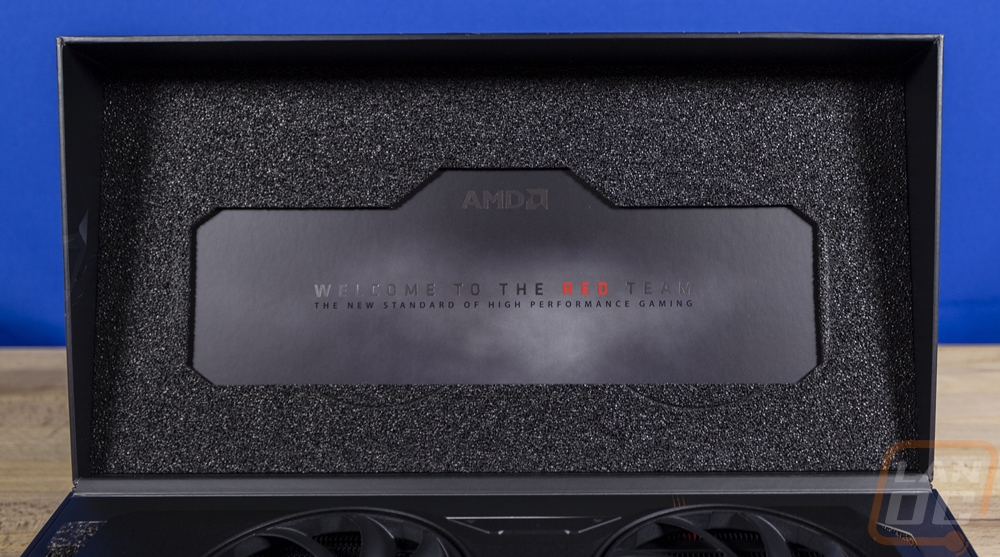
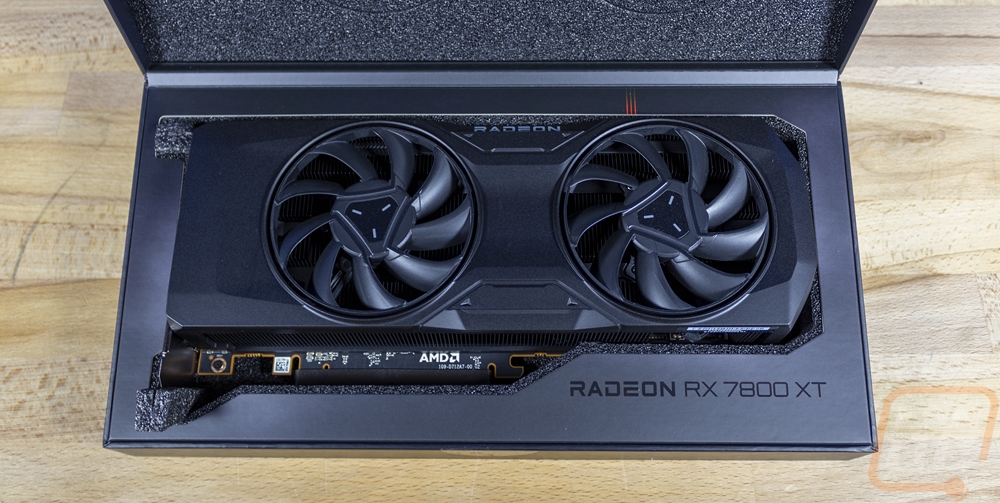
There is just one clear sticker that holds the box closed. Once you cut that the whole front of the box can lift up and right away you get a full view of the card. The underside of the top has a thin layer of foam with a cutout section in the middle that continues the black background and haze with a welcome to Team Red. The card itself has foam on the two parts of the PCI bracket that stick out and it comes sitting in a foam tray cut to fit the card and keep it from moving around. On top of the foam, they have a cover that continues the black/hazy background and has the Radeon RX 7800 XT branding once again. Unlike most partner cards AMD doesn’t have their card in a static protective bag and the box doesn’t have a second box inside. This is a little more premium, similar to how Nvidia handles their Founders Edition cards.
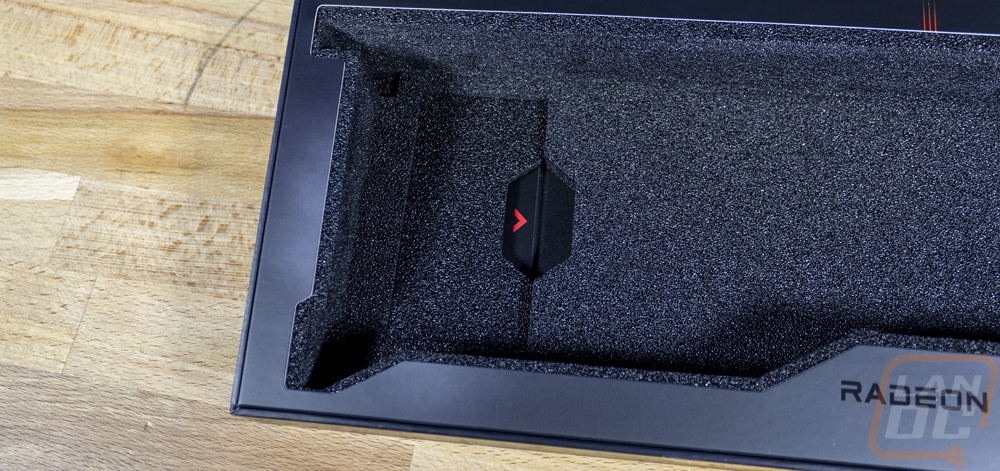
Once you pull the card out of the foam cutout there is a thin layer of foam under it and in that, there is a small piece that you can remove. This has the documentation inside. There aren’t any adapters or accessories needed or included. For the documentation, one has a QR code for the user manual with some legal information inside. The other is an invitation to Team Red.
Card Layout and Photos
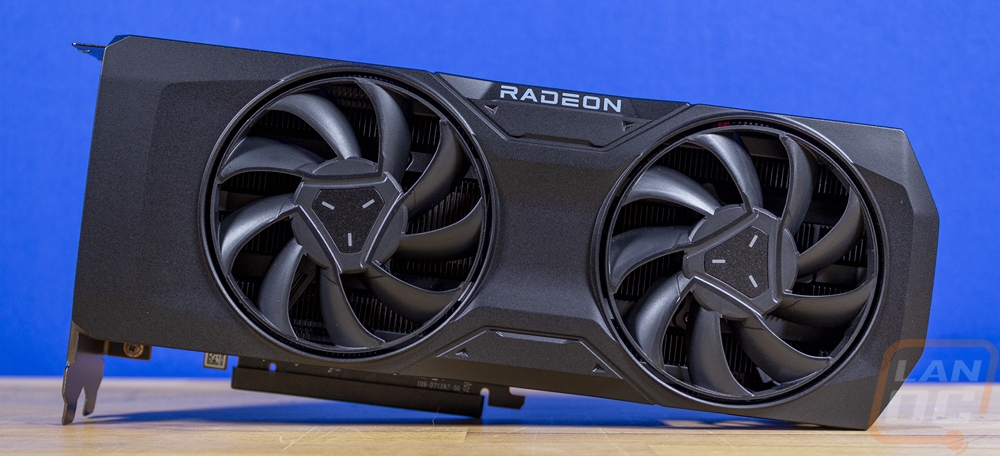
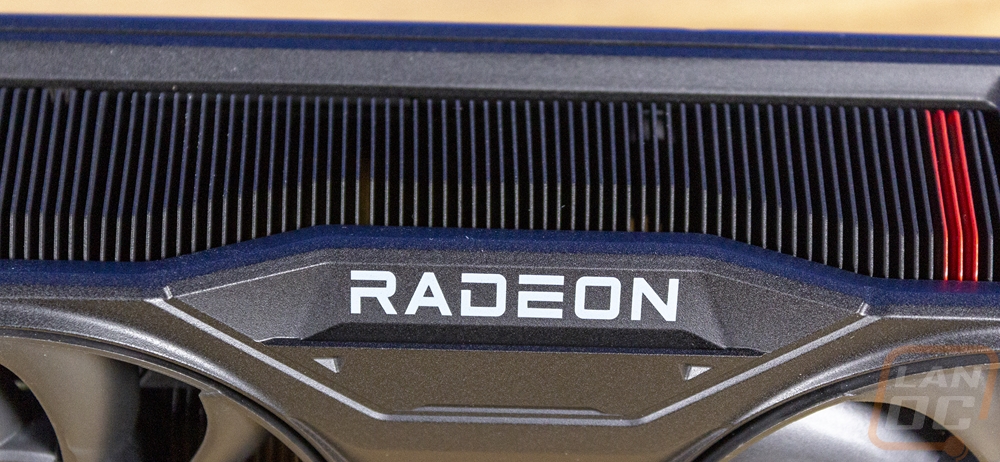
Like with the other 7000 Series reference cards from AMD, the Radeon RX 7800 XT has a blacked out all metal fan shroud that gives the cooler a stealth look. The AMDs design is extremely similar to the 7900 XT reference card with its styling and while the textured black finish on the metal shroud hides some of the shape a lot is going on including a scooped out shape down the center that starts to the left of the first fan and ends just before the end of the card. It also has matching accents in between the two fans at the top and bottom edge with the top accent also having the Radeon branding printed on it.
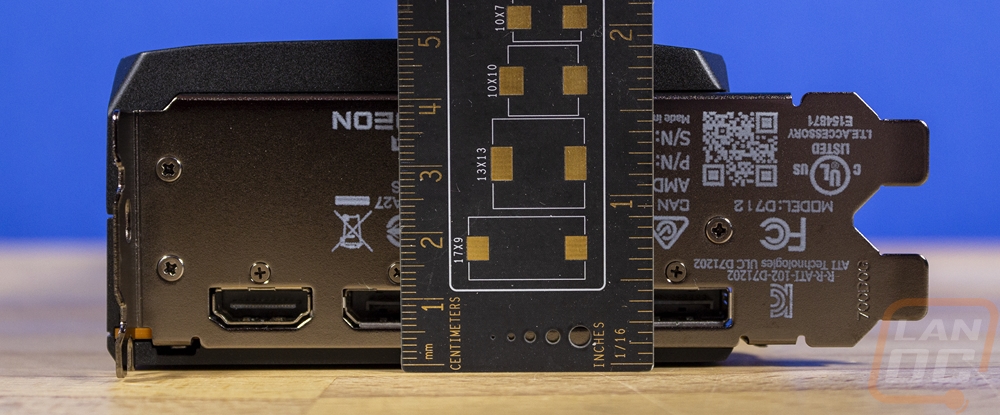
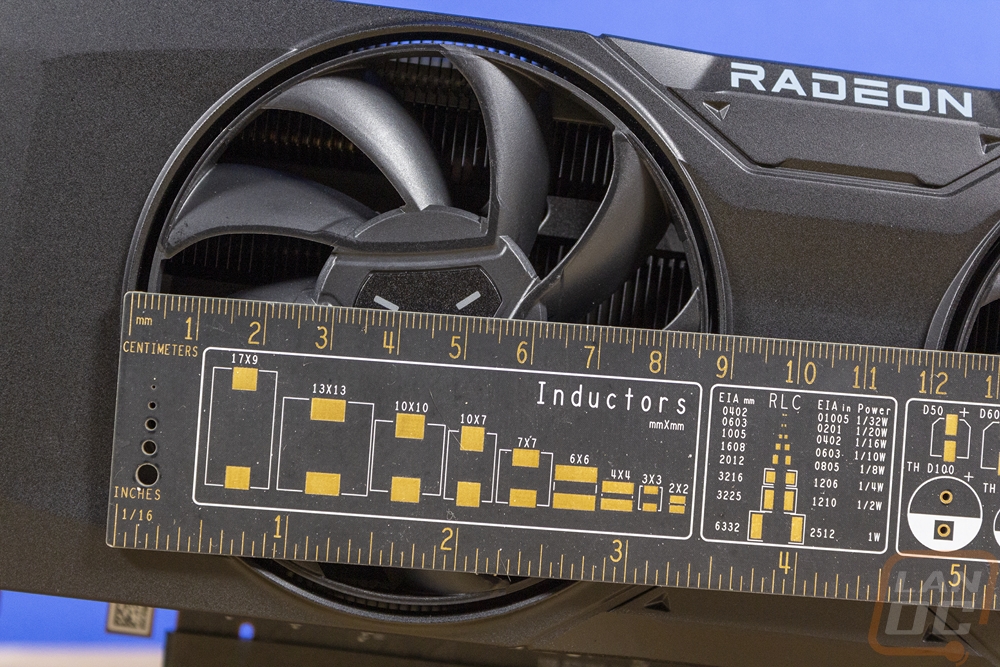
For thickness, the Radeon RX 7800 XT comes in at 50 mm which is a 2 and a half slot layout. This is the same setup that the 7900 XT and XTX reference cards had but the 7600 was a true two-slot card. For card height, it is right at 110 mm which is the same as all of the other reference cards and is also the “standard” full-height PCI height and is significantly shorter than almost all of the partner cards end up having. Then the dual fan cooler is nearly the same length as the 7900 XT’s triple fan cooler with the Radeon RX 7800 XT at 270mm in total length.
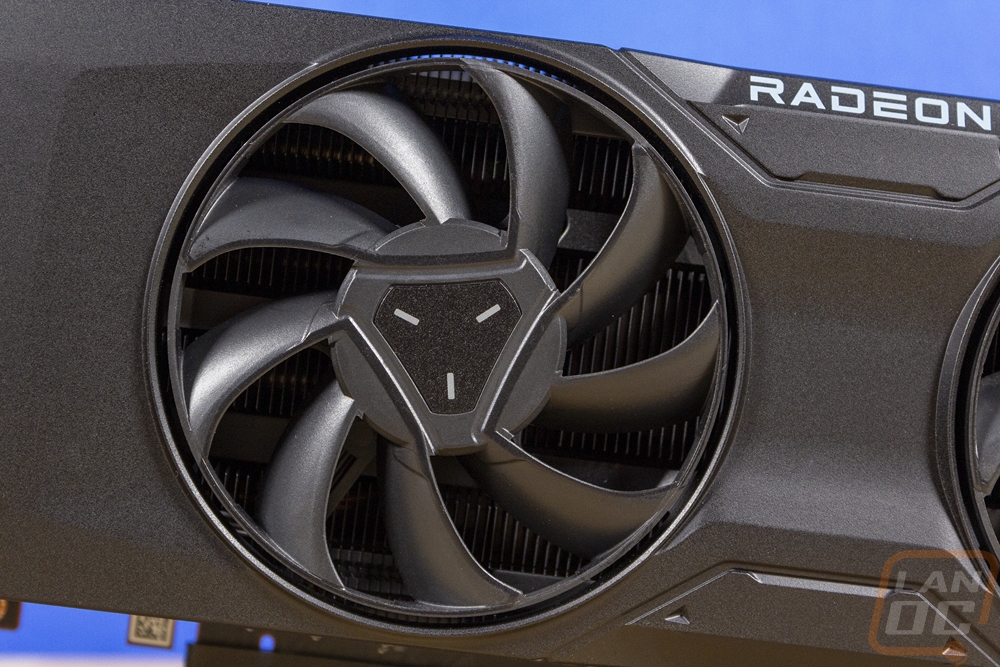
While the Radeon RX 7800 XT is very similar in size to the Radeon RX 7900 XT reference card, the biggest change is for this card AMD has only gone with two fans, dropping the smaller center fan. This allowed them to move the fans around slightly rather than having them packed in together. You wouldn’t be able to tell by looking at them but the fans on the Radeon RX 7800 XT are also slightly larger as well with the blades being 84 mm from edge to edge and the opening being a little larger at 88mm. They have the same design though with the ring around the entire outside linking the 9 blades together and the triangle-like center design. Looking down through the fans we can see that the heatsink has a vertical layout meaning air blown in will vent out the top and bottom which we already know because of the exposed heatsinks at the top and bottom of the card.
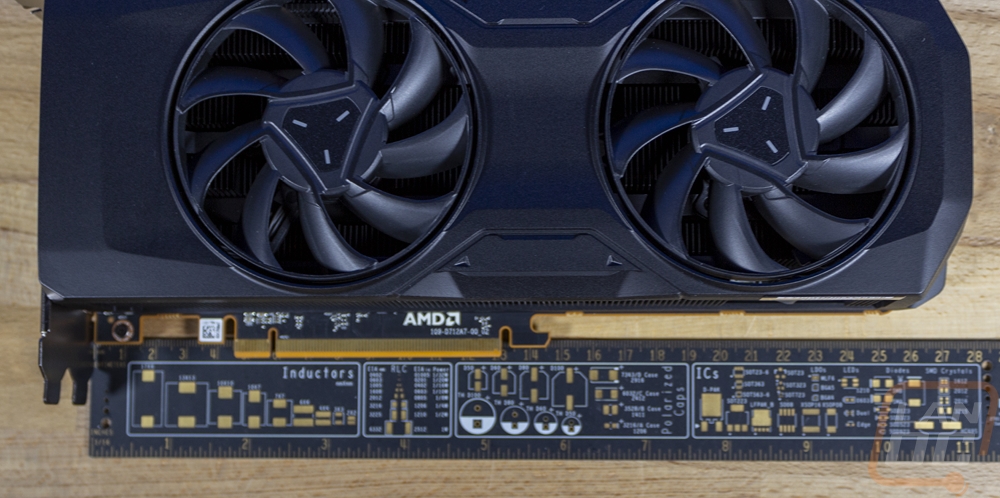
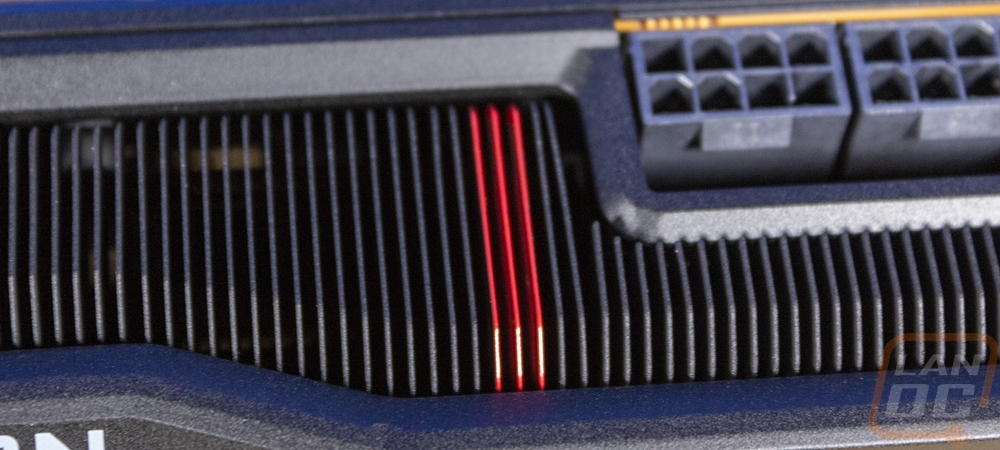
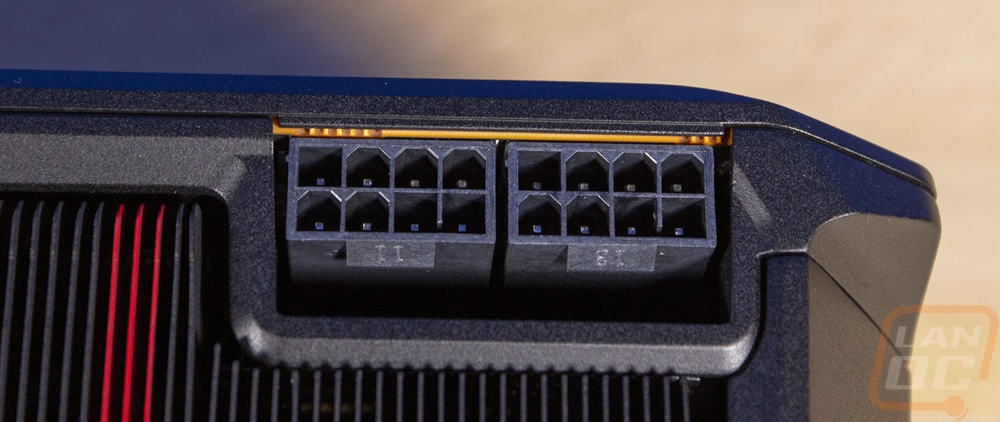
Up on the top edge which is an area that gets a lot of visibility in most traditional cases the Radeon RX 7800 XT has the exposed heatsink just like the other 7000 Series reference cards. What I like about this is that the heatsink itself is all blacked out to match the rest of the card. The one exception to this though are the three fins on the right side that are red to give that touch of Radeon Red. That accent is just before the power connections which are flush with the top edge of the card and the Radeon RX 7800 XT has two 8-pin PCIe plugs, not the newer 12VHPWR connection that requires an adapter or a new power supply. Also up on the top edge, the Radeon branding which can be seen on the front of the card is angled up enough that it is also visible from the top for a touch of branding.
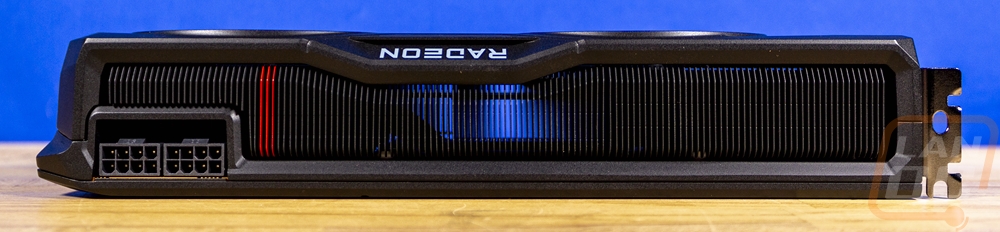
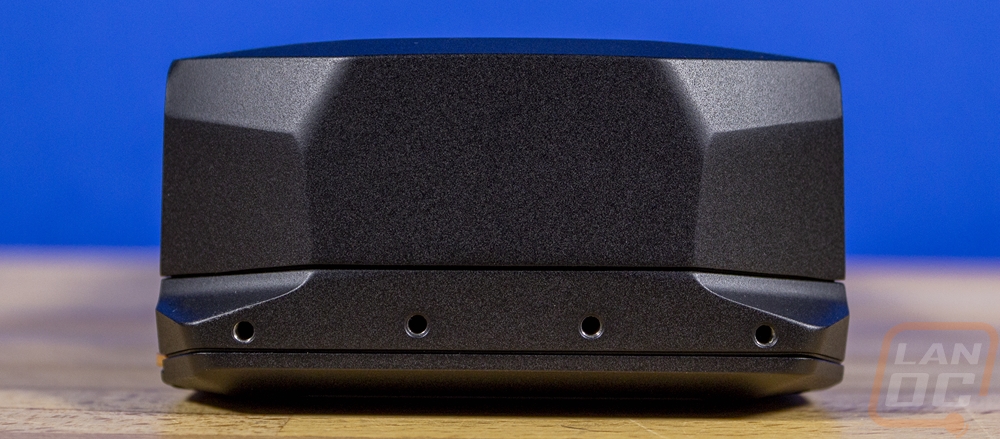
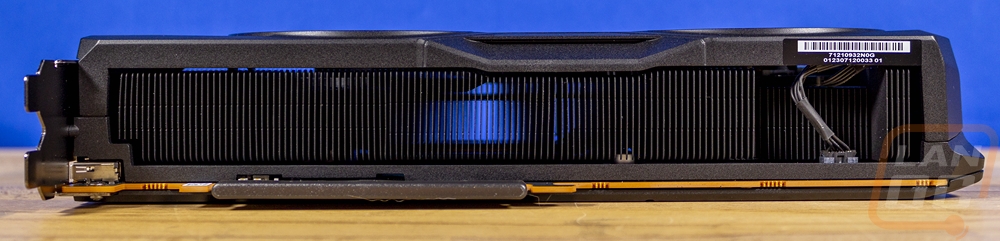
Looking around at the outer edges gives us a better look at what the Radeon RX 7800 XT has going on for its cooling. The top edge of the card has an exposed heatsink that runs the length of the card. What I really like here though is how the fan shroud ramps down around the heatsink and the heatsink also has its edges ramping down to give some definition. The underside of the card doesn’t have any of that and you can see just how much of a difference that makes. The bottom side does have one section cut out of the cooler to leave room for the fan wiring. That spot also has a small sticker with the serial number on it that goes with the second serial that is on the PCI bracket as well. Then the end is completely closed and doesn’t have any airflow going out. It does however have four pre-threaded screw holes that you can use to attach a support bracket to keep things stable.
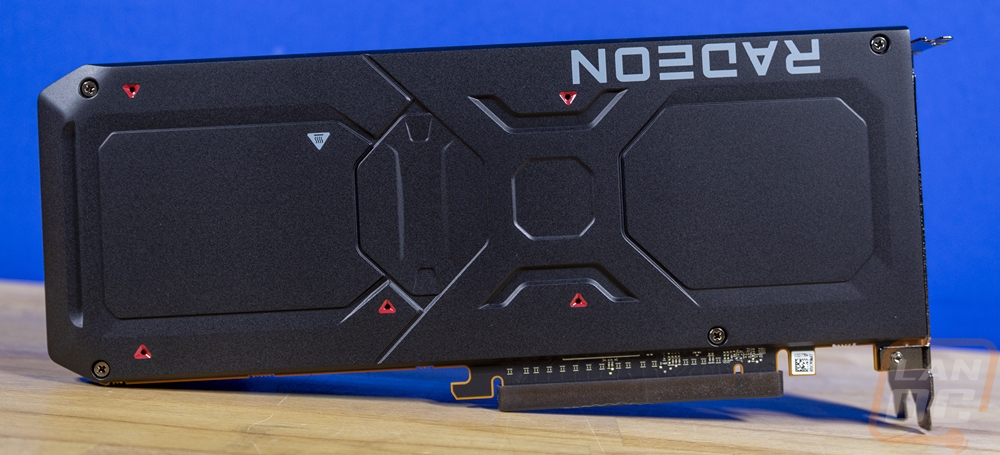
The back of the Radeon RX 7800 XT has the same backplate design that we saw on the Radeon RX 7900 XT. It is a stamped sheet metal design but the accents that they have also stamped in as well as the wrapped around shape on the top, bottom, and end of the card give the backplate a lot of strength. It has the same textured black finish that the rest of the card has and like on the top edge they do have a few small red accents here with five small red painted triangles. There is a small hot surface logo printed on here and then a large Radeon logo up near the top edge that is upside down to make it readable when installed in most cases. The only difference between this and the Radeon RX 7900 XT is the length of the backplate and the location of a few of the mounting screws.
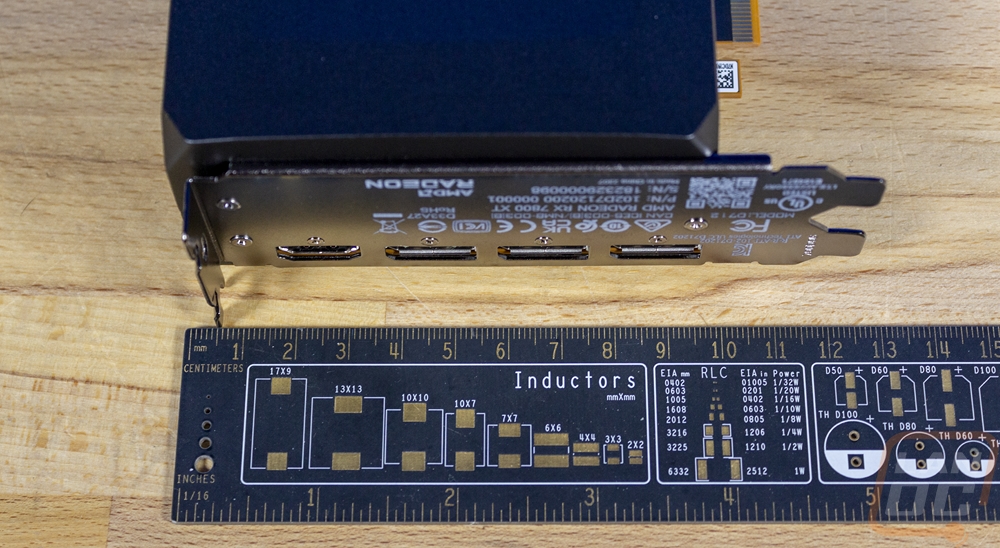
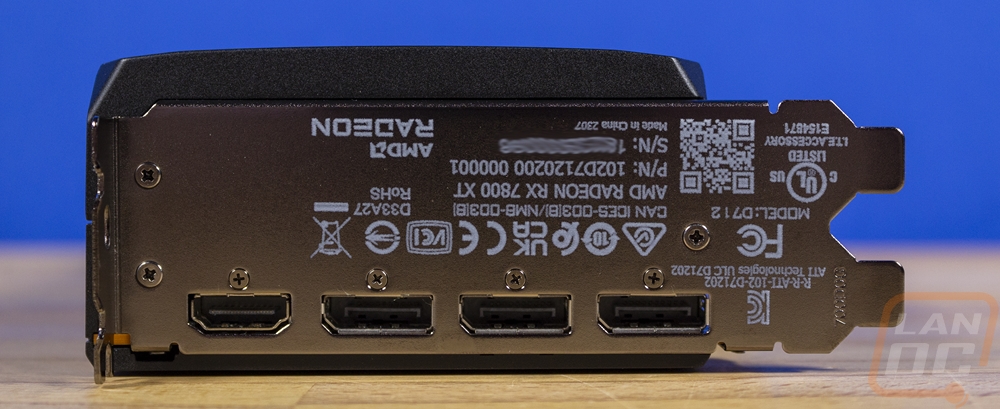
For display connections, the Radeon RX 7800 XT has the same layout that the other AMD 7000 Series reference cards have had. You get three DisplayPort connections and one HDMI with the HDMI up near the top making it easy to find. The rest of the PCI bracket is completely blocked off, there aren’t any vent holes or slots like most cards have. AMD has instead used this space to etch on all of the certification logos as well as the model and serial numbers keeping the rest of the card free from all of that. It also makes it possible to see your serial number when the card is installed if you need it. I will say however that a black finish for the base bracket would be a nice touch on the otherwise blacked-out card design.
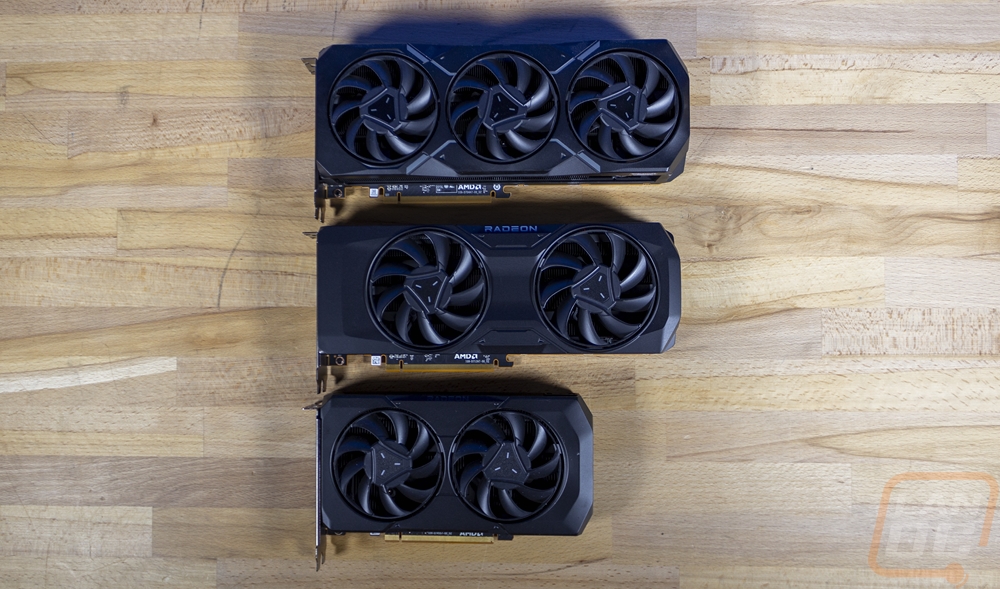
I also got a picture of the Radeon RX 7800 XT with the RX 7600 and RX 7900 XT reference cards for comparison. This really shows just how close the Radeon RX 7800 XT and the Radeon RX 7900 XT are in size even with one less fan. All three cards do look sharp though!
Test Rig and Procedures
CPU: Intel Core-i9 13900K – Live Pricing
PL1=PL2: 253, τ: 56 / 307A
Motherboard: Asus Z790 Extreme – Live Pricing
Cooling: Corsair H100i Elite LCD Display - Live Pricing
Noctua NT-H1 Thermal Paste - Live Pricing
Memory: Crucial 32GB Kit (2 x 16GB) DDR5-5600 UDIMM– Live Pricing
Storage: Sabrent Rocket Q4 2TB – Live Pricing
Power Supply: be quiet! Dark Power Pro 13 1600W- Live Pricing
Case: Primochill Wetbench - Live Pricing
OS: Windows 11 Pro 64-bit - Live Pricing
|
Our Testing Procedures |
|
|
3DMark |
All 3DMark-based tests are done using the most recent version. We test using all three versions of Fire Strike, Both Time Spy and Time Spy Extreme, and Speed Way. Tests to look at ray tracing performance are done with Port Royal when supported and for Nvidia cards that support DLSS, the DLSS subtest is also done at 1440p with the performance setting and DLSS 2.0 as well as a look at DLSS 1, 2, and 3 at 4K. |
|
Unigine Superposition |
1080p Extreme and 4k Optimized benchmarks along with the VR Future test are done. The VR test is done at the Oculus resolution |
|
VRMark |
Only the Blue room test is run |
|
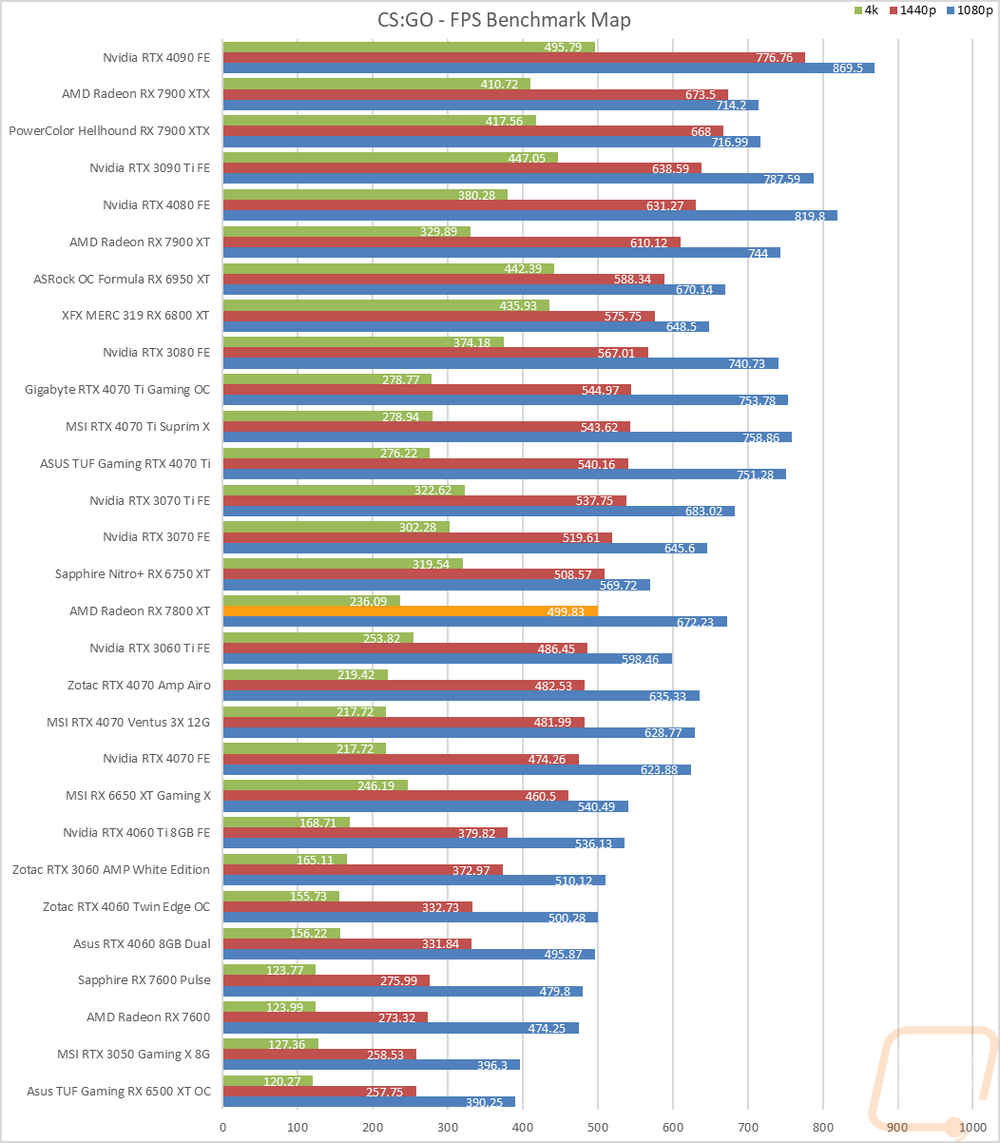
CS:GO |
This test is done using the workshop map called CS:GO Benchmark. You can find more information at this link. https://www.gamingpcbuilder.com/how-to-install-csgo-fps-benchmark-map/ I test at 1080p, 1440p, and 4K resolutions. All auto settings are turned off and detail is set to their highest settings. shadow quality high, model texture detail high, shader detail very high, AA set to 16x, uber shaders enabled |
|
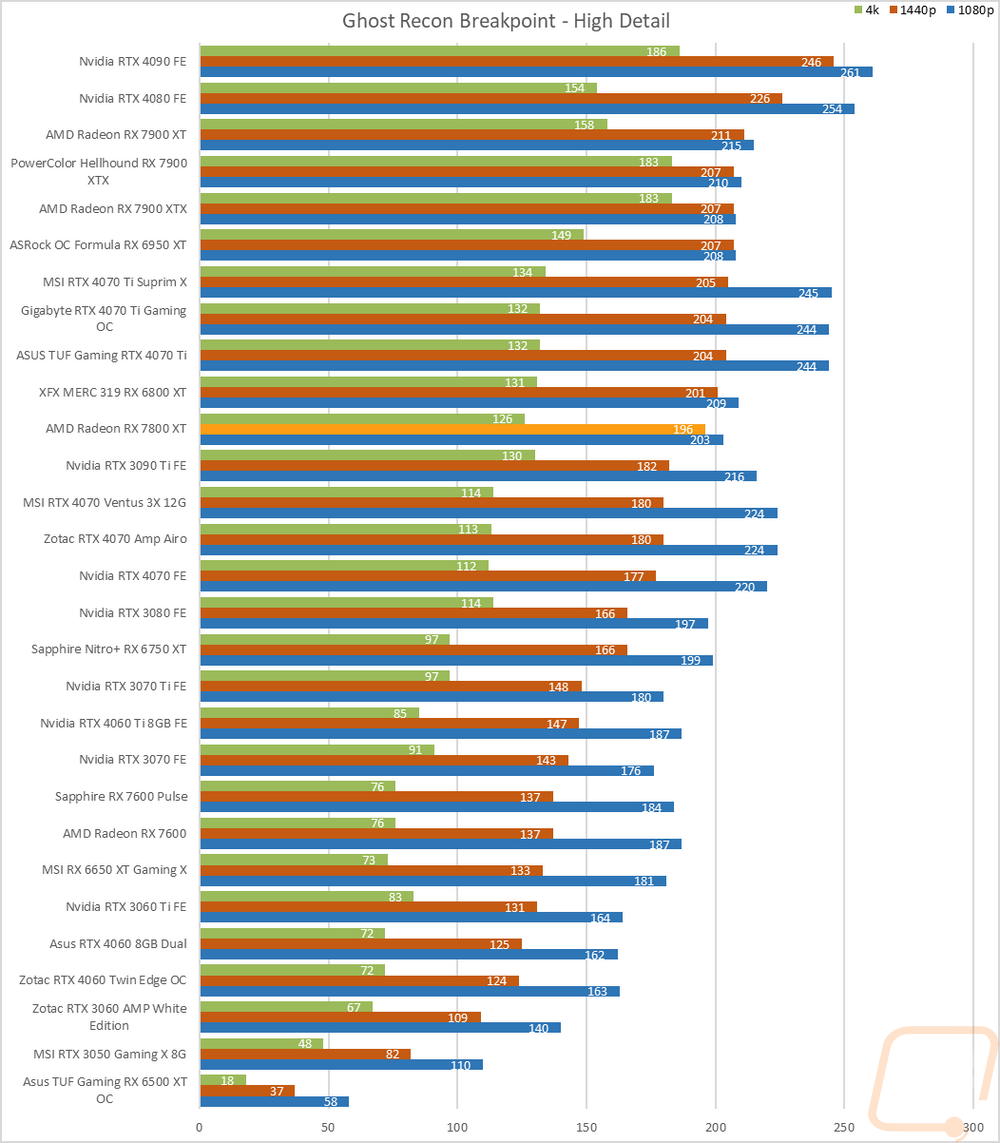
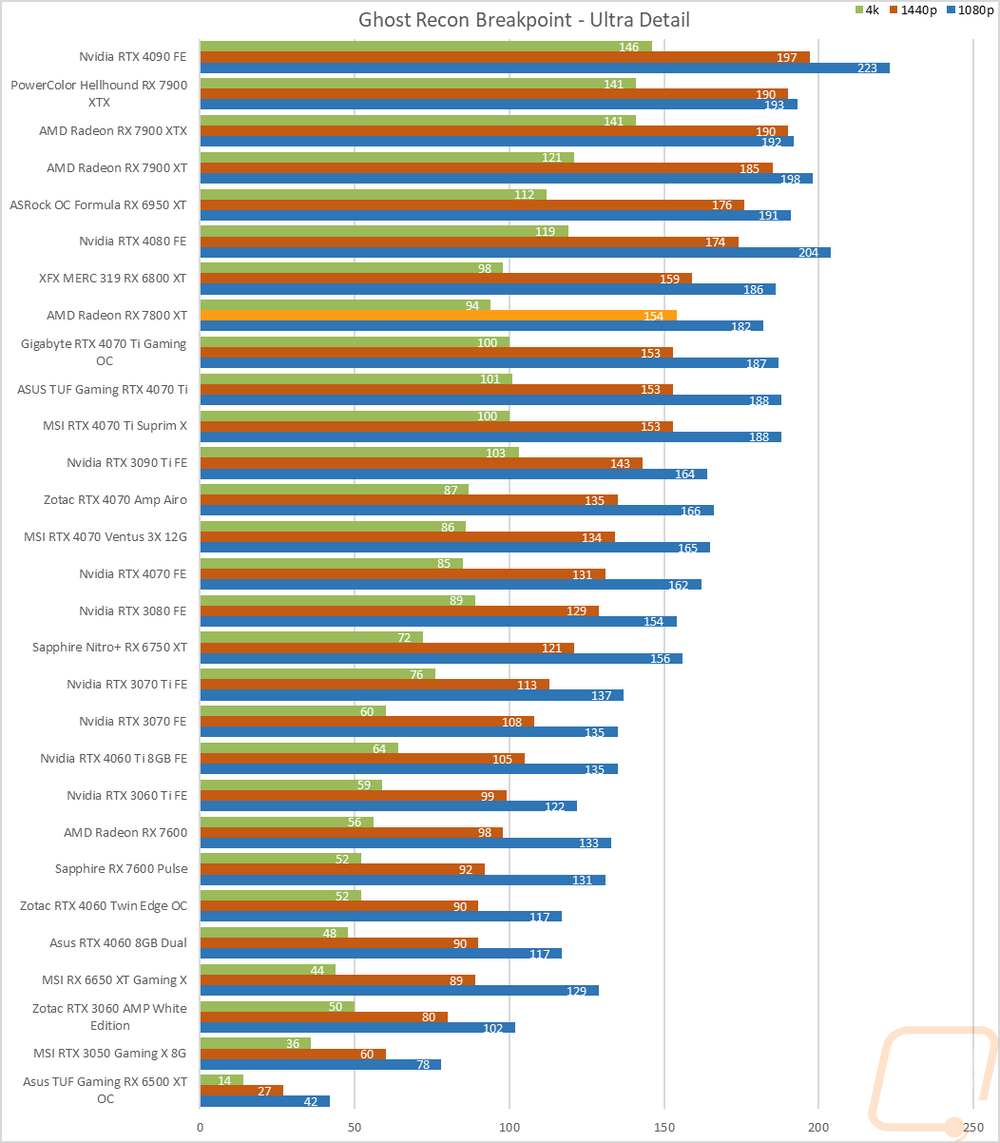
Ghost Recon Breakpoint |
Built-in benchmark tested at 1080p, 1440p, and 4k with the Ultra and Medium detail settings |
|
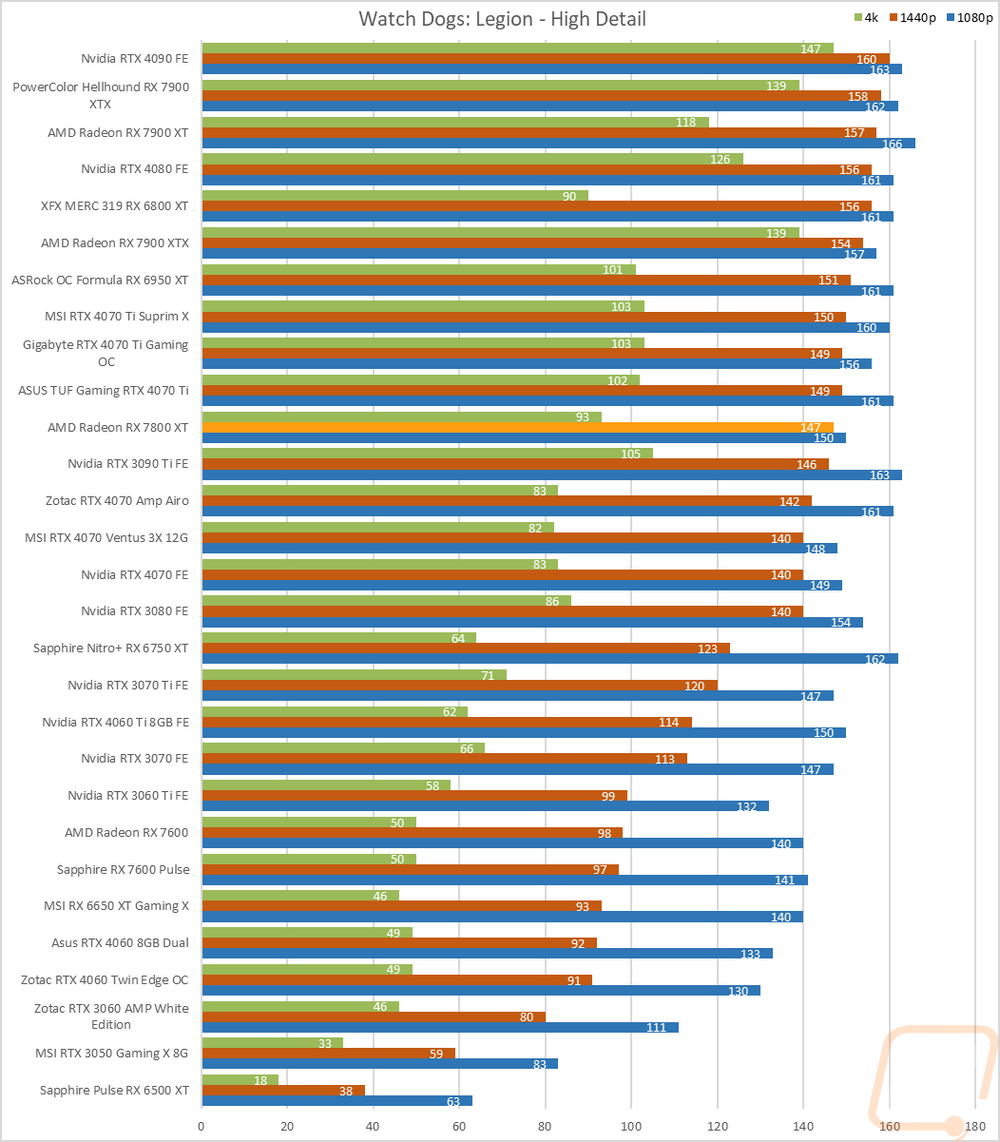
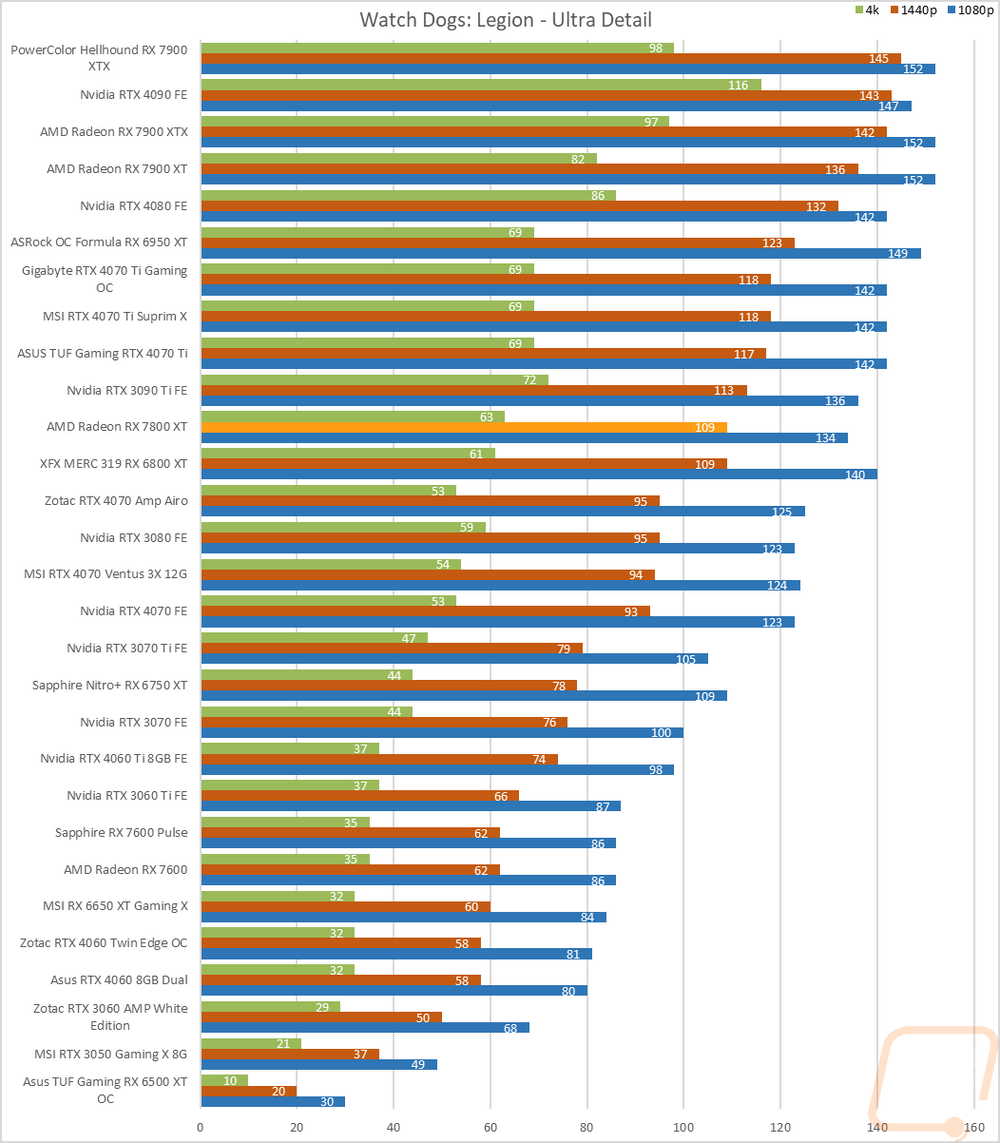
Watch Dogs: Legion |
Built-in benchmark testing at ultra and high details. Tested at 1080p, 1440p, and 4k. I also do RTX and DLSS testing on Nvidia cards at 4K using the Ultra detail settings as a base as well. |
|
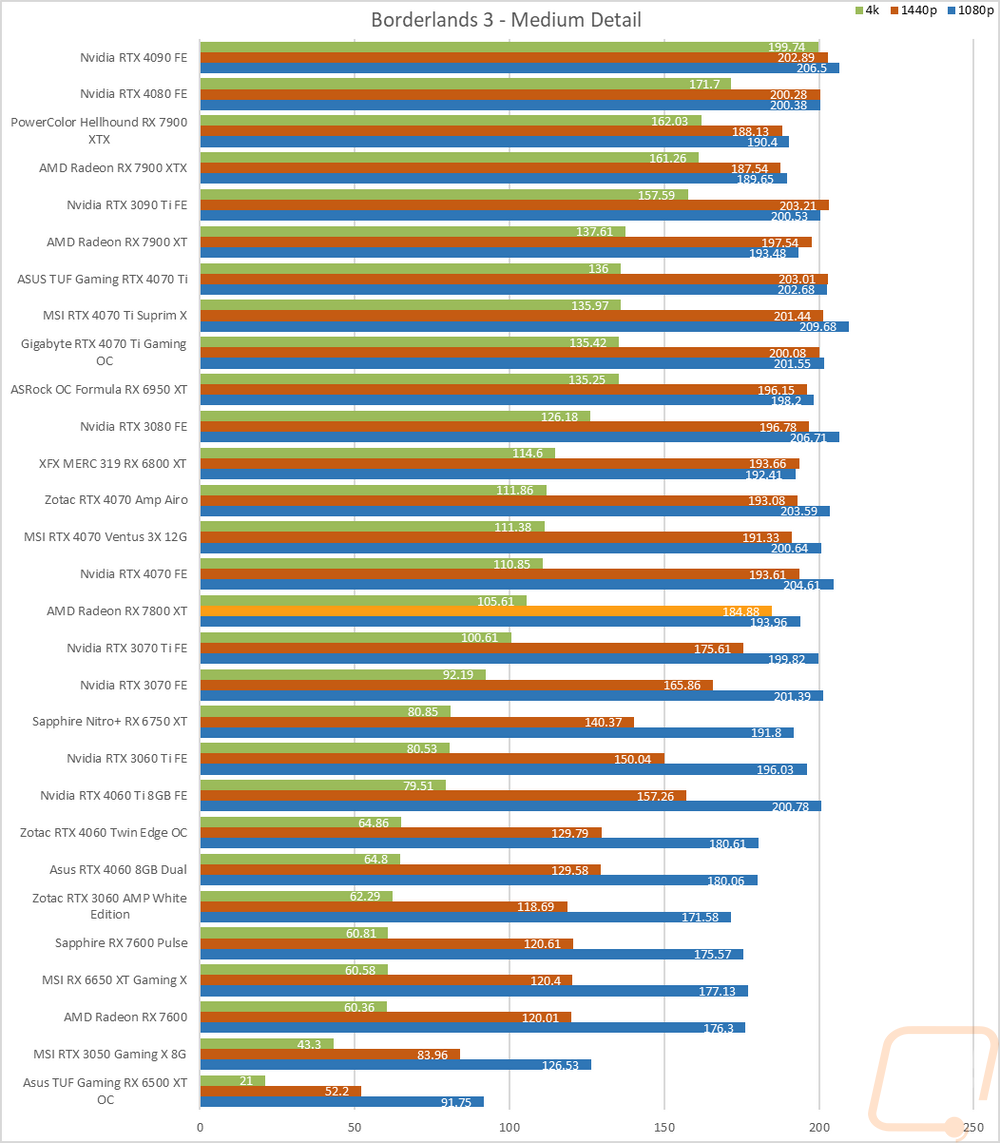
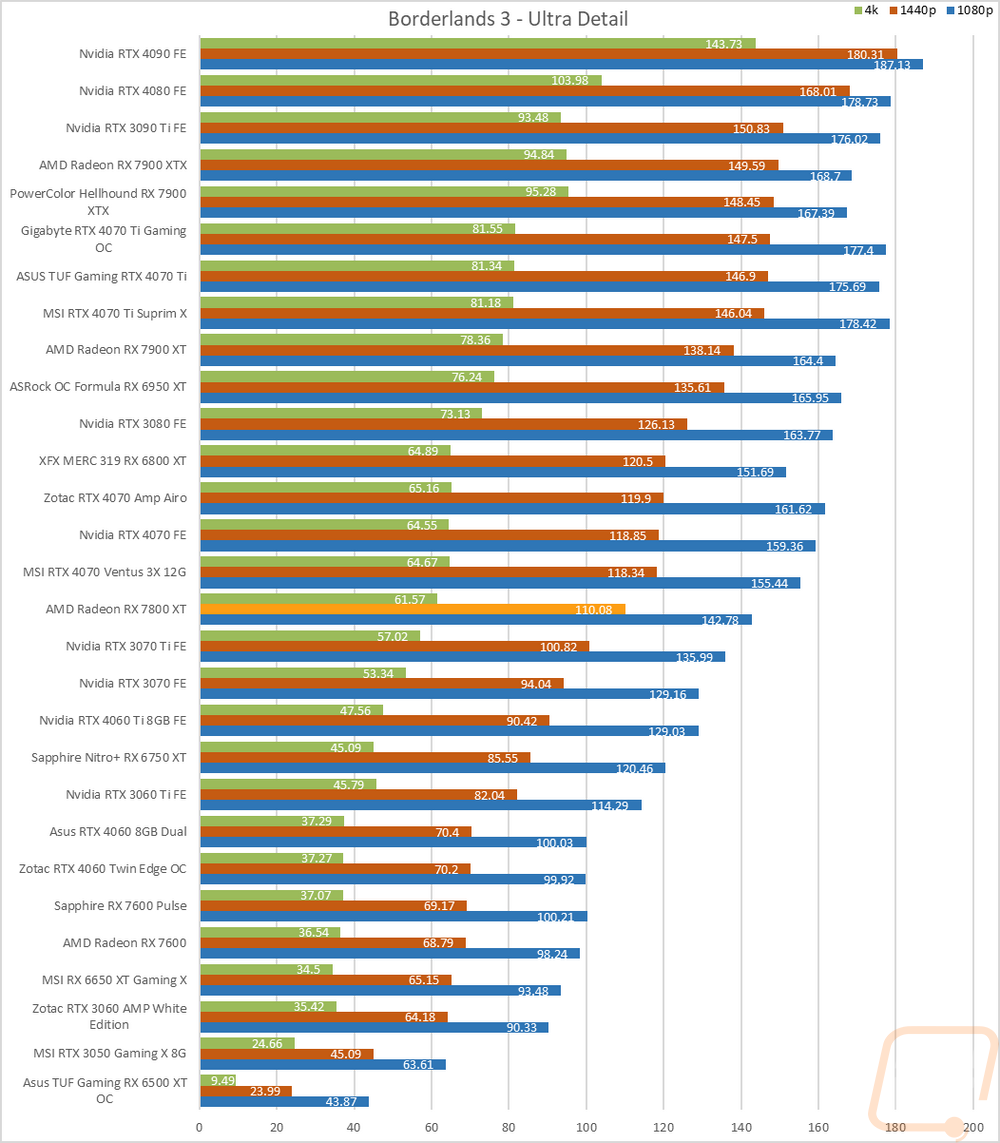
Borderlands 3 |
Built-in benchmark testing with the ultra detail setting and medium detail setting, done at full screen with default settings at 1080p, 1440p, and 4k on DX11 |
|
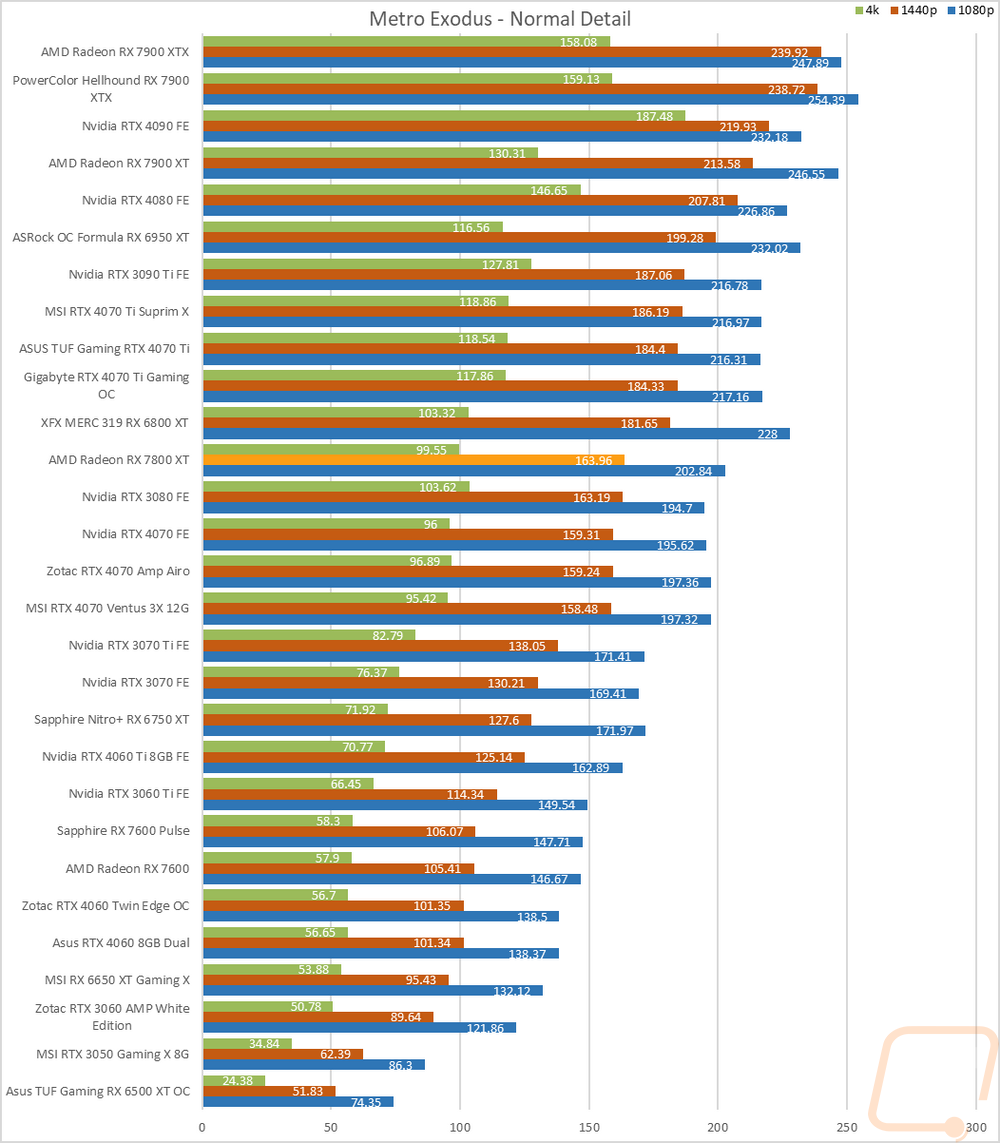
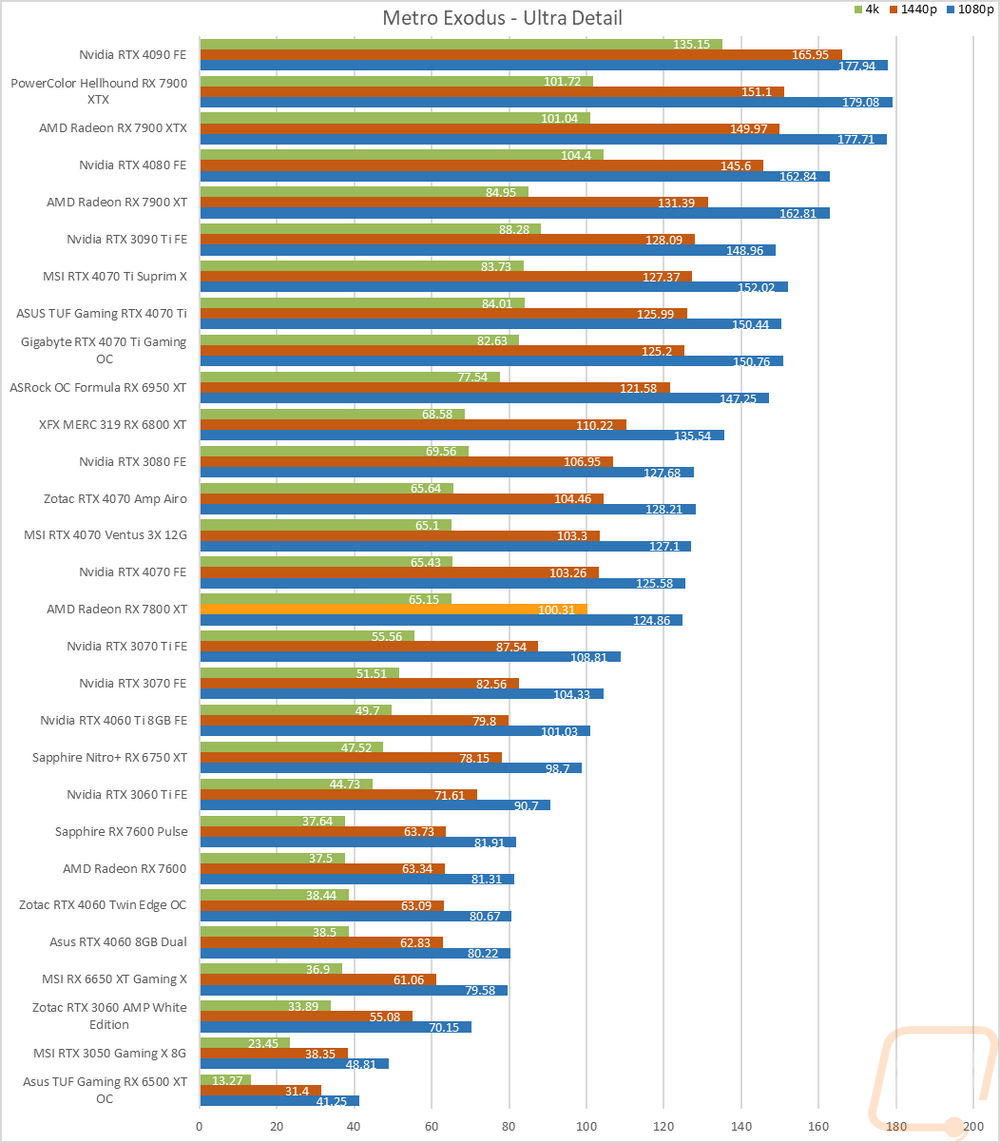
Metro Exodus |
Using built-in benchmark, testing at ultra and normal details at 1080p, 1440p, and 4k. I also do RTX and DLSS testing at 4K with the ultra-detail base settings for Nvidia cards as well. |
|
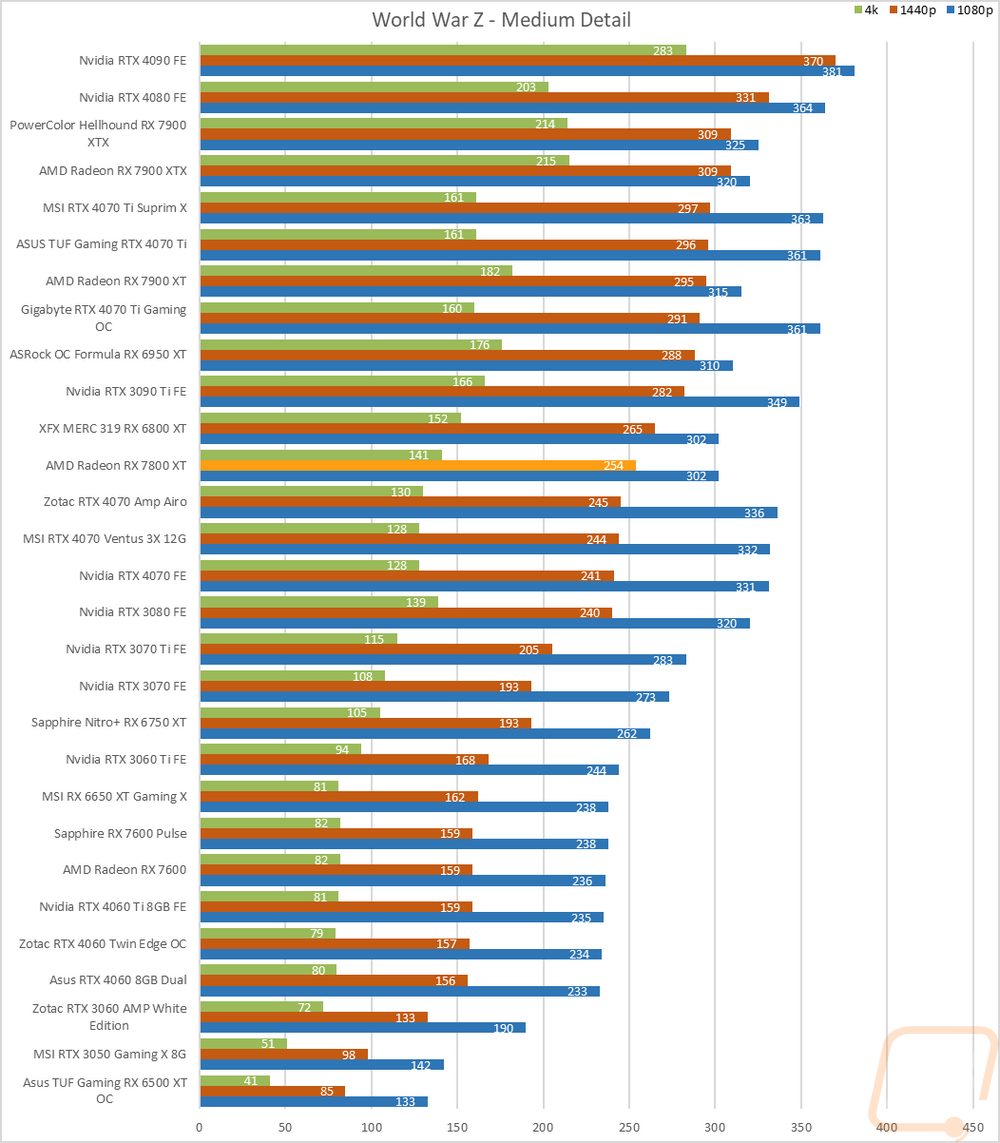
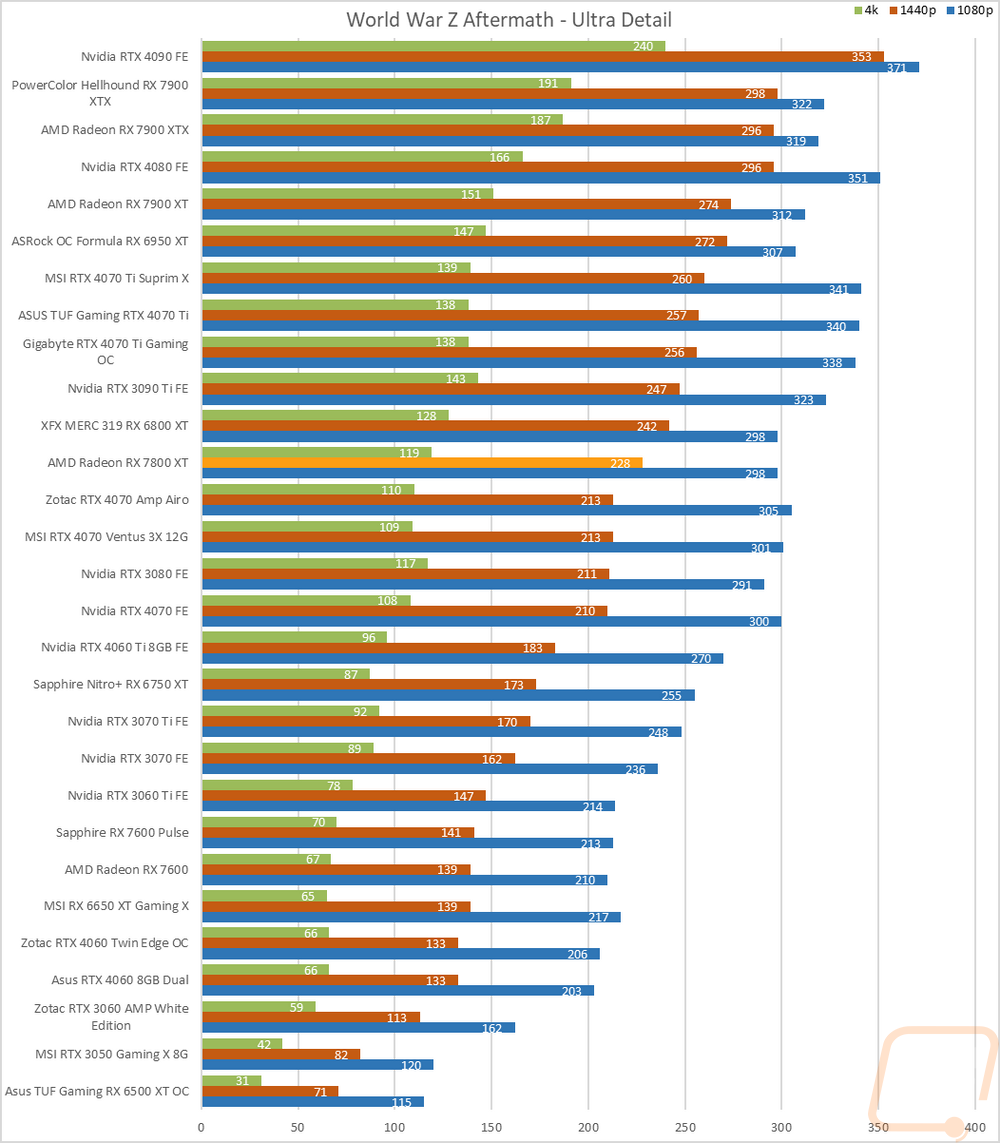
World War Z Aftermath |
Built-in benchmark in DX11 testing both the Ultra detail and Medium detail levels at 1080p, 1440p, and 4K resolutions |
|
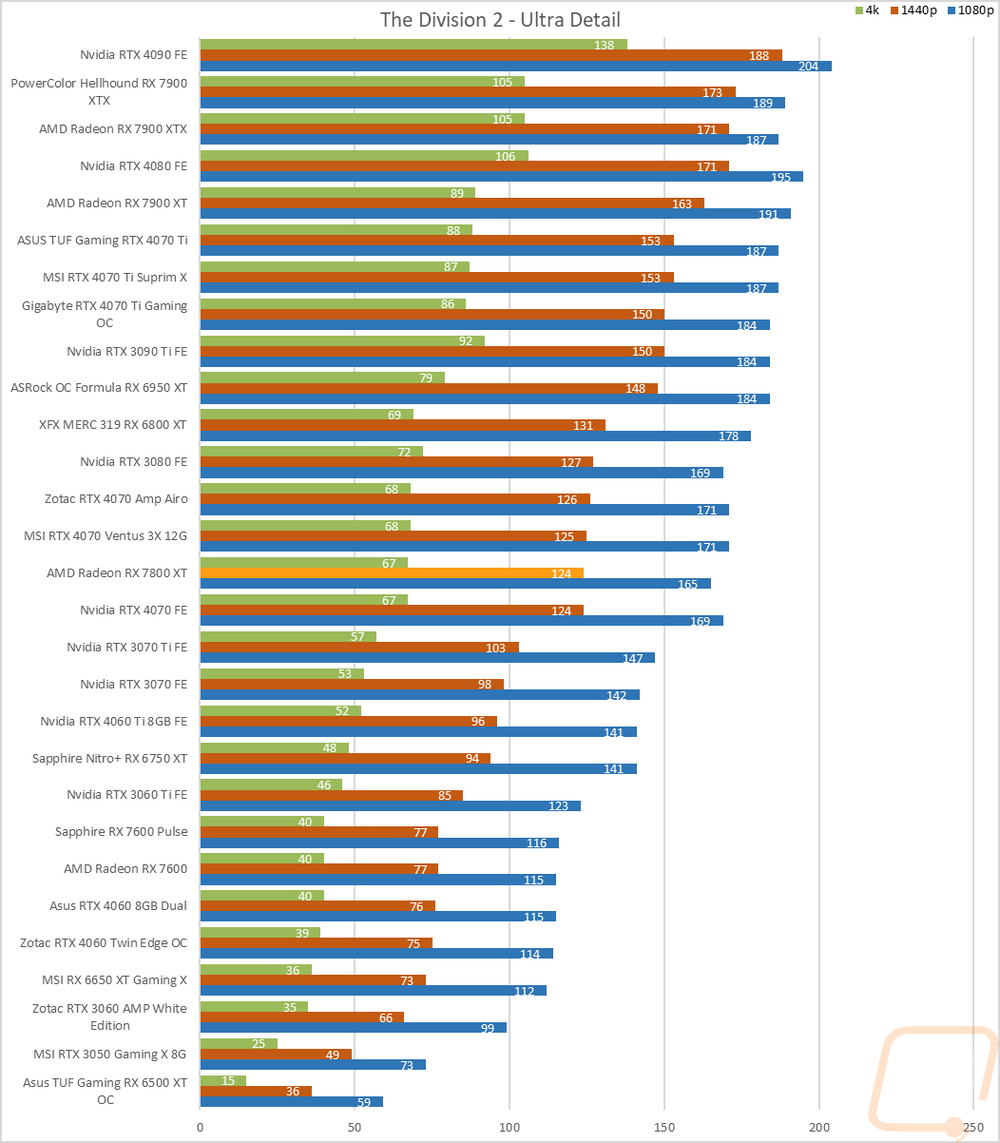
The Division 2 |
Built-in benchmark at Ultra detail with V-Sync turned off at 1080p, 1440p, and 4k resolutions. |
|
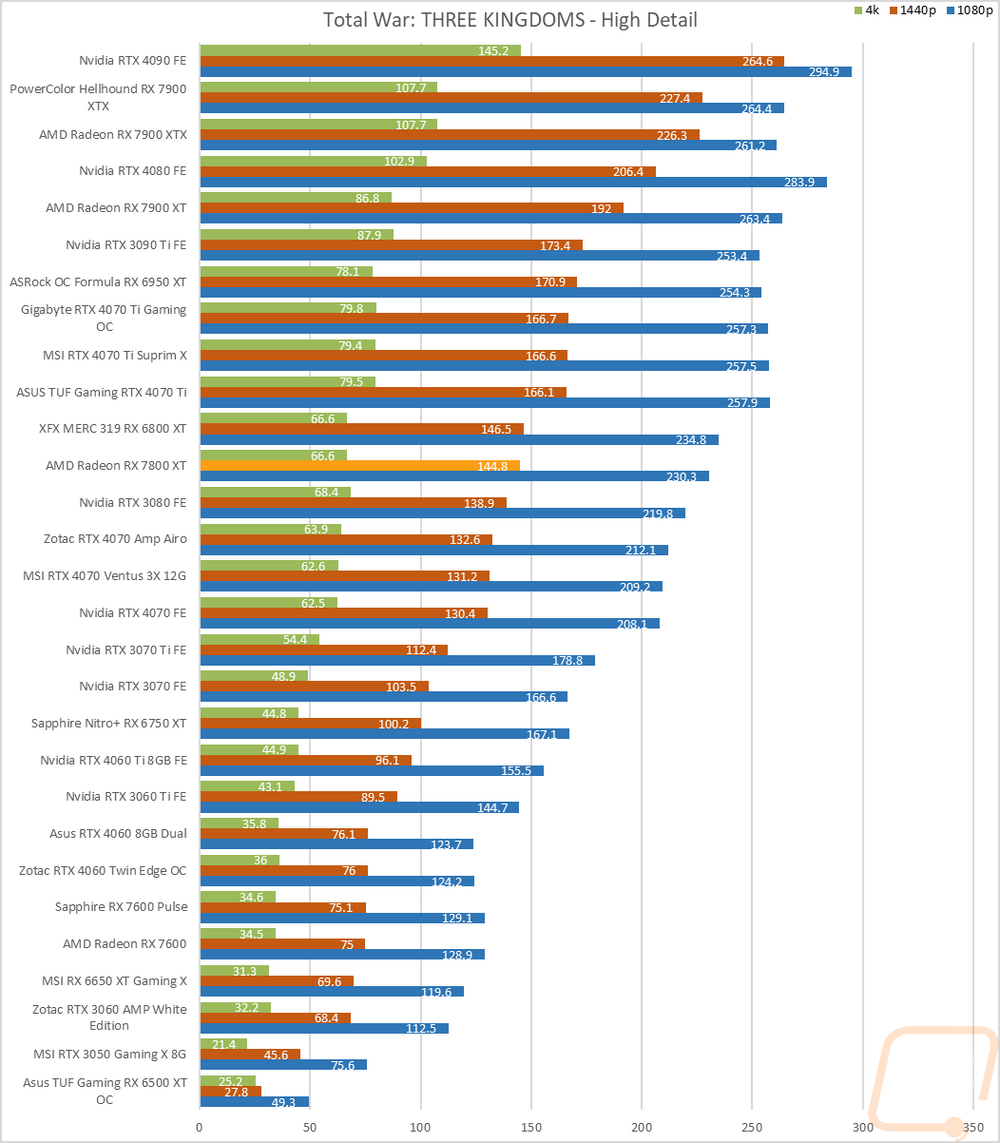
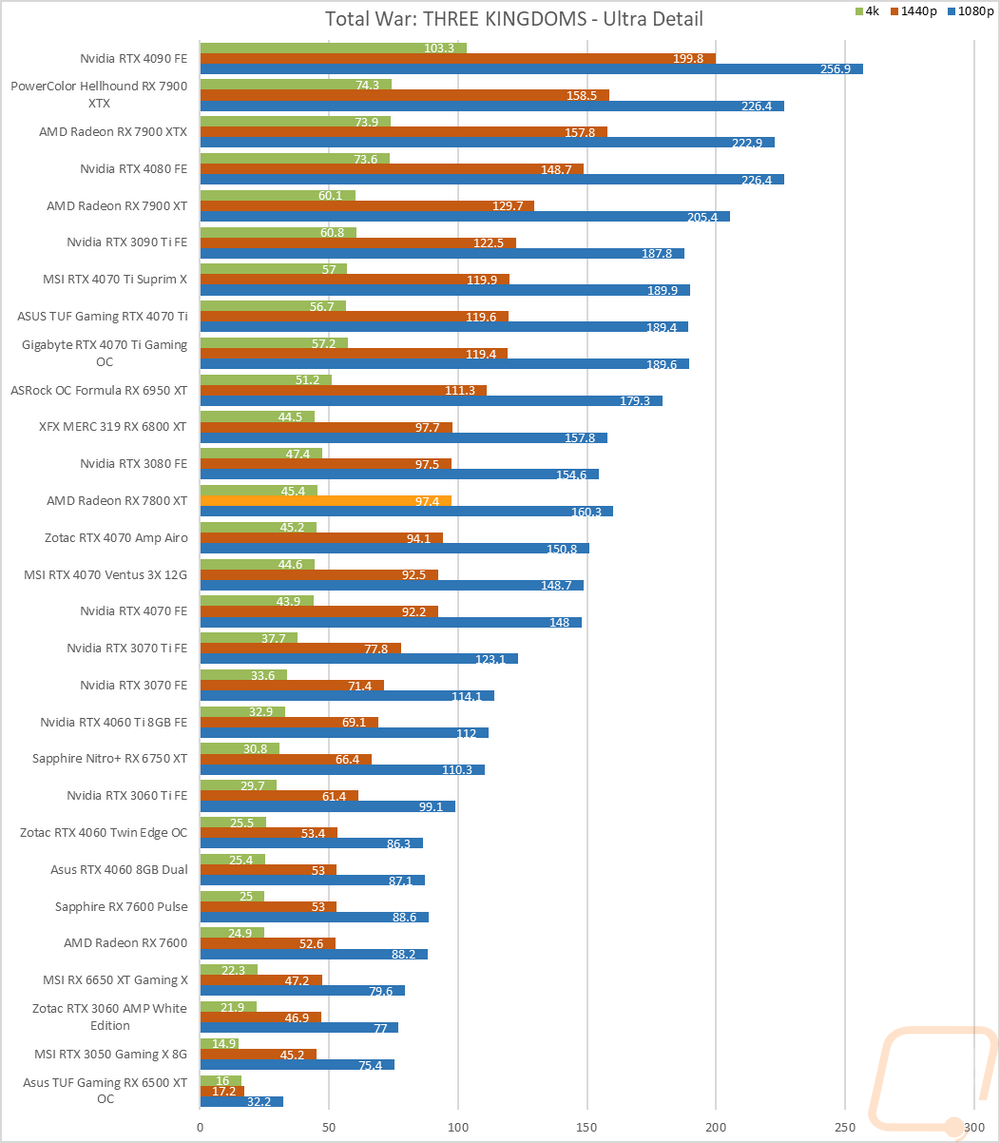
Total War: Three Kingdoms |
Built-in benchmark using the Battle Benchmark setting. Tested at 1080p, 1440p, and 4k at both high and ultra detail settings |
|
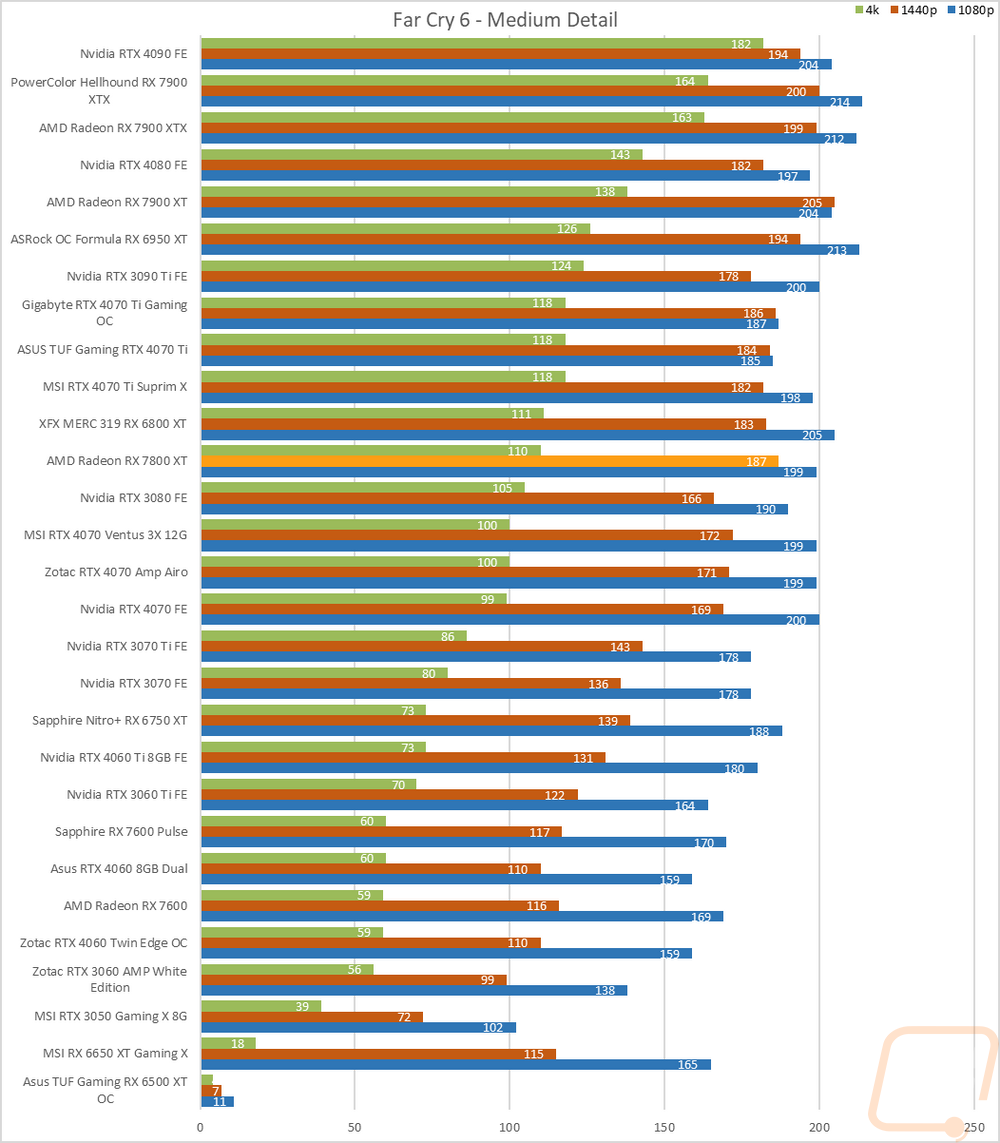
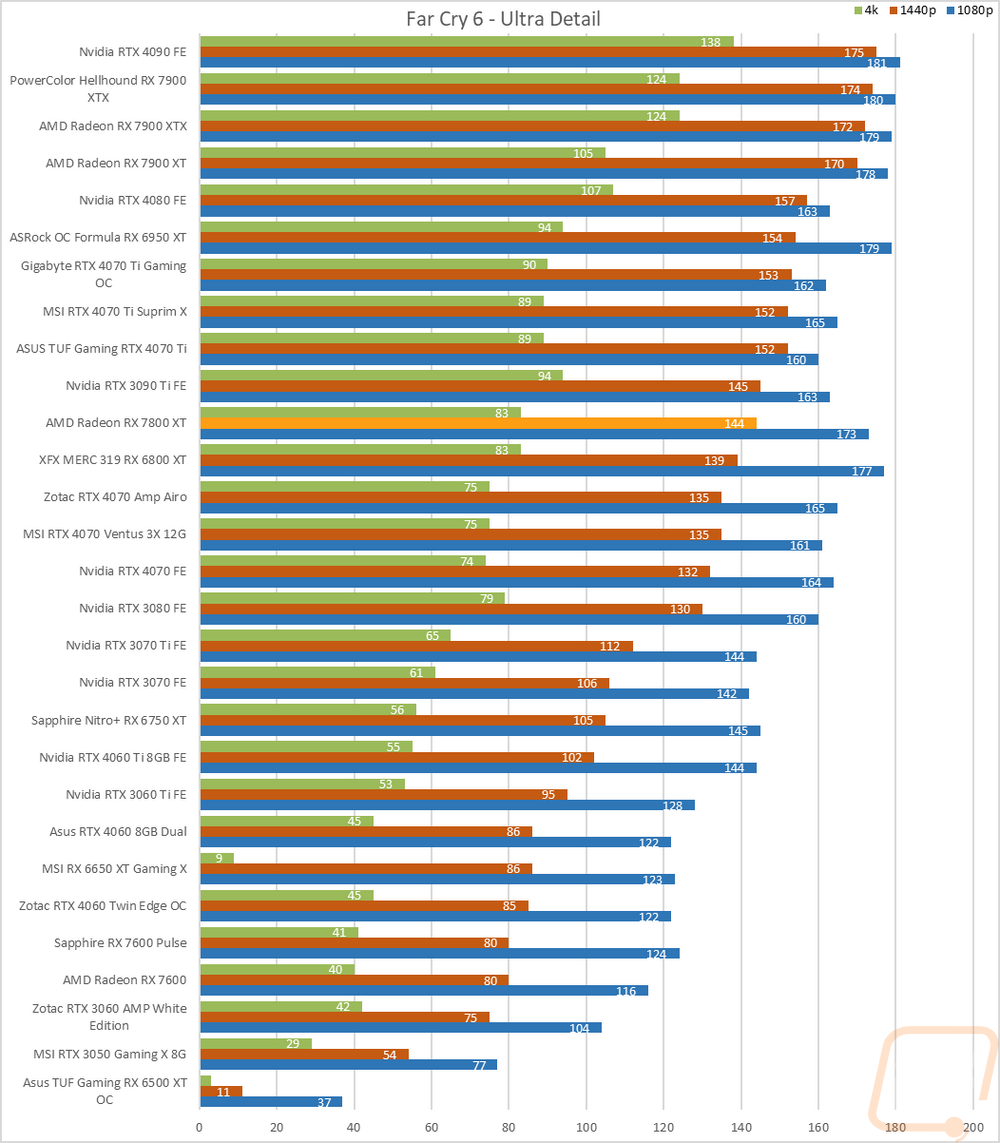
Far Cry 6 |
Built-in benchmark tested at 1080p, 1440p, and 4k with the Ultra and Medium detail settings |
|
V-Ray 5 |
V-Ray 5 benchmark us run with CUDA and RTX settings on cards that support it |
|
Boundary Benchmark |
Testing different DLSS detail levels on cards that support it. All testing is done at 4k with RTX on |
|
Bright Memory Infinite RTX Benchmark |
Benchmark all of the different RTX detail levels. Resolution at 4k and DLSS on balanced for each test |
|
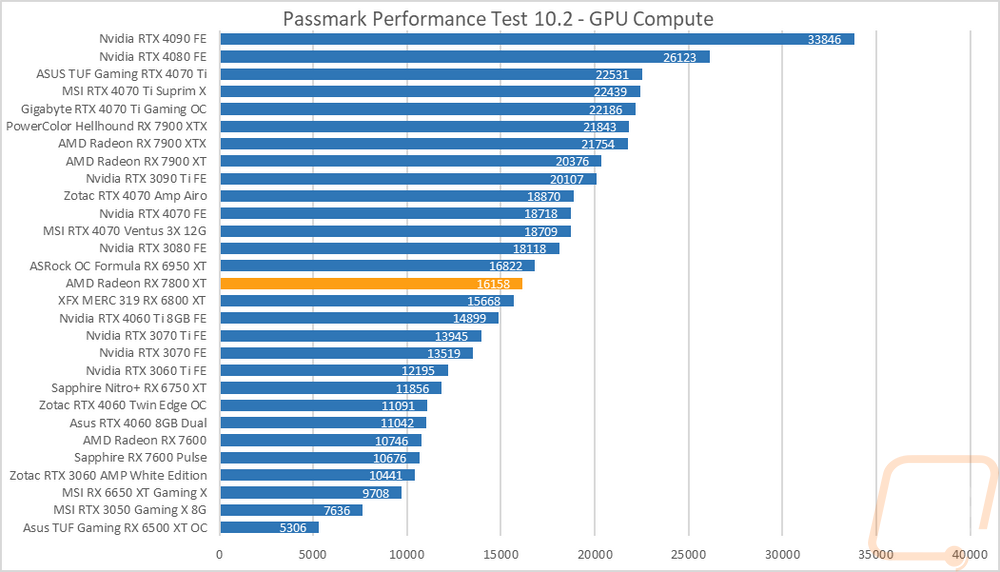
Passmark Performance Test 10.2 |
Test using the GPU Compute Score inside of PassMark's Performance Test 10.2 |
|
Blender |
Using the standard Blender Benchmark I run the test using the Blender 3.4 setting which tests using the Monster, Junkshop, and Classroom tests. |
|
OctaneBench 2020.1 |
OctaneBench is designed to test rendering in OctaneRender. RTX and non-RTX are both ran. This is a CUDA-only test so only Nvidia cards are tested |
|
Power Testing |
Using a PCat v2 to monitor power between the PCIe slot and the card as well as power through the power cables I test the peak power when running ADIA64, 3DMark Speed Way, 3DMark Time Spy Extreme, FarCry 6 at 4k and Ultra Detail, Watch Dogs Legion at 4K and Ultra detail, and Blender 3.4.0. The results are then averaged as well as the highest result. |
|
Noise Testing |
Our Noise testing is done using a decibel meter 18 inches away from the video card on the bottom/fan side of the card. We test at 50% and 100% fan speeds as well as a third test while under load using AIDA64's stress test. This is done using a Protmex PT02 Sound Meter that is rated IEC651 type 2 and ANSI S1.4 type 2. Tests are done set weighted to A and set to a slow response using the max function. The ambient noise level in the testing area is 33.3 decibels. |
|
Temperature Testing |
Using AIDA64, the GPU stress test is run for 30 minutes or until the result has leveled off. The test is run twice, once with the stock fan profile and a second time with 100% fan speed. During this, I also document the 100% fan speed RPM and document the delta between the fan profile and 100% fan speed as well as get thermal images. |
Synthetic Benchmarks
As always I like to start my testing with a few synthetic benchmarks. 3DMark especially is one of my favorites because it is very optimized in both Nvidia and AMD drivers. It's nice to not have to worry about it being favored too much either way and the repeatability of the results makes it a nice chance to compare from card to card, especially when comparing with the same GPU. In the case of the Radeon RX 7800 XT, this is the first 7800 XT that I am testing. So my focus is just on how it compares against the competition. That includes seeing how it compares to the 7600 and 7900 XT as well as the 6800 XT from last generation and then from Nvidia cards like the RTX 4070 and RTX 4060 Ti.
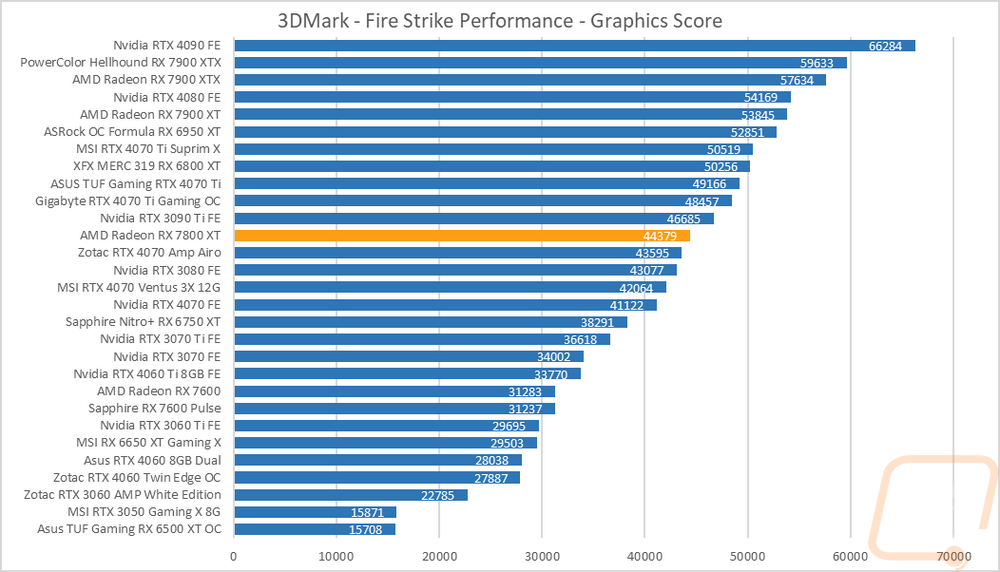
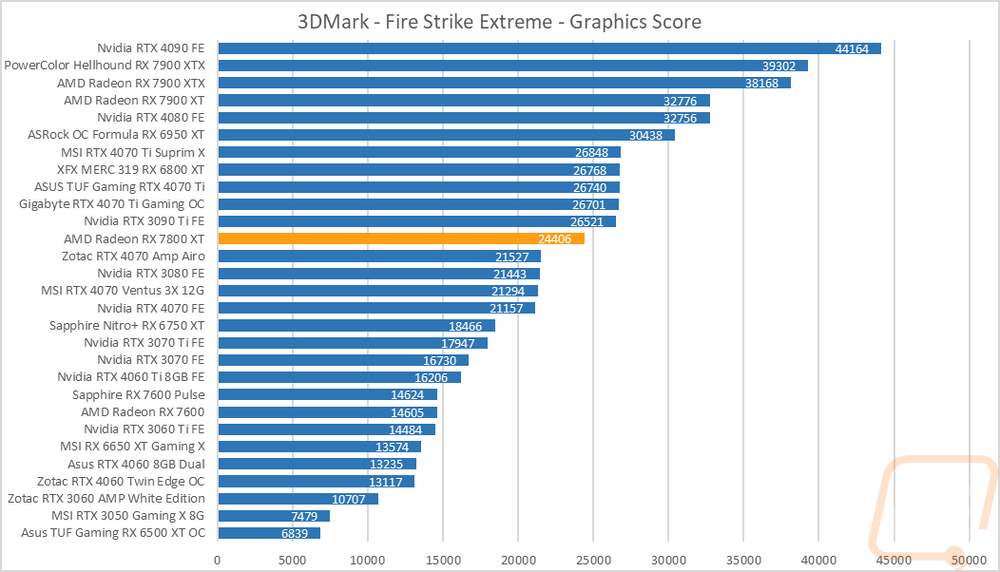
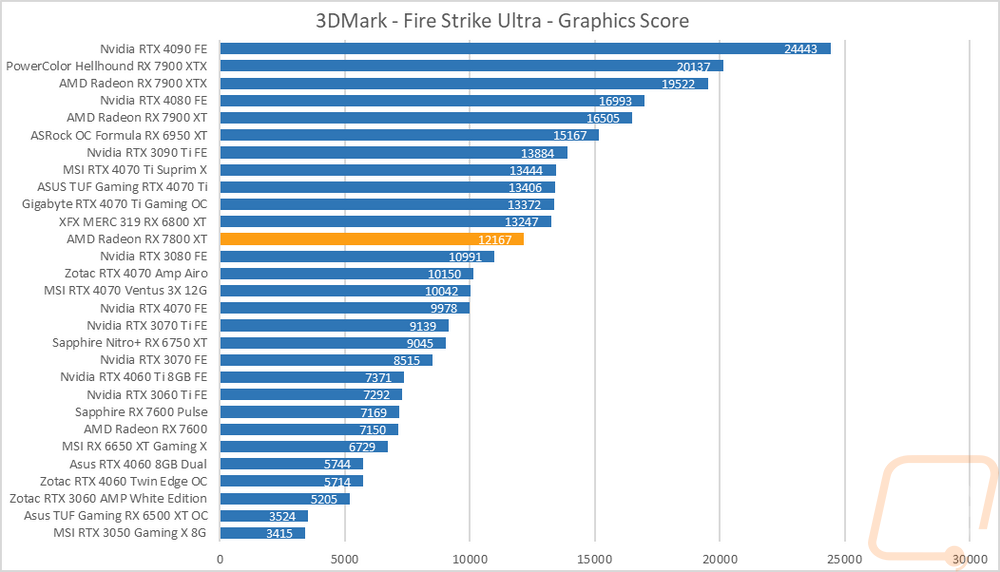
The first round of tests were done in the older Fire Strike benchmark which is a DX11 test. There are three detail levels, performance, extreme, and ultra. The Radeon RX 7800 XT scored a 44379 on the base Fire Strike test putting it above the overclocked RTX 4070 and the RTX 3080 but the 6800 XT, which is an overclocked card where this is a stock clocked reference card, is way out in front with a score of 50256. That gap shrunk in Fire Strike Extreme where the Radeon RX 7800 XT is even farther in front of the 4070 and Fire Stike Ultra has the 680 XT still ahead but even closer together.
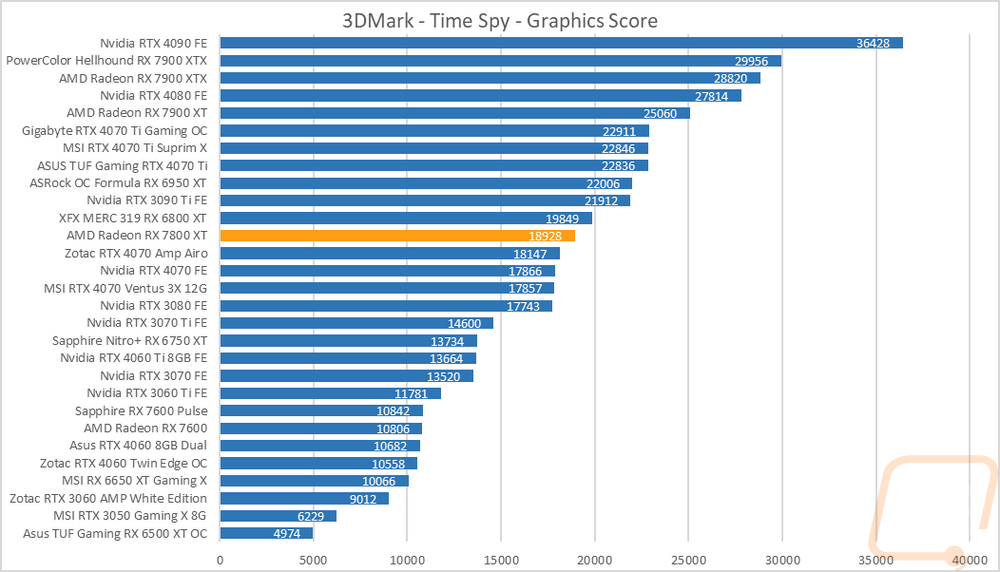
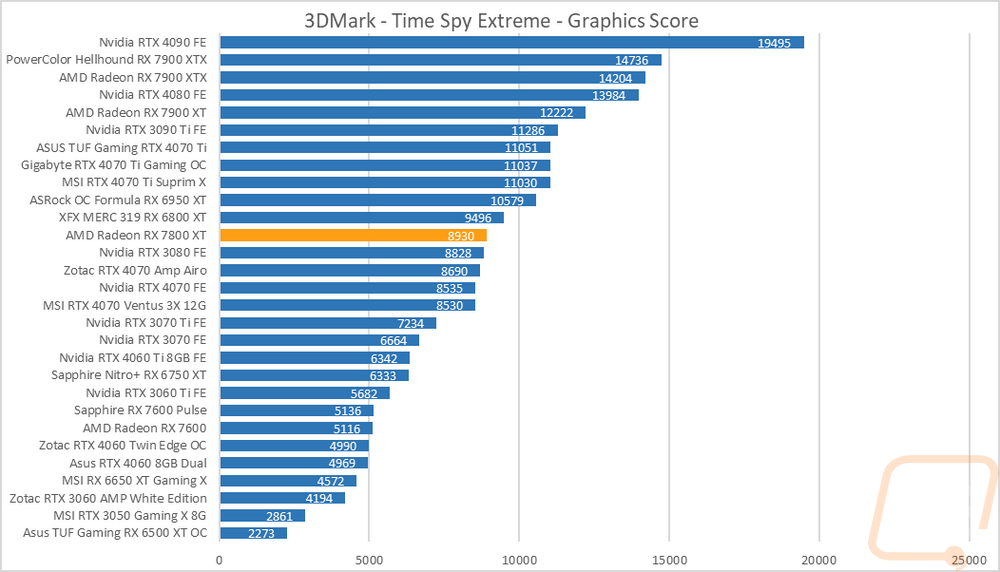
The next two were both based on the Time Spy benchmark. One is the standard test and then there is the extreme detail level. This is a DX12-focused test and a better look at modern game performance. The overclocked 6800 XT is ahead in both tests and the Radeon RX 7800 XT is out in front of both the 4070 and last generations 3080 in both tests as well.
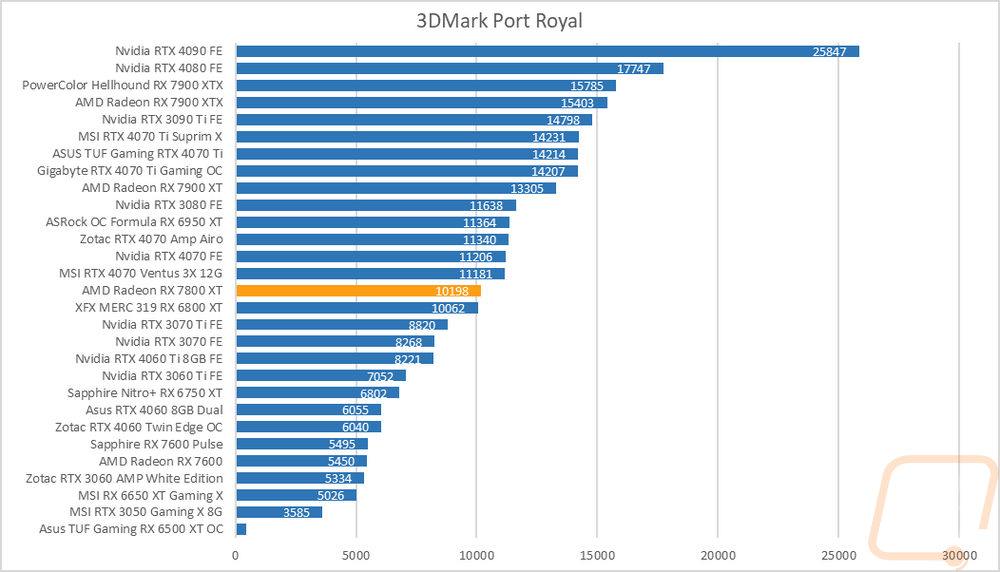
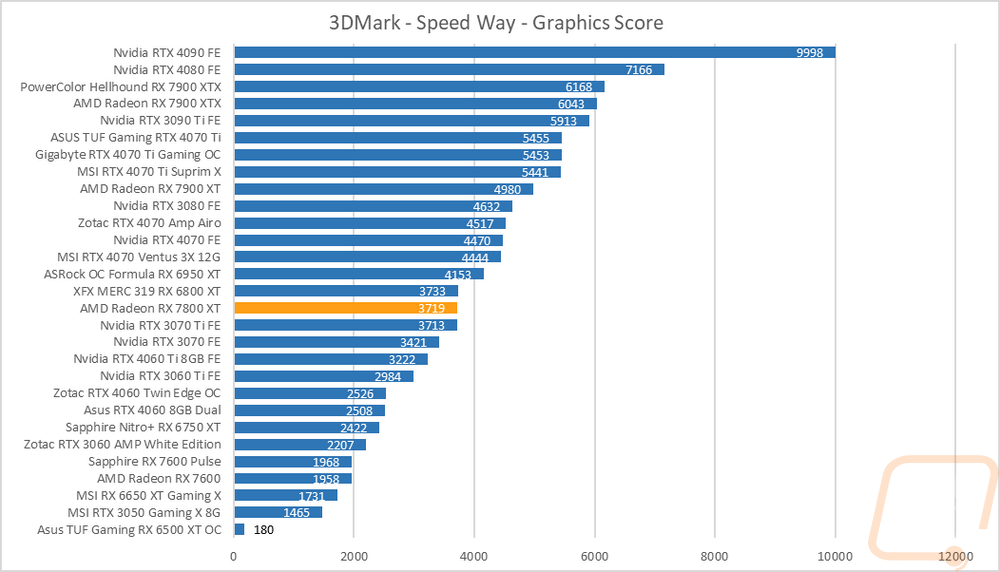
For ray tracing performance, I ran both the 3DMark Port Royal test which is ray tracing focused as well as the new 3DMark Speed Way test which tests all future-looking features including ray tracing. In Port Royal, the Radeon RX 7800 XT outperforms the RX 6800 XT in this situation but the RTX 4070, even the stock-clocked Founders Edition model jumps ahead here. In Speed Way, the 6800 XT and the Radeon RX 7800 XT are right together in performance but again the 4070 is way out in front here by an even bigger margin. For comparison, the Radeon RX 7800 XT is right with the 3070 Ti in performance here.
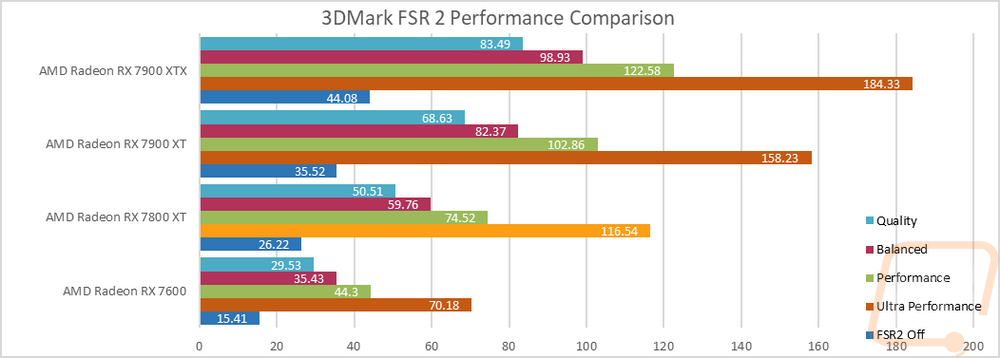
While in 3Dmark I did also check out the AMD FSR 2 performance demo which I ran at 4K in all four of the detail settings. I compared the Radeon RX 7800 XT against the other 7000 Series cards here. I was curious how much of a performance difference FSR 2 (not the new 3) can offer. For the Radeon RX 7800 XT, the base average frame rate with it off was 26.22 FPS. Even on the highest detail that performance nearly doubled but you can see that it goes up from there tripling on the performance setting and more than 4 times with ultra-performance.
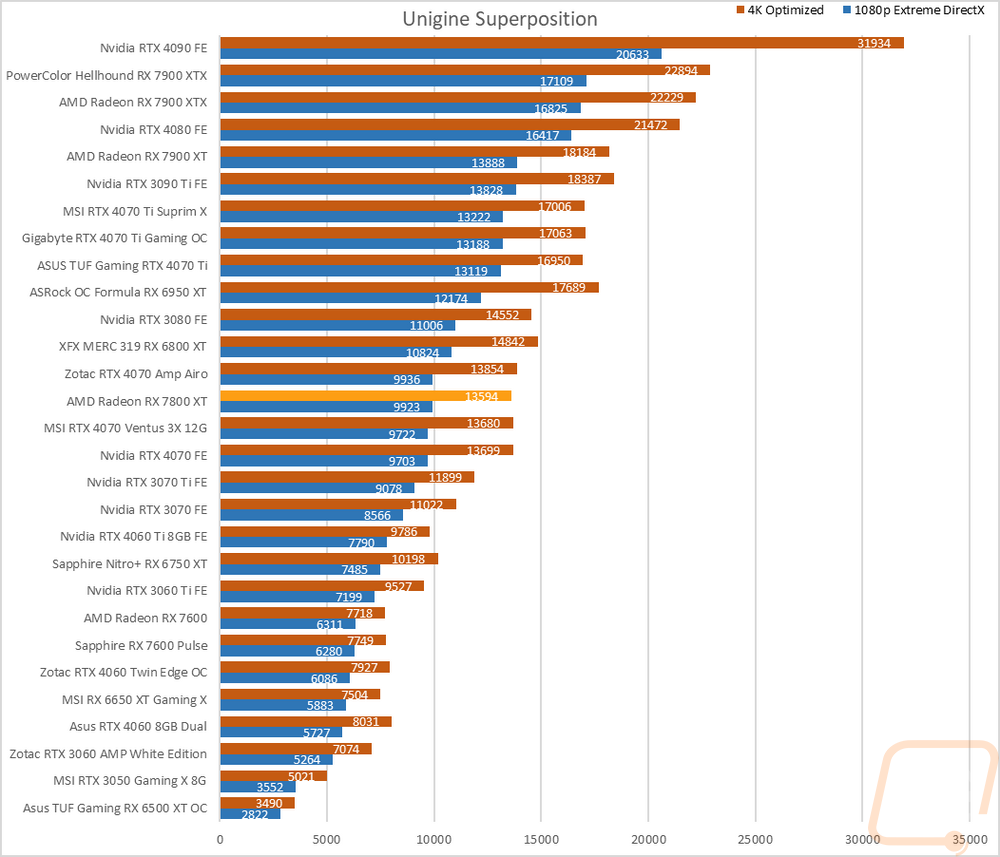
The last test was using the Unigine-based Superposition benchmark and I tested at 1080p with the extreme detail setting as well as the 4K optimized setting. In the extreme detail setting the Radeon RX 7800 XT is running right in the middle of the RTX 4070’s with it being just a hair behind on the 4K Optimized test and ahead on the 1080p Extreme benchmark. The overclocked 6800 XT on the other hand is up ahead of both the Radeon RX 7800 XT and the 4070.
VR Benchmarks
As for Virtual Reality, I love it but it is more demanding than traditional gaming. This is partially because of the resolutions needed to render for two eyes and because they render more than what is immediately visible. But also because of post effects to get the proper “fisheye” effect for it to look proper in your eyes with the HMD. You also have to have much higher expectations for frame rates in VR, skipping frames or lower FPS can cause motion sickness in VR. Because of that, I ran a few tests.
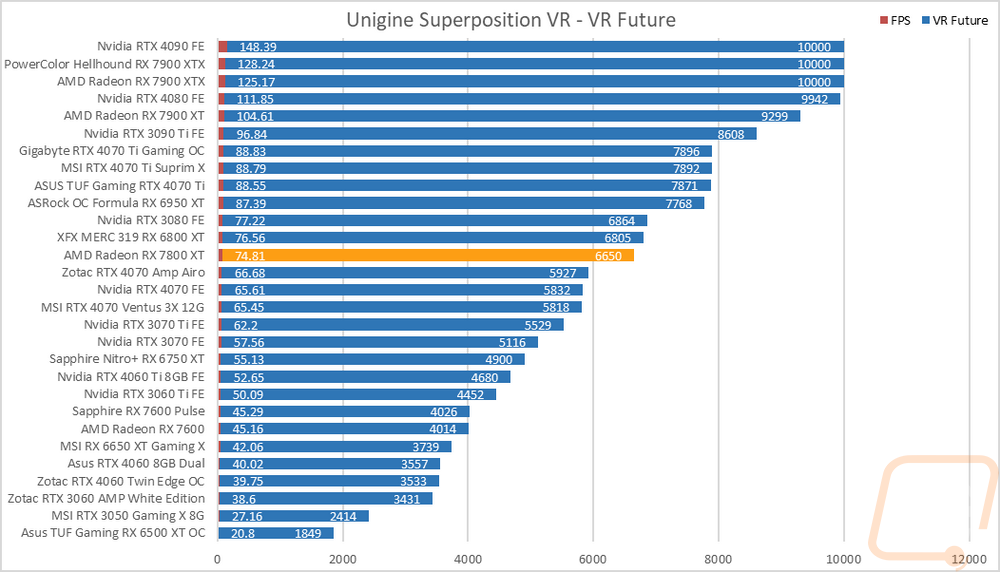
My first test was again in Superposition. This time I tested the VR Future test using the Oculus resolution. I have also included the average frame rate as well which is important for the cards at the top of the chart because for some reason Superposition is capped at 10,000 for its scores and that doesn’t show the performance gap in those cards at the top. The Radeon RX 7800 XT put the RTX 4070s well behind it here but even still the RX 6800 XT is still in front but this time around the gap is small, especially once we also figure in our 6800 XT is overclocked where the Radeon RX 7800 XT is stock clocked.
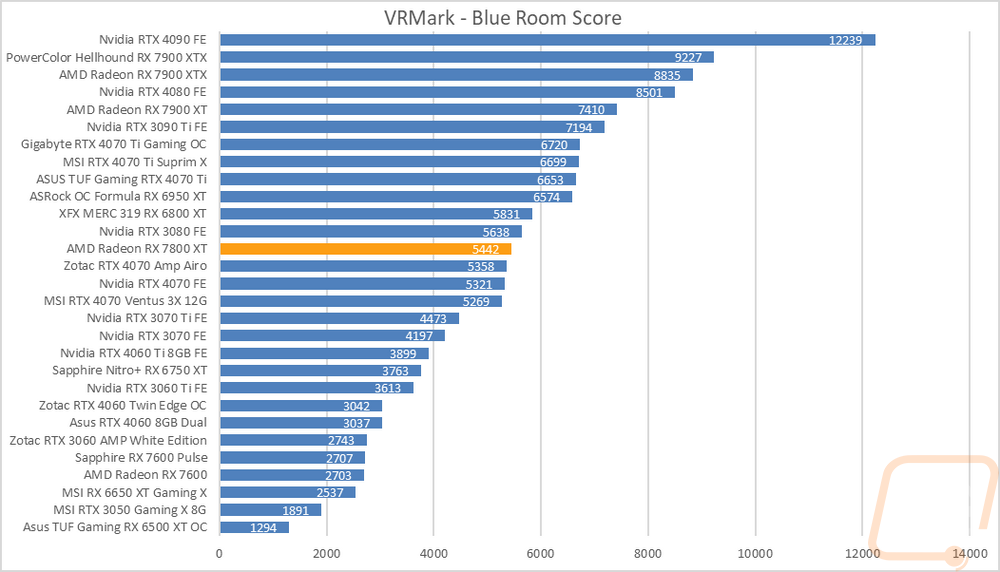
My second round of VR testing was in VRMark which has three tests that are similar to the VR tests in Superposition. I only focused on just the most demanding test called Blue Room which is looking more at future VR performance. For this VR test, the Radeon RX 7800 XT and the 4070s are a lot closer but it is still in front but behind the RTX 3080 and the 6800 XT.
In-Game Benchmarks
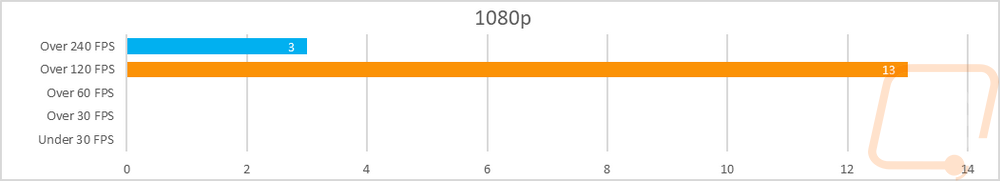
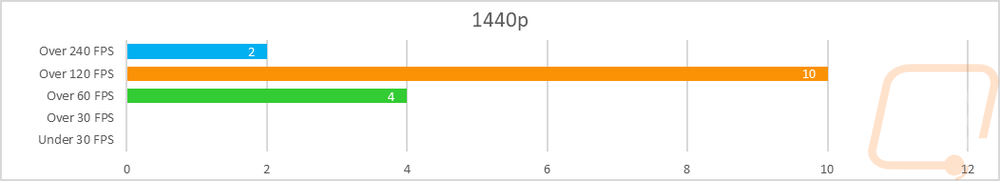
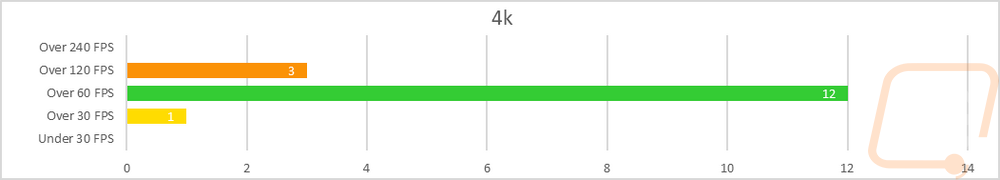
Now we finally get into the in game performance and that is the main reason people pick up a new video card. To test things out I ran through our new benchmark suite that tests 10 games at three different resolutions (1080p, 1440p, and 4k). Most of the games tested have been run at the highest detail setting and a mid-range detail setting to get a look at how turning things up hurts performance and to give an idea of if turning detail down from max will be beneficial for frame rates. In total, each video card is tested 48 times and that makes for a huge mess of results when you put them all together. To help with that I like to start with these overall playability graphs that take all of the results and give an easier-to-read result. I have one for each of the three resolutions and each is broken up into four FPS ranges. Under 30 FPS is considered unplayable, over 30 is playable but not ideal, over 60 is the sweet spot, and then over 120 FPS is for high refresh rate monitors.
So how did the Radeon RX 7800 XT do? Well AMD has this targeted at 1440p performance but I think the most surprisingly thing is its performance at 4K. At 4K the Radeon RX 7800 XT had three of the results average over 120 FPS then 12 results were in the 60-119 range. This left just one result to be playable but not smooth in the 30-59 FPS range. At 1440p performance was even better of course. At 1440p everything came in over 60 FPS but just 4 results were in that 60-119 FPS range, most were over 120 FPS with 10 in that range and there were even two that were over 240 FPS. Then at 1080p, everything performed well into the high refresh rate range with all of the results over 120 FPS and 3 reaching 240 FPS and in this case, almost all of the results were CPU limited.
Of course, I have all of the actual in game results as well for anyone who wants to sort through the wall of graphs below. I have also put together the total averages for a list of cards which include all of our results except for CS:GO which would skew the results. This gives us a great look at how the Radeon RX 7800 XT compares to all of the cards around it. The 1080p results don’t mean too much, a lot of those are CPU limited but looking at the 1440p and 4k results we can see that the 7800 XT outperforms the RTX 4070 by 9 FPS at 1440p and 6 FPS at 4K. The gap is even larger once you look at the 6750 XT. But as we have seen in the other tests, the 6800 XT does outperform the 7800 XT across the board. This is going to be controversial given that going off of the model name this is the next generation up. But AMD is targeting the 7800 XT as a replacement for the RX 6800. Like with a lot of Nvidia’s cards, AMD seems to be shuffling things around slightly and this is always a big sticking point for shoppers. Diving into the main graphs they mostly tell the same story. But in some games like Watch Dogs, Total War: Three Kingdoms, and Far Cry 6 the 7800 XT is behind the 6800 XT in the lower detail but catches up or passes the 6800 XT at the higher detail settings.
|
|
1080p |
1440p |
4K |
|
XFX MERC 319 RX 6800 XT |
197.1 |
162.3 |
92.4 |
|
Radeon RX 7800 XT |
190.7 |
156.3 |
89.3 |
|
Nvidia RTX 4070 FE |
190.6 |
147.6 |
83.5 |
|
Sapphire Nitro+ RX 6750 XT |
165.2 |
119.4 |
64.5 |
|
Nvidia RTX 4060 Ti 8GB FE |
160.1 |
115.3 |
62.0 |
|
Zotac RTX 4060 Twin Edge OC |
135.7 |
94.5 |
50.1 |
Compute Benchmarks
Now some people don’t need a video card for gaming, they need the processing power for rendering or 2D/3D production, or in some cases, people who game also do work on the side. So it is also important to check out the compute performance on all of the video cards that come in. That includes doing a few different tests. My first test was a simple GPU Compute benchmark using PassMark's Performance Test 10 and the Radeon RX 7800 XT scored a 16158. This put it right in between AMD's last generation cards with it ahead of the RX 6800 XT and behind the 6950 XT. All of the 4070s were ahead here but the Radeon RX 7800 XT was well out in front of the RTX 4060 Ti.
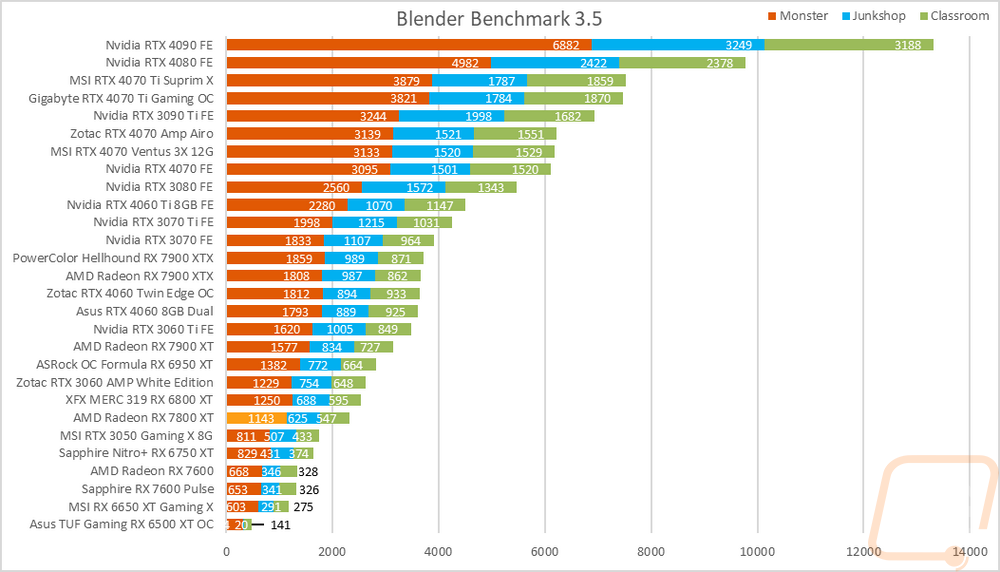
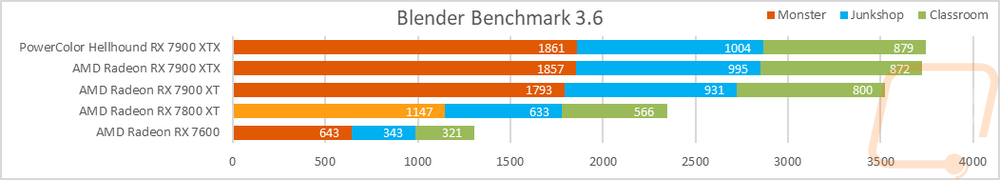
Blender is always my favorite compute benchmark because the open-source 3D rendering software is very popular and it isn’t a synthetic benchmark. With the latest version of Blender, they redid the benchmark so we now have a new test that runs three different renderings and gives each a score. I have all three stacked together so we can see the overall performance. I tested the Radeon RX 7800 XT in both Blender 3.5 and the newer Blender 3.6. In 3.5 we get a good look at how it stands against the competition and the Radeon RX 7800 XT is sitting behind the 6800 XT. Comparing against Nvidia is a lot harder because the Radeon RX 7800 XT’s closest Nvidia card is the RTX 3060 which is ahead of the 6800 XT. This is an area where Nvidia is way ahead because of the performance of Optix.
Cooling Noise and Power
For my last few tests, rather than focusing on in game performance, I like to check out other aspects of video card performance. These are also the most important ways to differentiate the performance between cards that have the same GPU. To start things off I took a look at power usage.
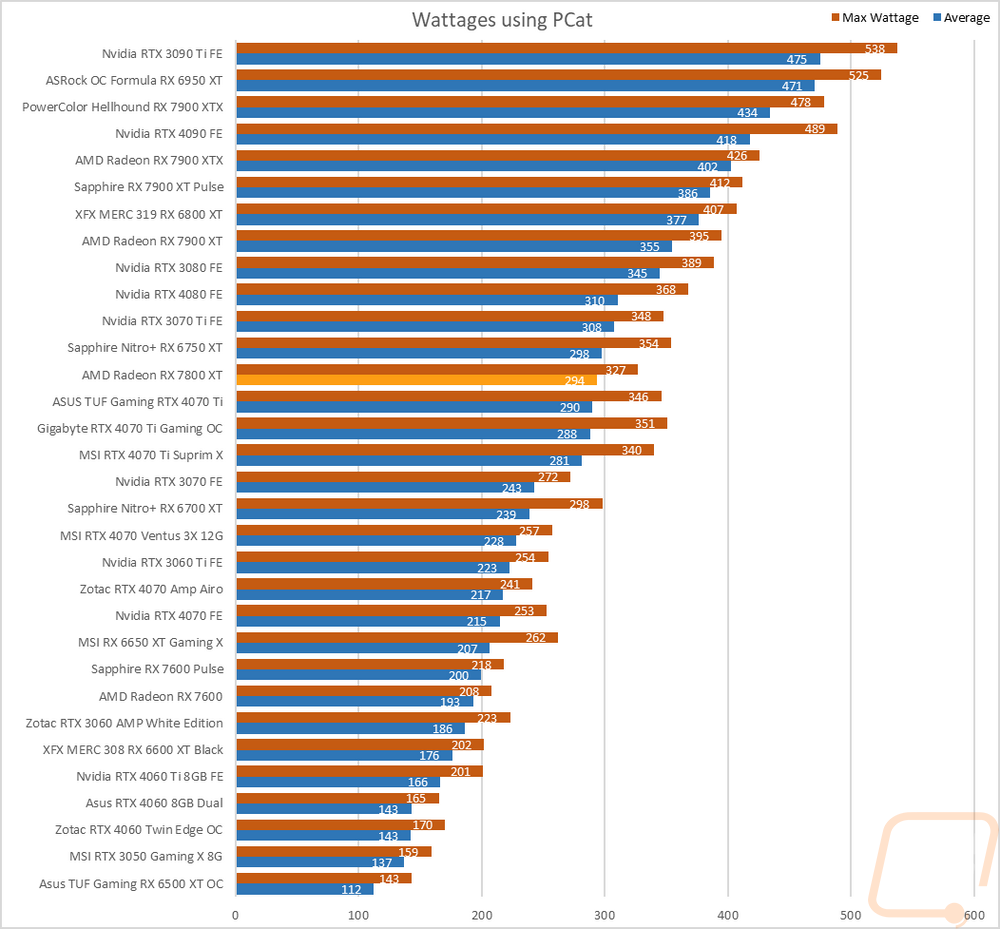
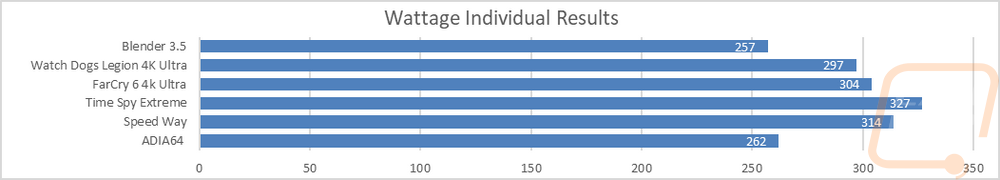
For this, our new test setup utilizes the Nvidia-designed PCat v2 along with cables to handle both traditional 6 or 8-pin connections as well as the new 12VHPWR. The PCat also utilizes a PCIe adapter to measure any power going to the card through the PCIe slot so we can measure the video card wattage exclusively, not the entire system as we have done in the past. I test with a mix of applications to get both in game, synthetic benchmarks, and other workloads like Blender and AIDA64. Then everything is averaged together for our result. I also have the individual results for this specific card and I document the peak wattage result as well which is almost always Time Spy Extreme. The Radeon RX 7800 XT peaked at 327 watts in Time Spy Extreme but averaged 294 watts across the test. That puts it 83 watts on the average lower than the 6800 XT but the RTX 4070 was 79 watts below the 7800 XT.
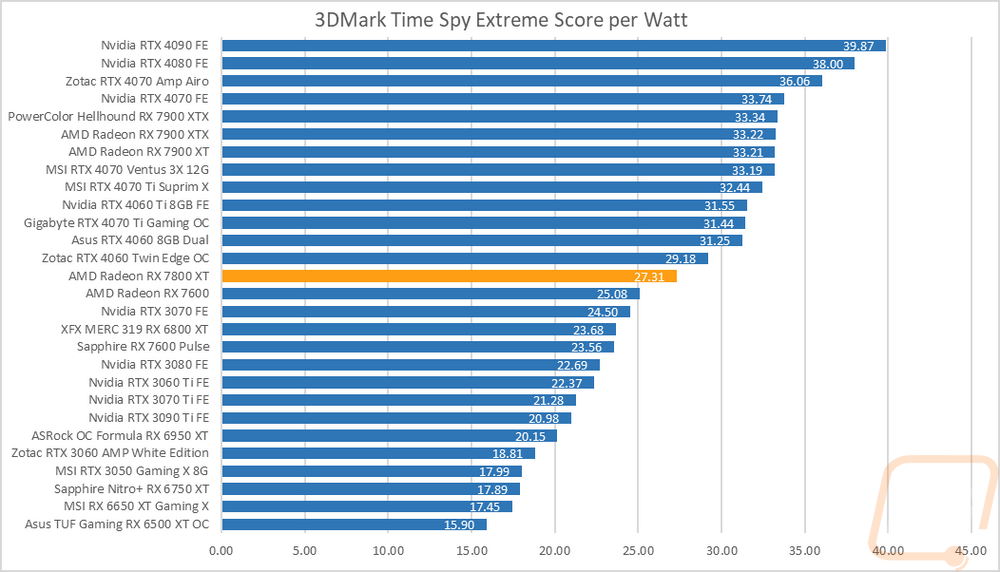
Having exact peak wattage numbers when running Time Spy Extreme I was also able to put together a graph showing the total score for each watt that a card draws which gives us an interesting look at overall power efficiency in the popular and demanding benchmark. This graph does a better job of showing the overall efficiency. Given that the in our tests was just behind the 6800 XT and ahead of the RTX 4070 it is now surprising that the 4070 is up near the top, the 7800 XT is in the middle, and the 6800 XT is down lower.
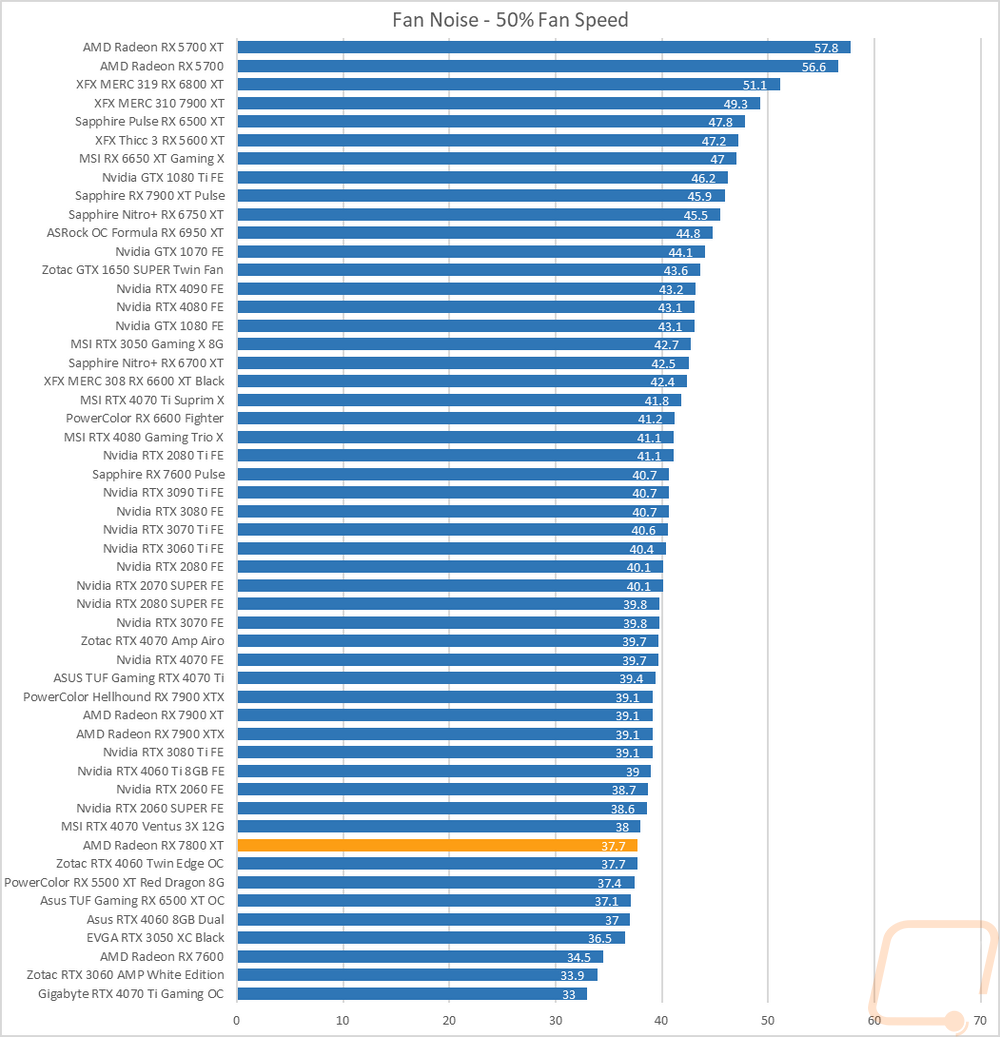
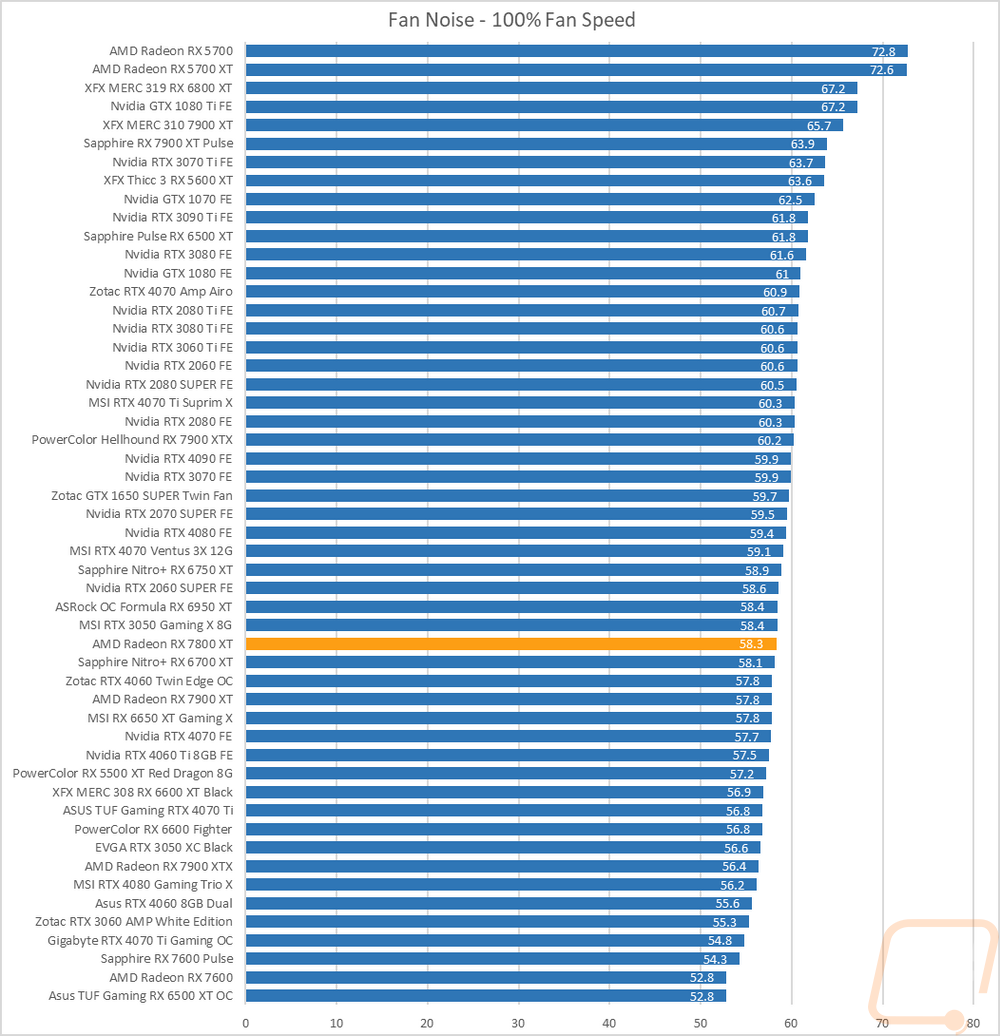
My next round of tests were looking at noise levels. These are especially important to me because I can’t stand to listen to my PC whirling. Especially when I’m not in game and other applications are using the GPU. For my testing, though I first tested with the fan cranked up to 100% to get an idea of how loud it can get, then again at 50% to get an idea of its range. The Radeon RX 7800 XT did well here with its two-fan configuration. At 50% fan speed, it came in at 37.7 decibels, this was 2 decibels lower than the 4070 Founders Edition from Nvidia and 1.4 dB lower than the triple fan reference cooler on the 7900 XT. At 100% fan speed it moved up in the charts slightly with its 58.3 dB noise level. At 100% the 4070 Founders Edition is quieter and the 7900 XT reference card was also a little quieter, surprisingly.
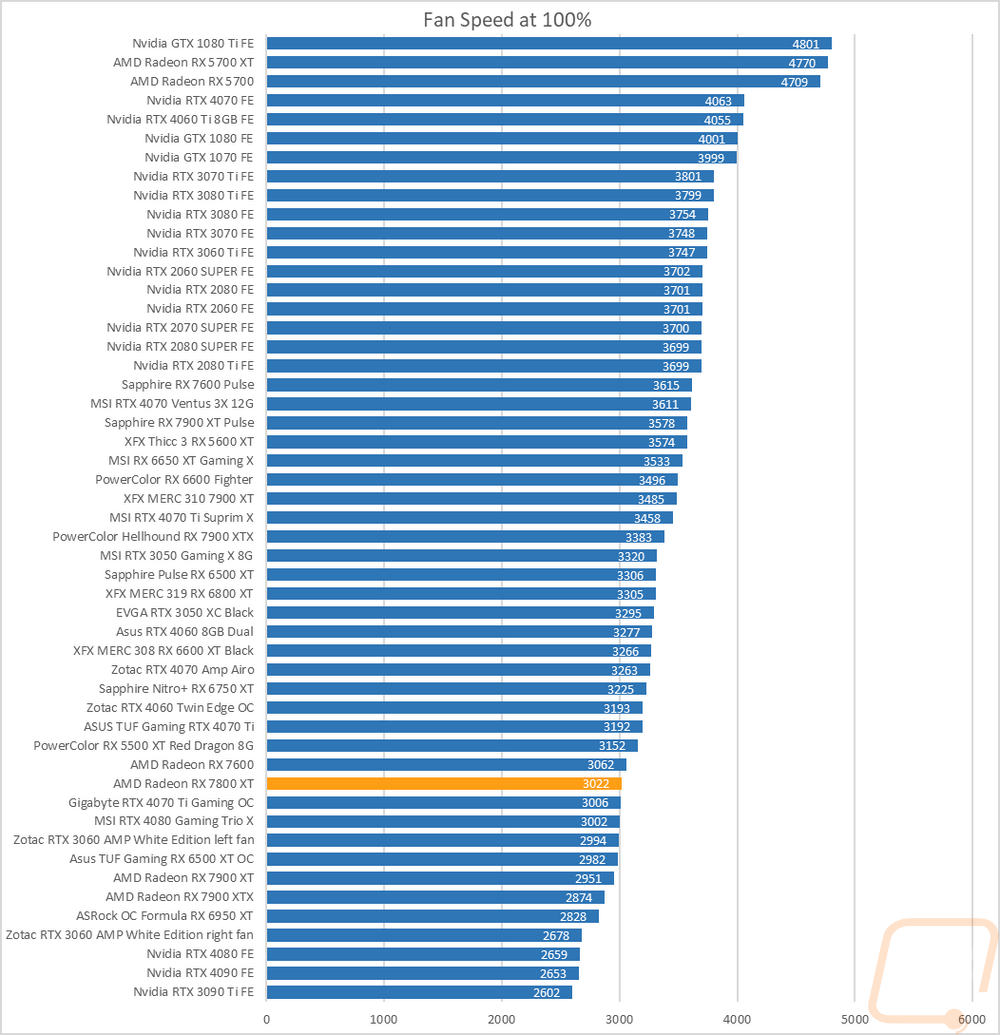
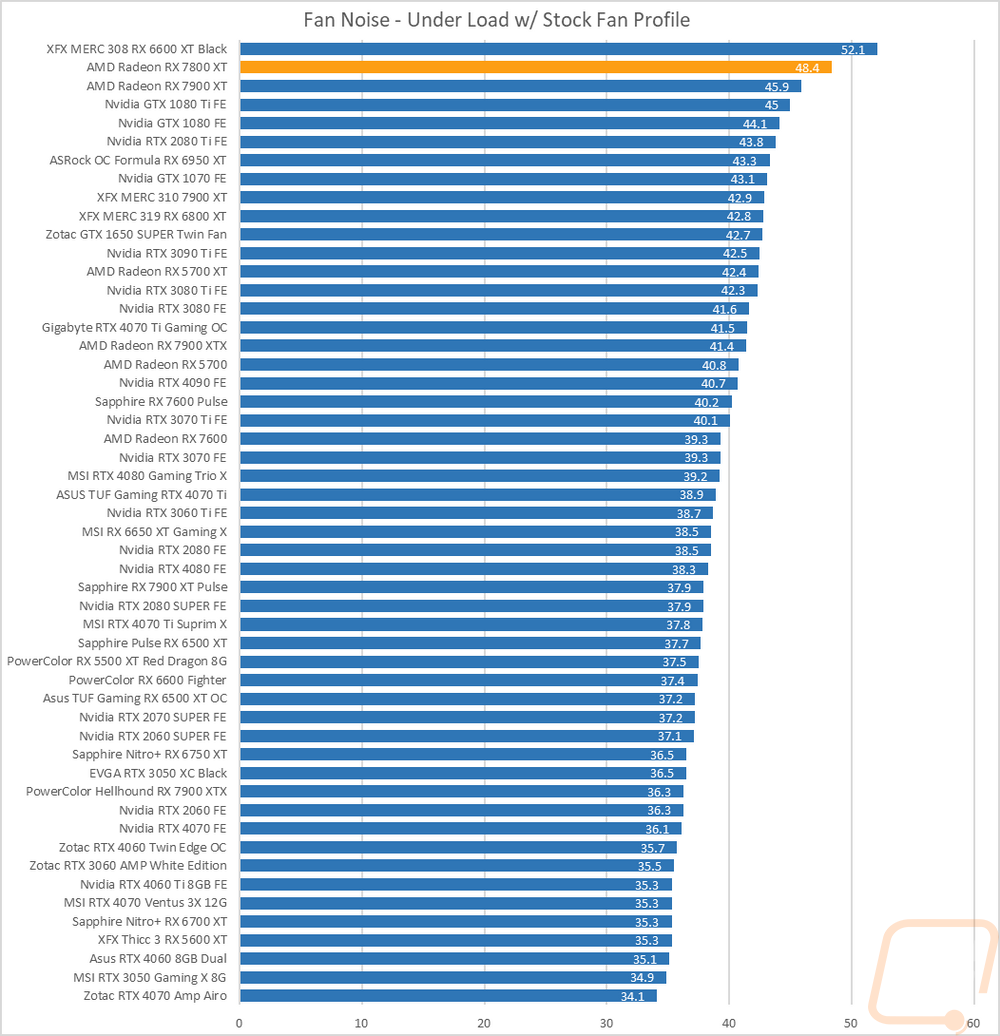
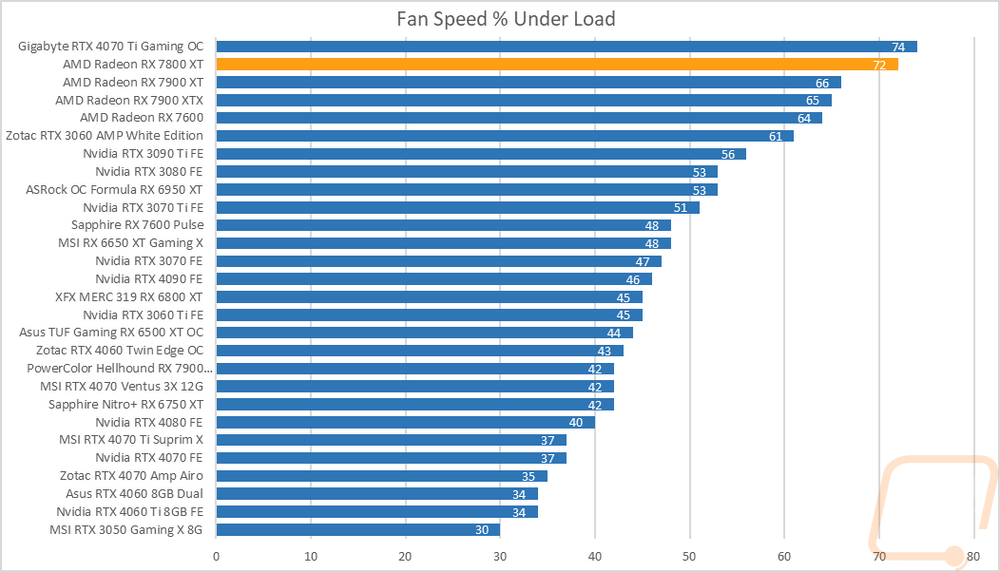
I also take a look at noise performance while under load. For that when running AIDA64’s stress test I wait until the temperature of the card has leveled off and then measure how loud things are when the card is at its worst-case scenario with the stock fan profile. Here the Radeon RX 7800 XT is up at the top of the chart and not in the good way. While under load it was noticeably louder than most other cards tested. Looking at the fan speeds which are also up near the top at 72% fan speed the stock fan profile is either aggressive or the card is running really hot and compensating for it. (Don’t worry we look at that next)
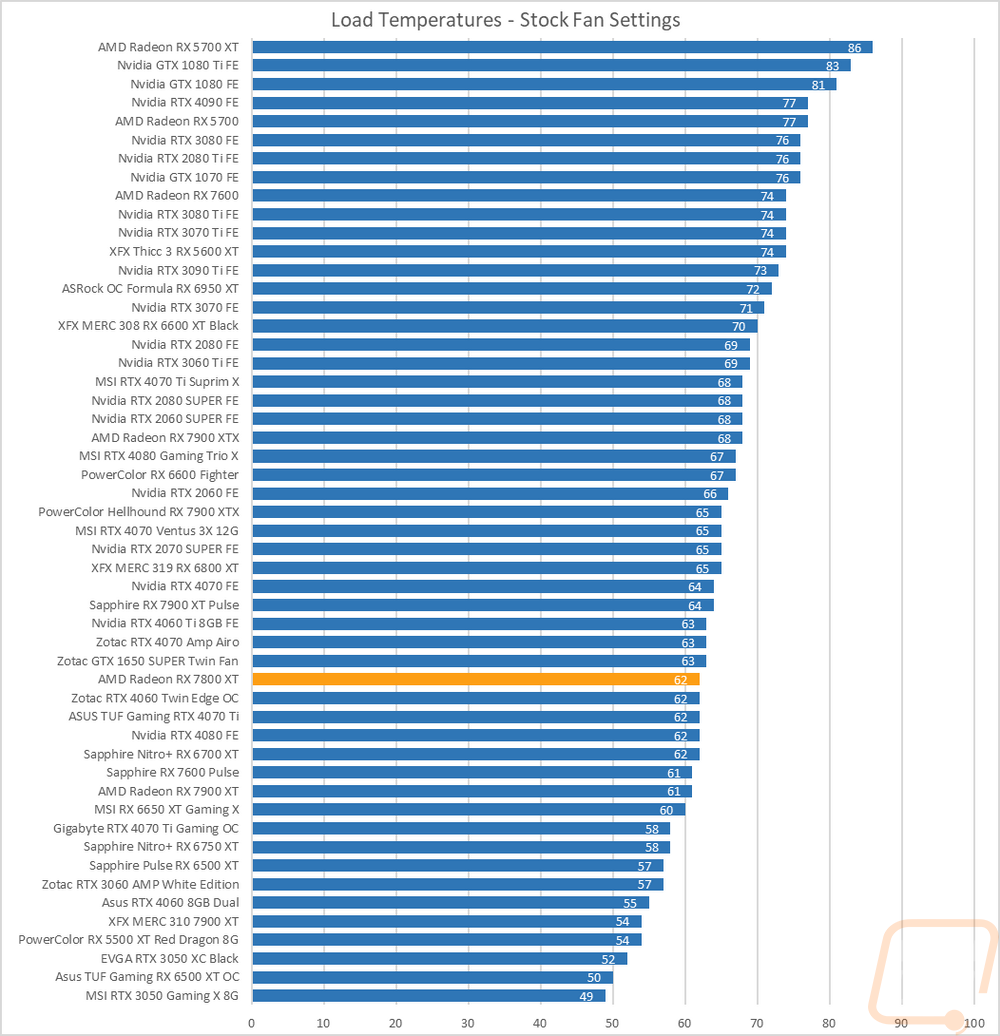
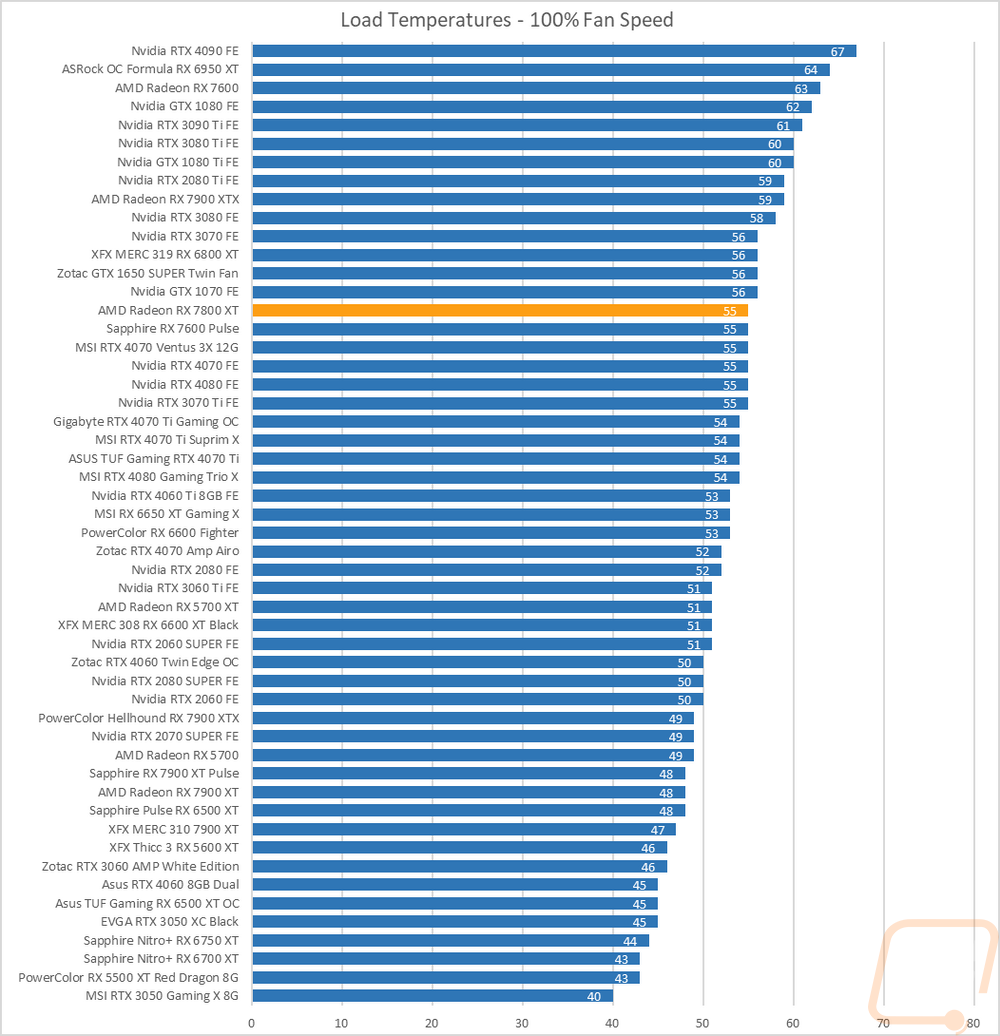
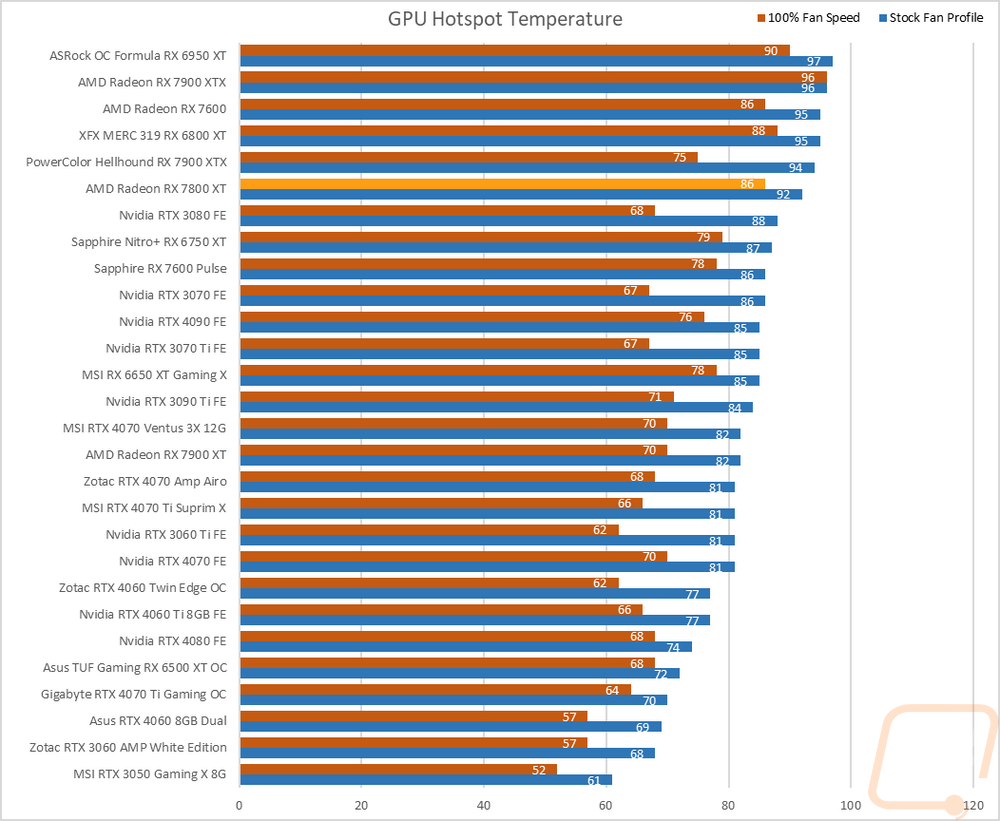
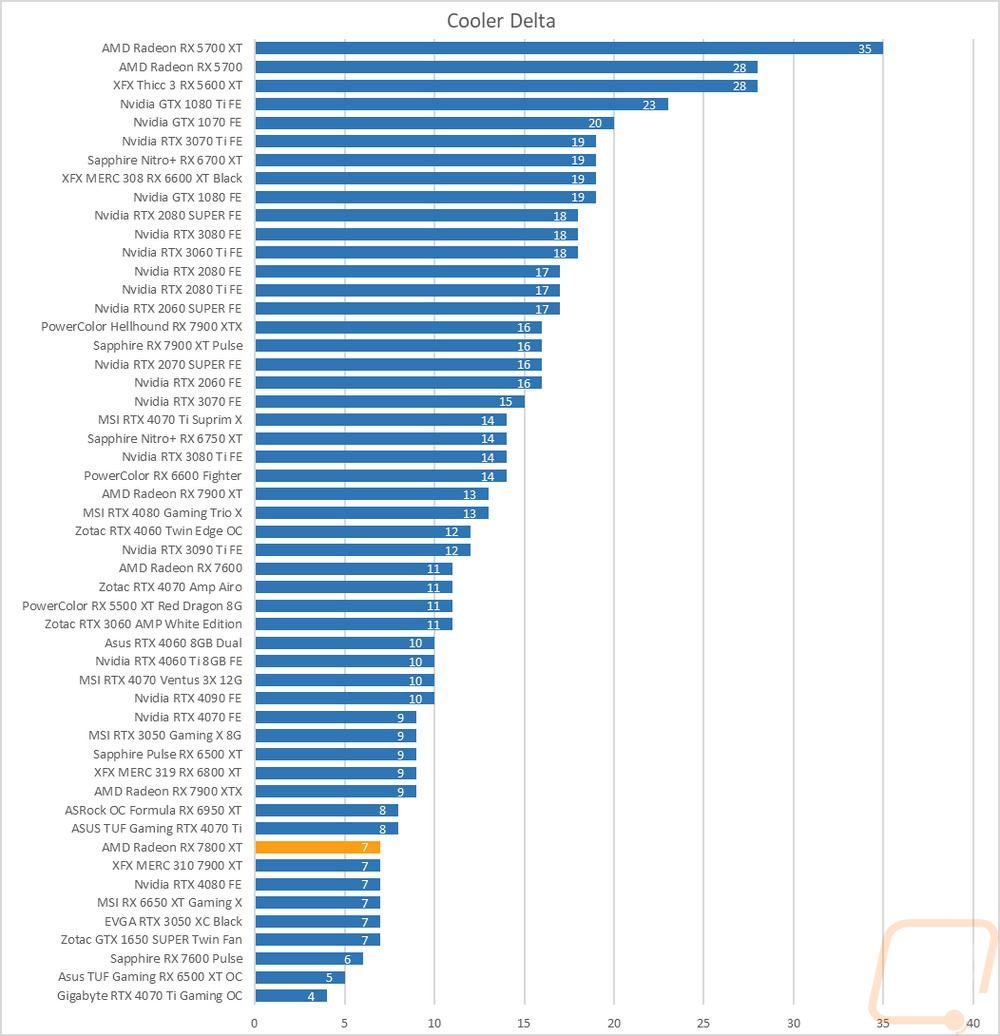
To finish up my testing I of course had to check out the cooling performance. To do this I ran two different tests. I used AIDA64’s Stress Test run for a half-hour each to warm things up. Then I documented what temperature the GPU leveled out at with the stock fan profile and then again with the fans cranked up to 100%. With the stock profile, the Radeon RX 7800 XT came in at 62c which was a lot lower than I expected after doing our noise tests and seeing just how high the fan profile had the fans running under load. The Radeon RX 7800 XT reference design is compact, not a thick/tall card like a lot of the partner card designs so 62c with that design is better than it should be really and that fan profile could be tuned to run a lot quieter without putting the Radeon RX 7800 XT up at the top of the chart. At 100% fan speed the Radeon RX 7800 XT is up in the top 1/3 of the chart which is more in line where I would expect it to be and is right with the RTX 4070 FE. I did also check GPU hotspot temperatures and I would normally check out memory temps as well but AMD doesn’t include support for those readings. The GPU hotspots for the Radeon RX 7800 XT with the stock fan profile were at 92c which is warmer than I would like. At 100% fan speed they did drop down to 86c but even that result is in the top few cards. Because of the aggressive fan profile, the delta between our stock fan profile and 100% fan speed results were 7c.
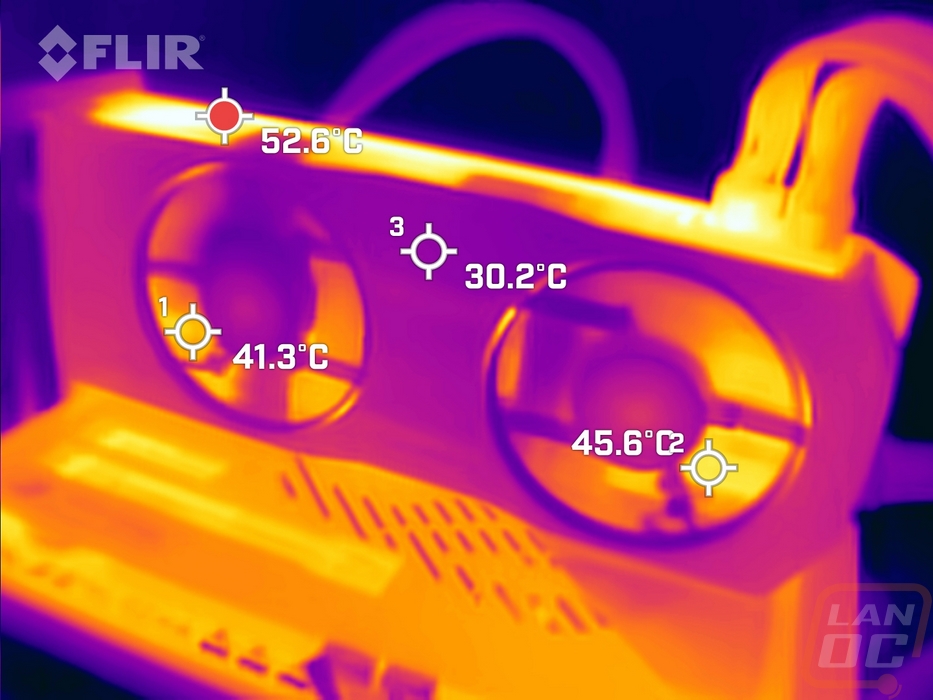
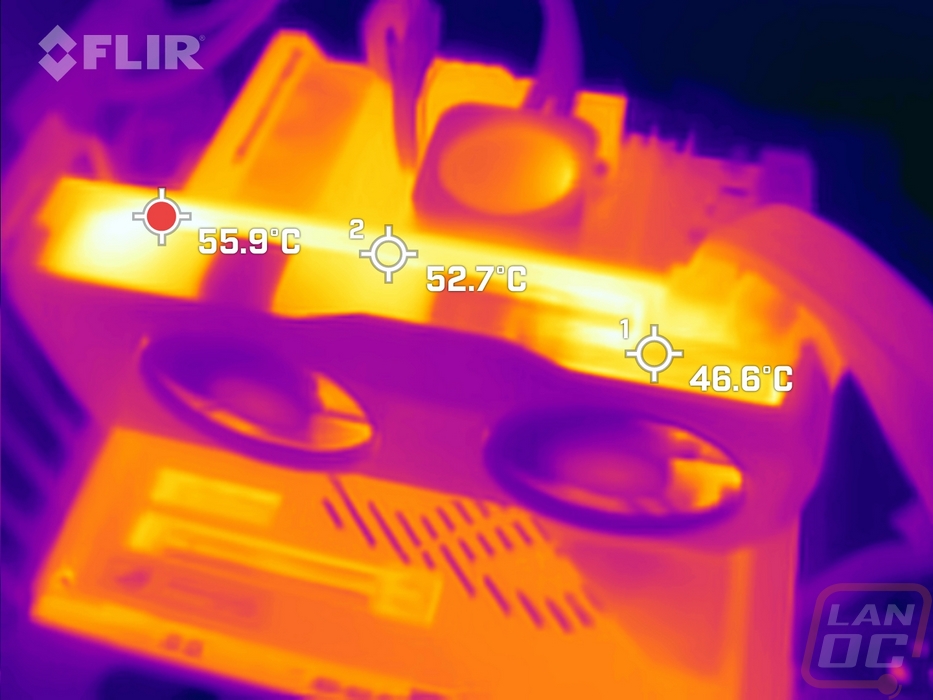
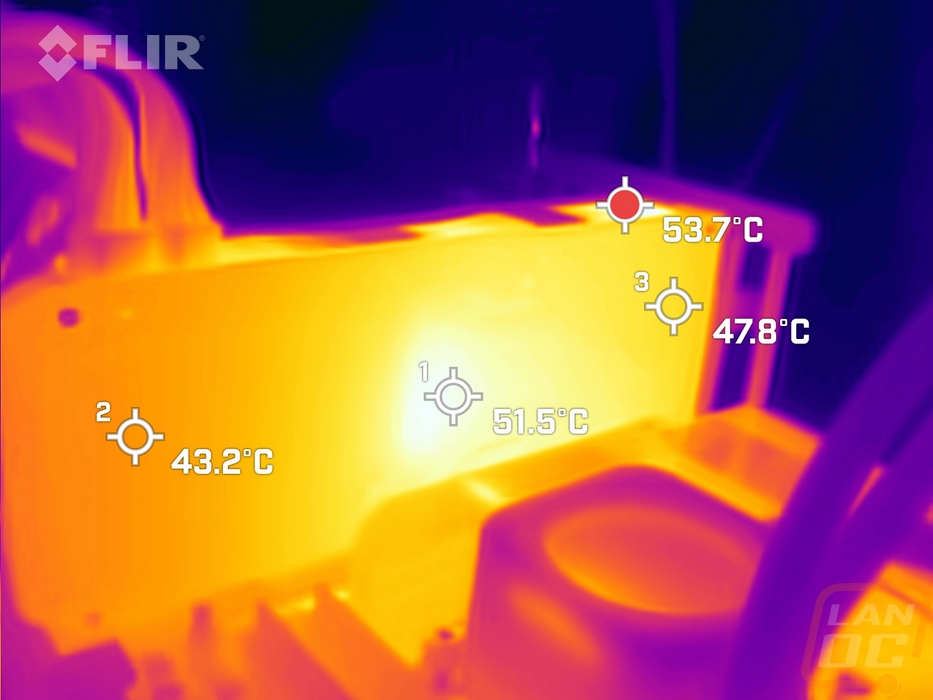
While running the stock fan profile testing I also took the time to get a few thermal images so we could see what is going on. The Radeon RX 7800 XT with its metal housing does heat up, especially given the numbers we saw above in the testing. The fan side of the card has the shroud at 30c which isn’t bad at all and the hottest areas behind the fans in the heatsink are at 45c. Because of how tight the card sits against the built-in heatsink on our Asus Extreme motherboard you don’t see much air blowing out that direction so most of the heat is coming up out of the top of the card with that reaching 55.9c on the left side and is cooler down towards the power connections at 46c. The metal backplate is pulling a surprising amount of heat out through it in the center with that reaching 51.5c behind the GPU and it is 47c and 43c on the other ends.
Overall and Final Verdict
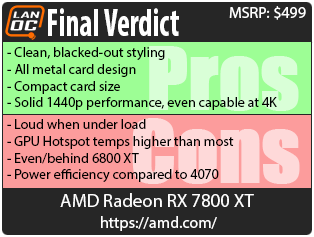
With our testing out of the way and having taken a closer look at the card design and checking out what both the new 7700 XT and 7800 XT are all about spec-wise we can finally step back and get a bigger picture on everything. For the Radeon RX 7800 XT reference card design, like with the reference 7900 XT and XTX as well as the 7600 I love the blacked-out design and the styling that AMD went with. While it isn’t a huge heatsink attached to a PCB like a lot of high-end partner cards offer. The design is a lot more premium with its all-metal shroud and backplate and a design that doesn’t feel tossed together. Sticking to a standard PCI height and not being a 3+ slot wide card (it is a 2.5 slot design) the card will fit in almost anything. Fitment doesn’t seem like something you should have to worry about, but unless you are running a huge case it is a concern with most card designs these days. The Radeon RX 7800 XT also utilizes standard PCIe power connections which means you don’t have to run an adapter or worry about upgrading your power supply. Given how much a build can cost these days, finding ways to save is always nice.
For performance, before I get into how it compares to other cards. AMD is promoting the Radeon RX 7800 XT to be a high-end 1440p option and in our testing, it handled 1440p without any issues with most situations being capable of frame rates that will work well with high refresh rate monitors. Given that the 1440p 240Hz is the sweet spot in my eyes, that is great to hear. Even if you decide to go up to 4K later the Radeon RX 7800 XT can handle that as well but high refresh rates are going to be very dependent on the game. The 7800 XT did struggle in our Blender testing, it wouldn’t be on my list if that is also important to you. As far as ray tracing and AI-based tech AMD is improving especially now with FSP 3, but Nvidia does still stand out there in those situations. Now all of that is great in a vacuum but we do have to look at the competition as well but I will get into pricing further down. The Radeon RX 7800 XT as a whole outperformed Nvidia’s RTX 4070 coming in 9 FPS higher at 1440p when our test results were averaged and that is impressive. Of course, the wet blanket on it all comes from AMD themselves with last generations 6800 XT. I didn’t have a reference 6800 XT for direct comparisons but our overclocked 6800 XT was FPS faster at 1440p than the 7800 XT. Most of that is likely the overclock. But even with matching performance, it isn’t the best optics for the next generation x800 XT to not be a step up. I mention optics because it is a little more complicated. AMD has the 7800 XT positioned as a replacement for the RX 6800, not the 6800 XT. Like Nvidia, it seems they are readjusting their card positioning. But I really wish we would see a complete reset in naming when doing it (maybe something like the 11X00 Series) to avoid any confusion.
When I got into noise and power testing, while the Radeon RX 7800 XT performed well as a whole it did struggle in the under load noise testing. The fan profile is extremely aggressive which hurt its performance there. The 7800 XT did improve on efficiency a lot compared to the 6800 XT, but the RTX 4070 still kicked its butt there. GPU hotspot temps were also higher than I would like in both the 100% fan speed test and stock fan profile testing.
As always though in most cases there aren’t really bad video cards, just bad pricing. Pricing will make or break the Radeon RX 7800 XT. Pricing will start at $499 and if we are looking to compare it against what Nvidia has going on right now that pricing looks great. The RTX 4070 is selling for $599 at the lowest, $100 more than the Radeon RX 7800 XT and that is with the 7800 XT outperforming it in most of our tests. If we closed things out on that the 7800 XT would be a solid buy, but we do have to keep in mind the RX 6800 XT as well, at least until the stock is depleted. The 6800 XT prices dropped down back in May to clear out stock ahead of these launches but there are still some available right now. Newegg seems to have a variety but on Amazon, there are only a few left. But there are some 6800 XT’s selling for $499, the same price as the 7800 XT. For those who are especially concerned with VRAM totals, those would be a good buy right now given that you get 16GB over the 7800 XT’s 12GB. AMD has also just launched their Starfield promotion which with the 6800 XT or 7800 XT you get a premium copy of Starfield which is a $99.99 value. One thing is for sure though, that deal on either card makes them a great value over the RTX 4070 currently.

Live Pricing: HERE


