In-Game Benchmarks
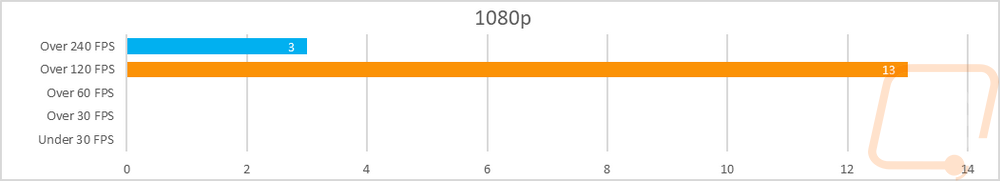
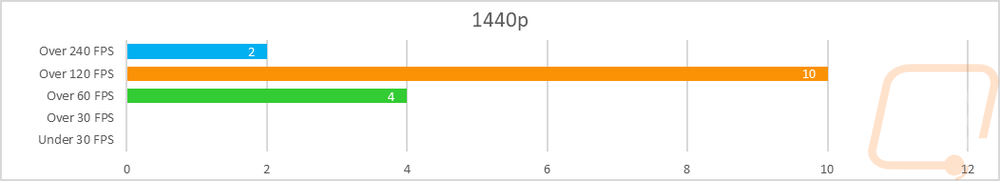
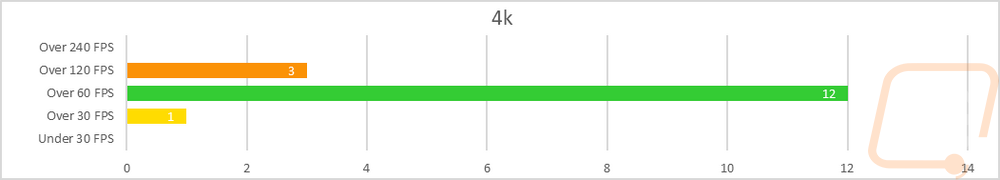
Now we finally get into the in game performance and that is the main reason people pick up a new video card. To test things out I ran through our new benchmark suite that tests 10 games at three different resolutions (1080p, 1440p, and 4k). Most of the games tested have been run at the highest detail setting and a mid-range detail setting to get a look at how turning things up hurts performance and to give an idea of if turning detail down from max will be beneficial for frame rates. In total, each video card is tested 48 times and that makes for a huge mess of results when you put them all together. To help with that I like to start with these overall playability graphs that take all of the results and give an easier-to-read result. I have one for each of the three resolutions and each is broken up into four FPS ranges. Under 30 FPS is considered unplayable, over 30 is playable but not ideal, over 60 is the sweet spot, and then over 120 FPS is for high refresh rate monitors.
So how did the Radeon RX 7800 XT do? Well AMD has this targeted at 1440p performance but I think the most surprisingly thing is its performance at 4K. At 4K the Radeon RX 7800 XT had three of the results average over 120 FPS then 12 results were in the 60-119 range. This left just one result to be playable but not smooth in the 30-59 FPS range. At 1440p performance was even better of course. At 1440p everything came in over 60 FPS but just 4 results were in that 60-119 FPS range, most were over 120 FPS with 10 in that range and there were even two that were over 240 FPS. Then at 1080p, everything performed well into the high refresh rate range with all of the results over 120 FPS and 3 reaching 240 FPS and in this case, almost all of the results were CPU limited.
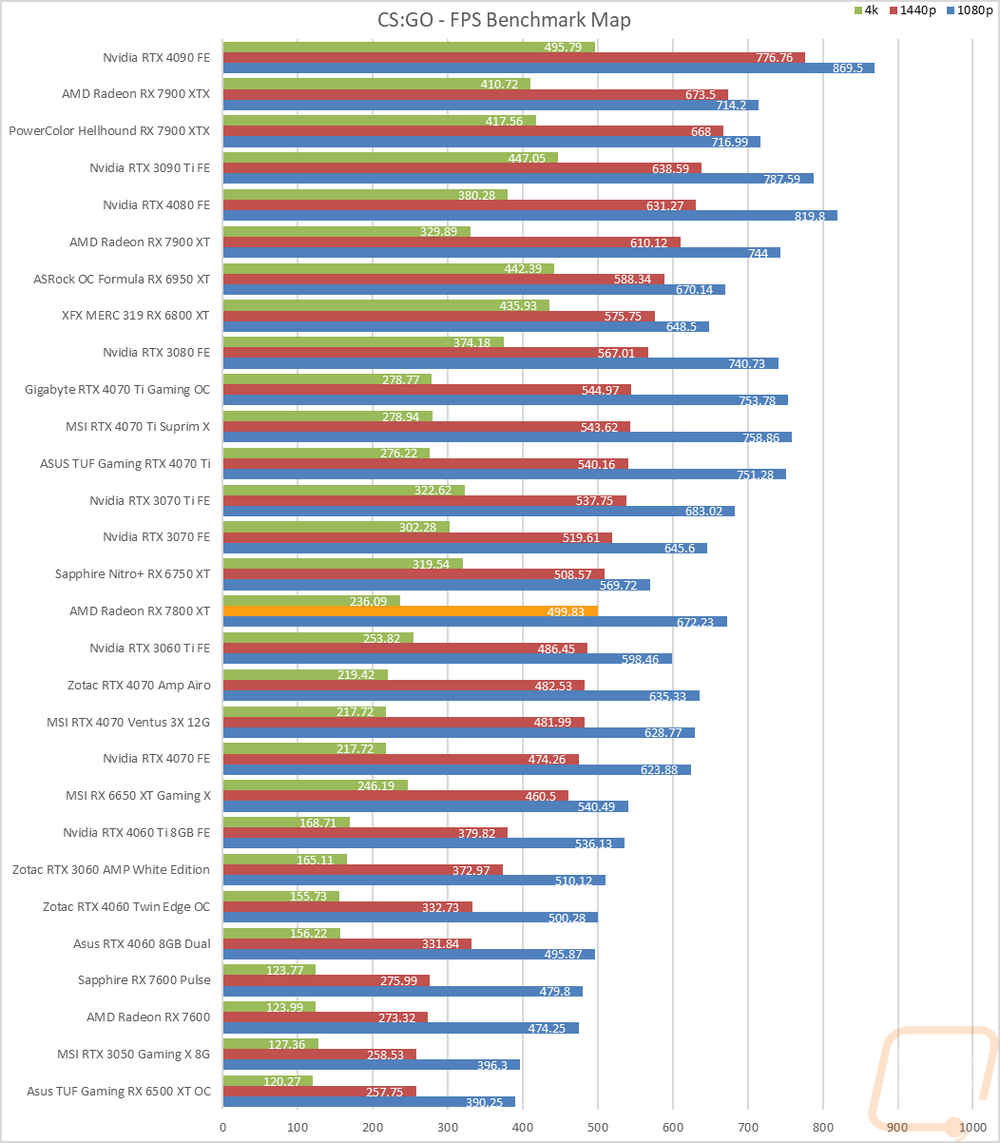
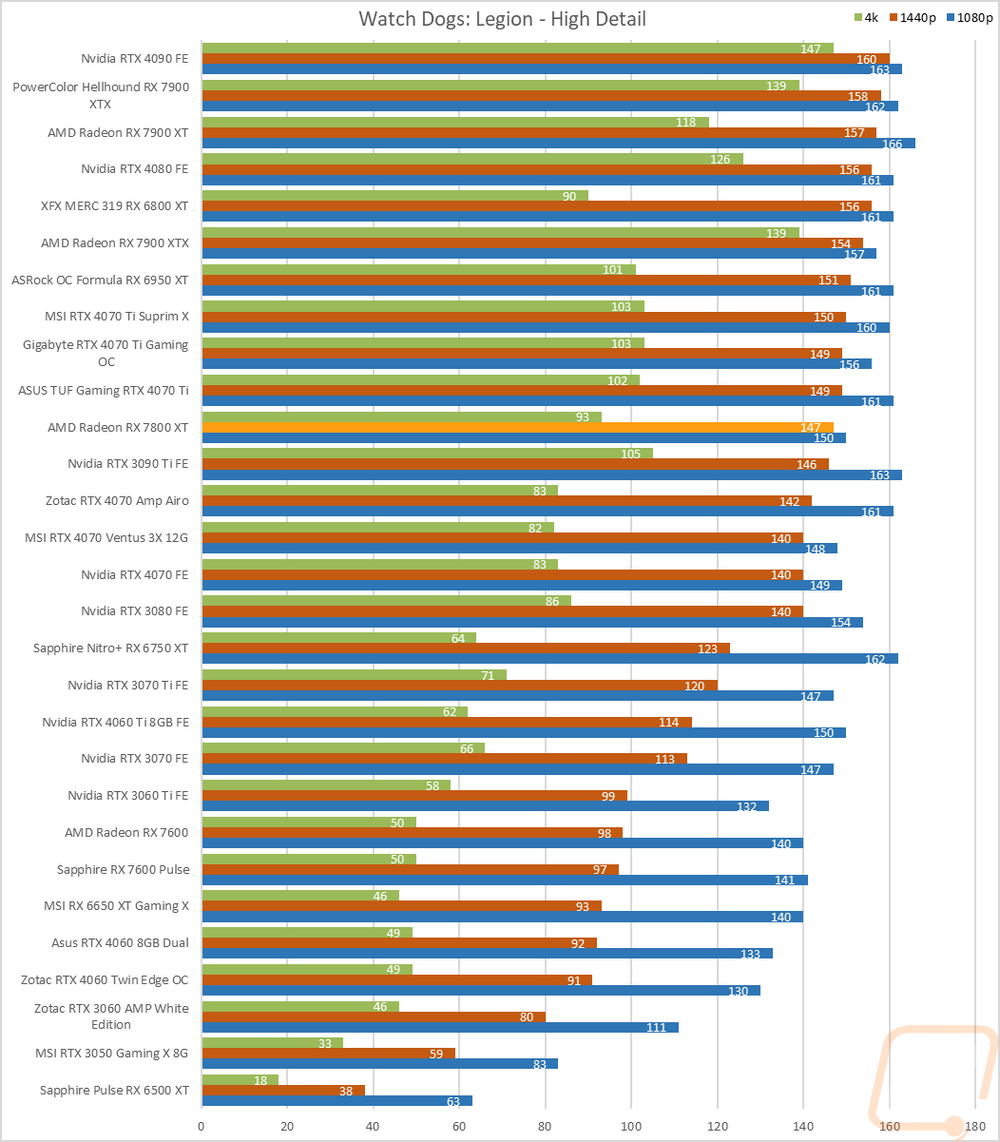
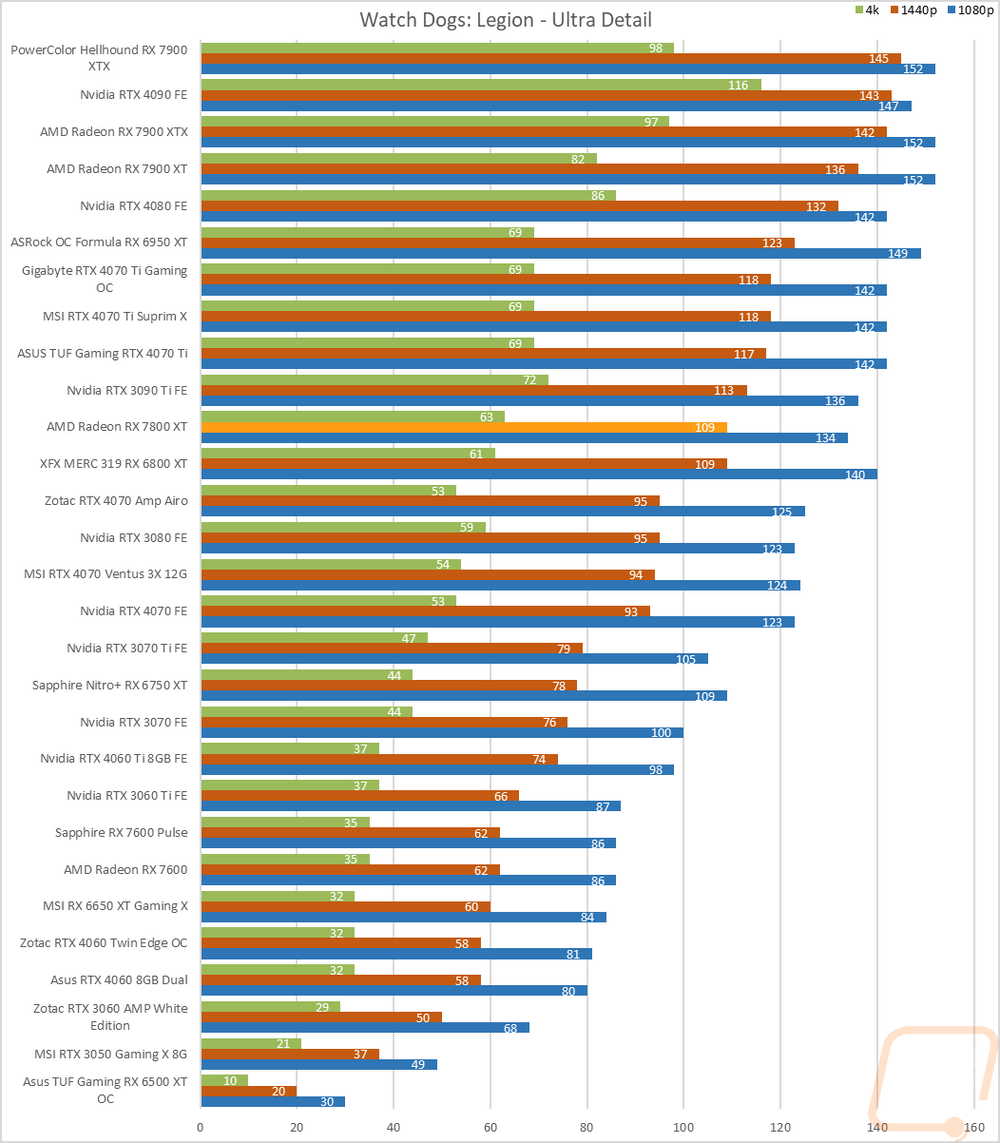
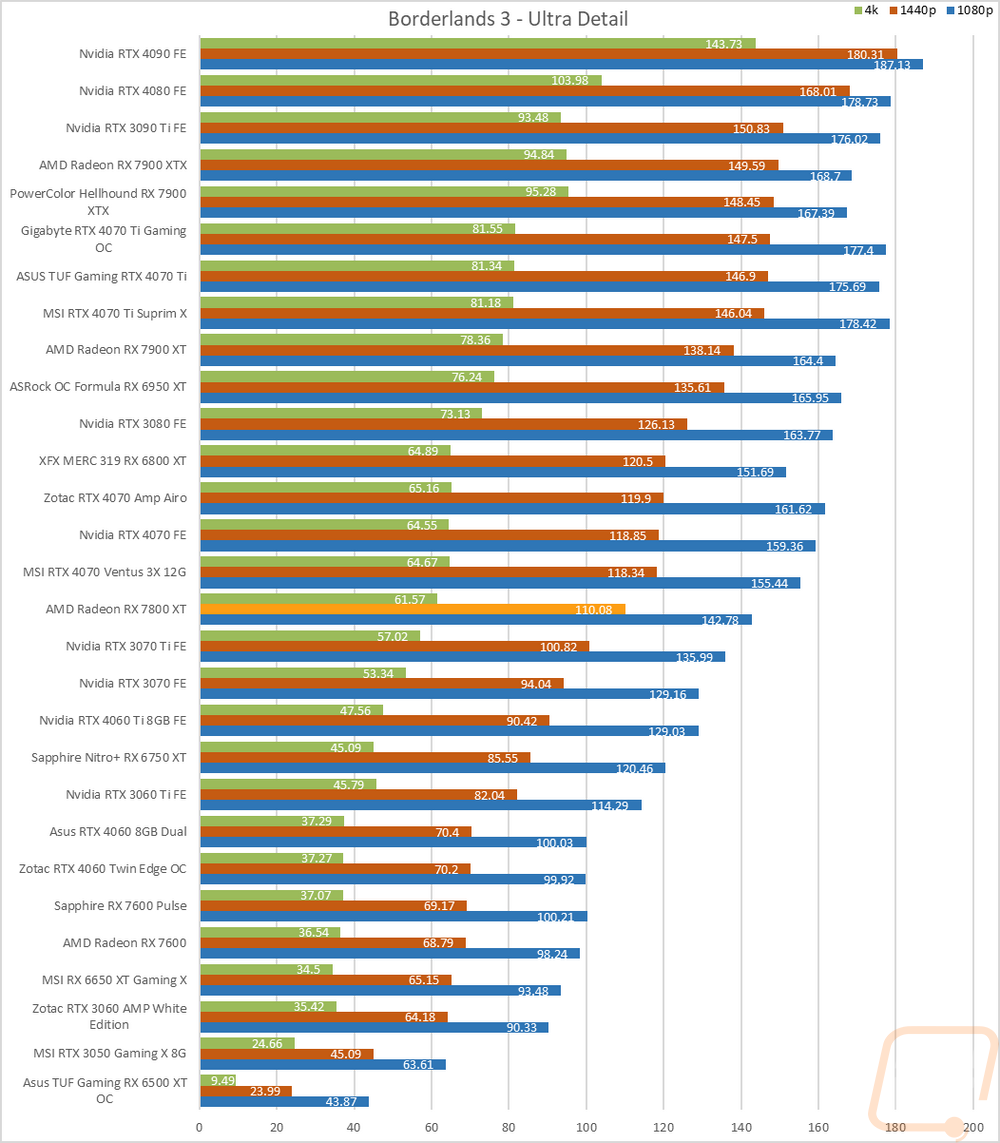
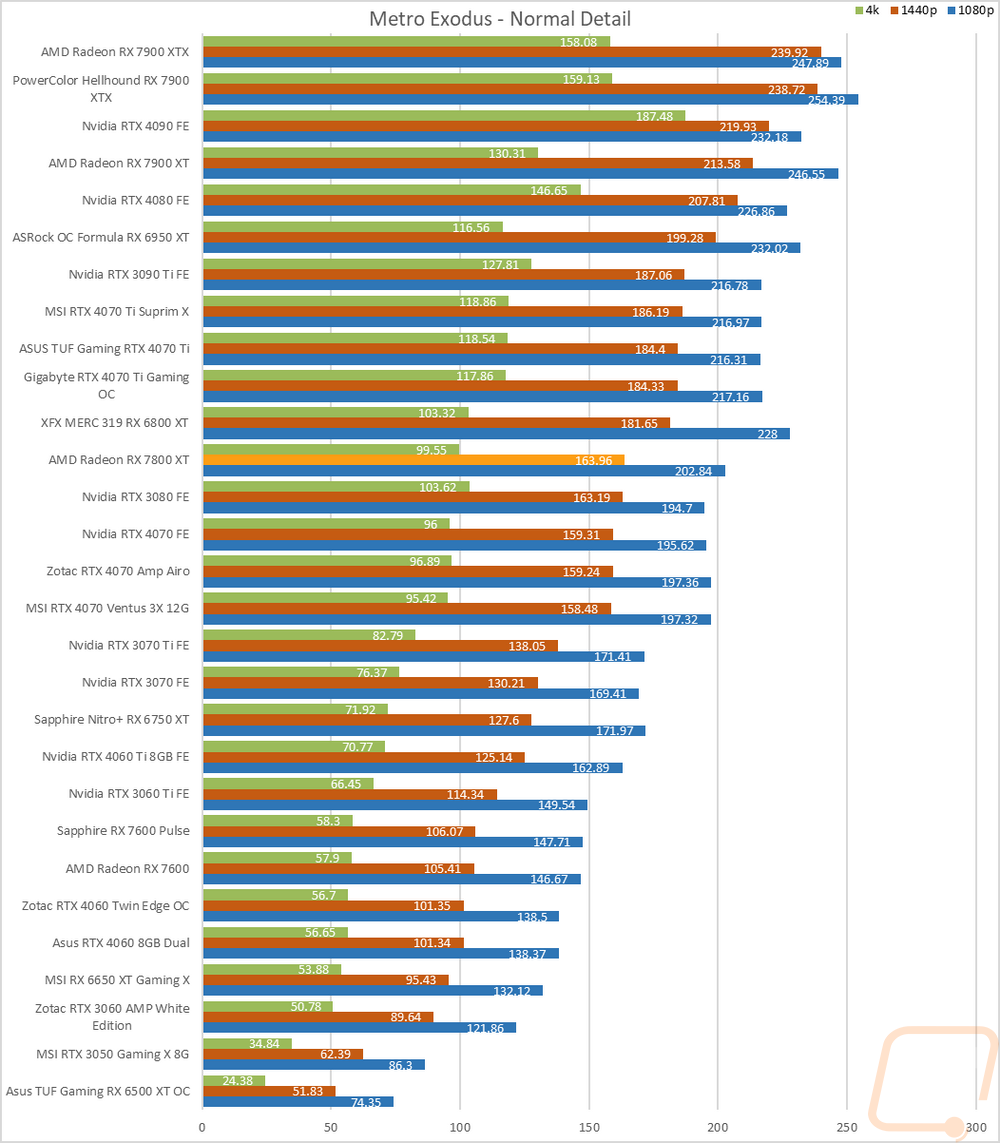
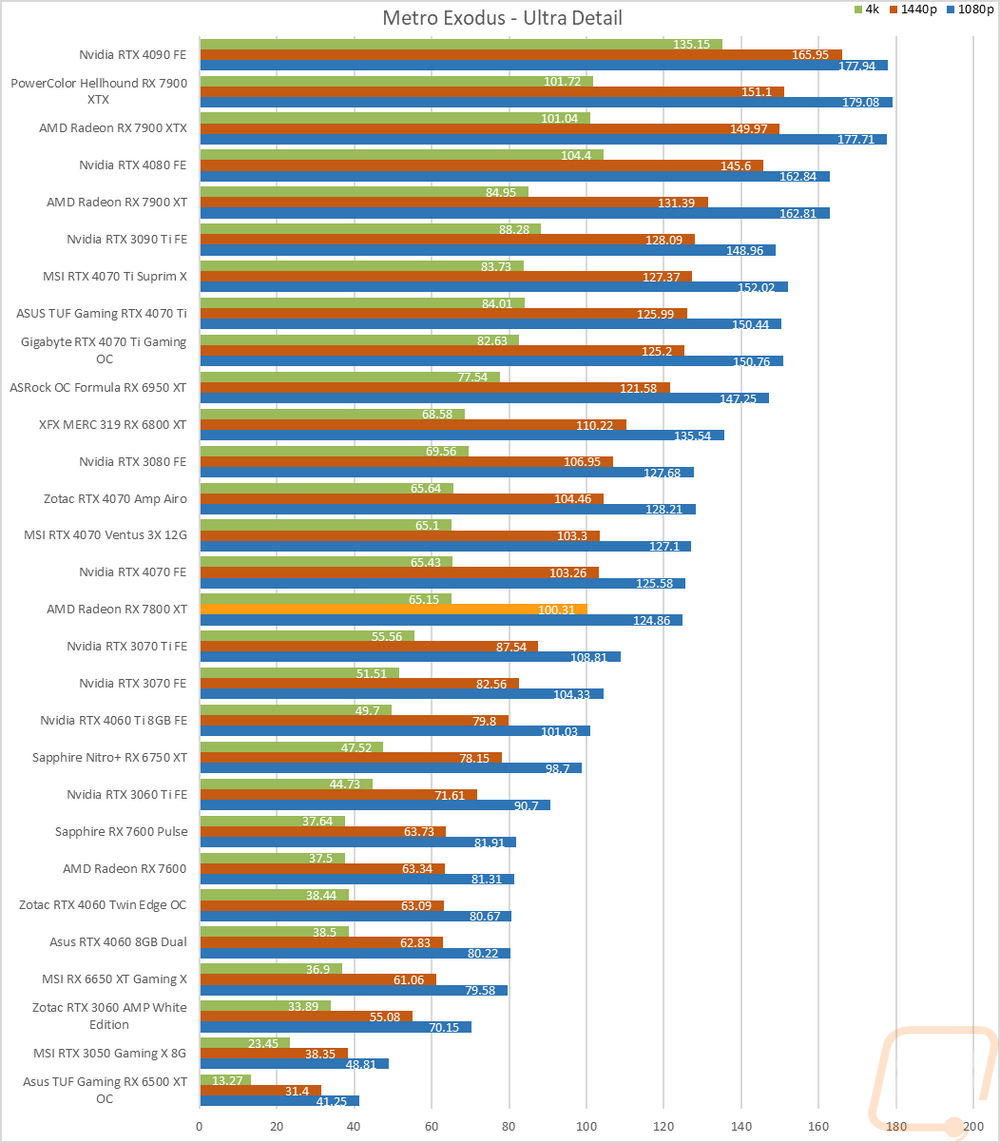
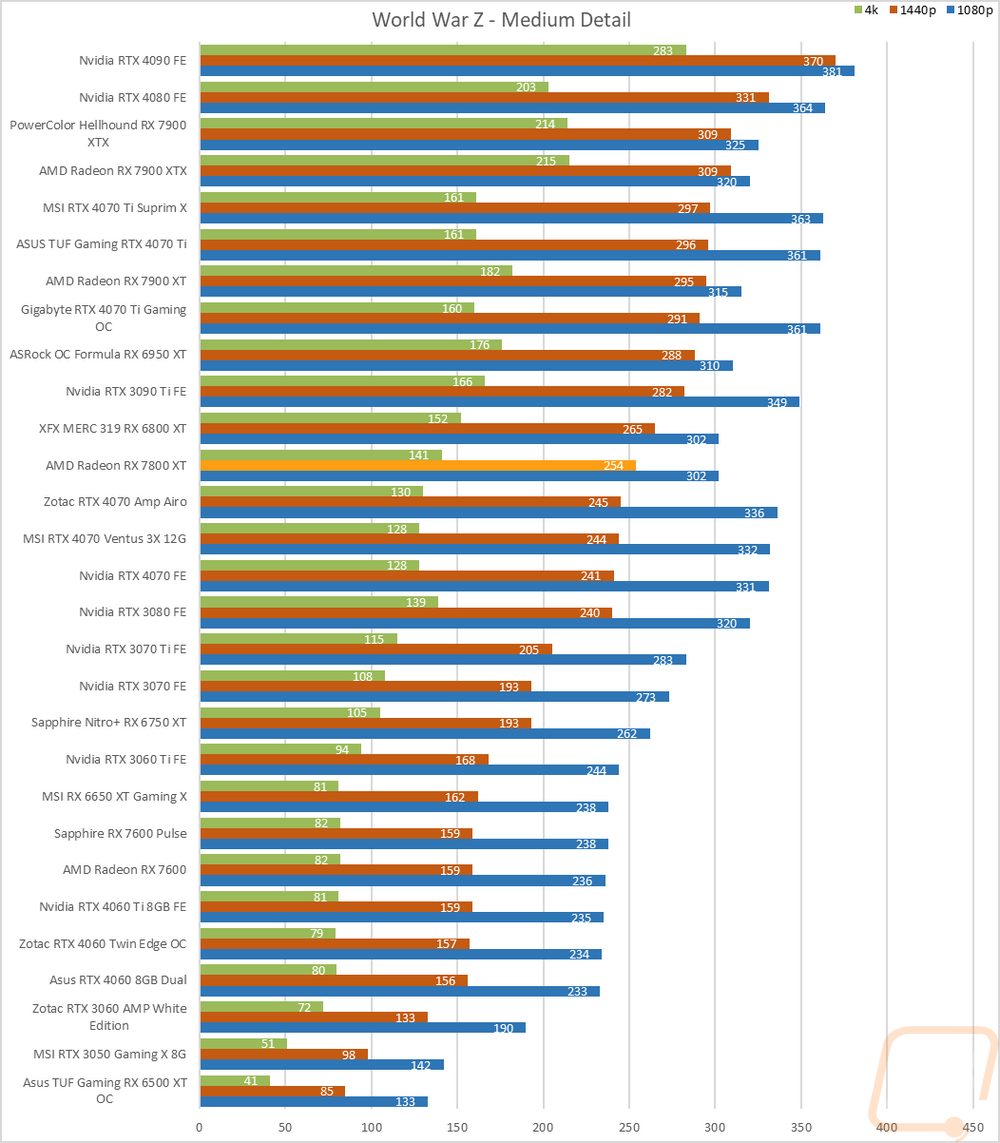
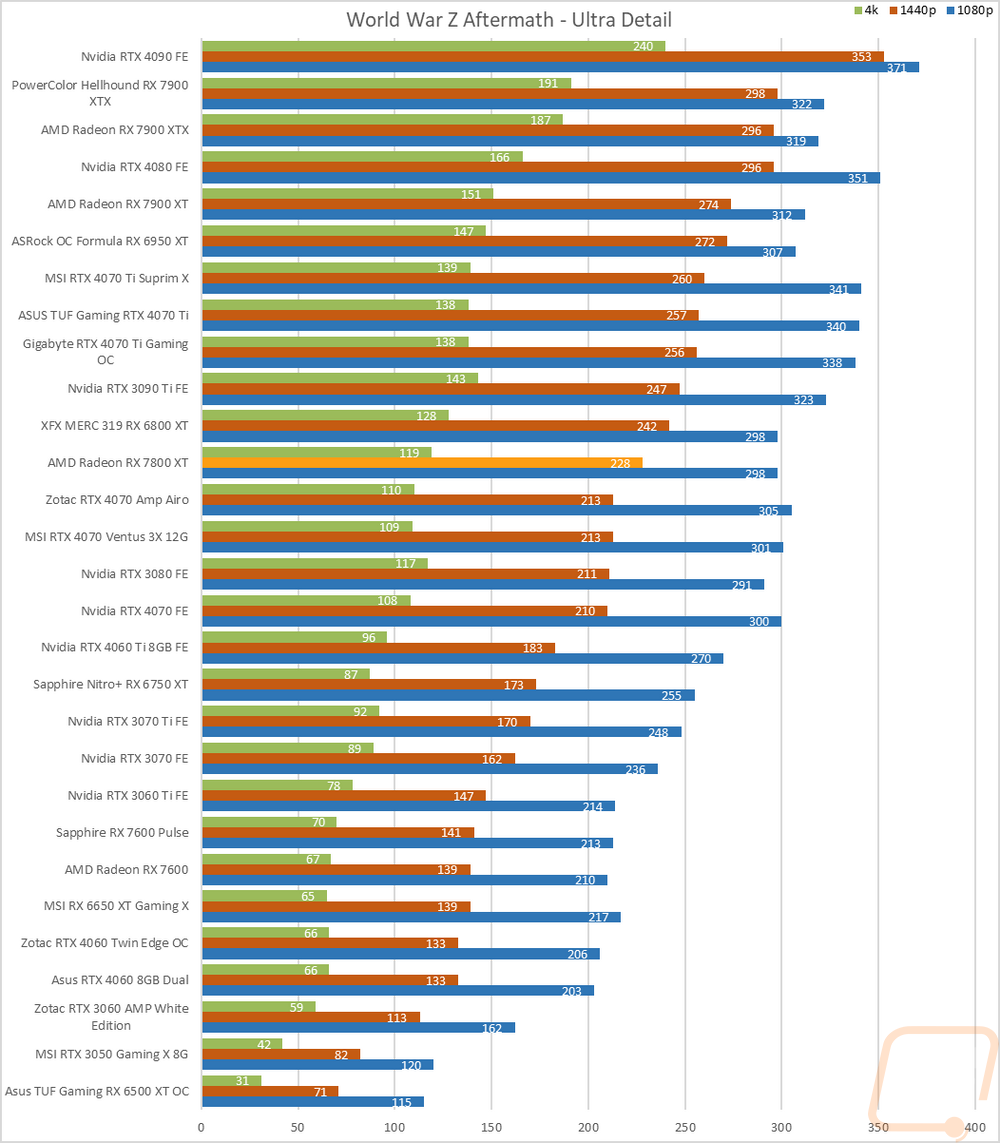
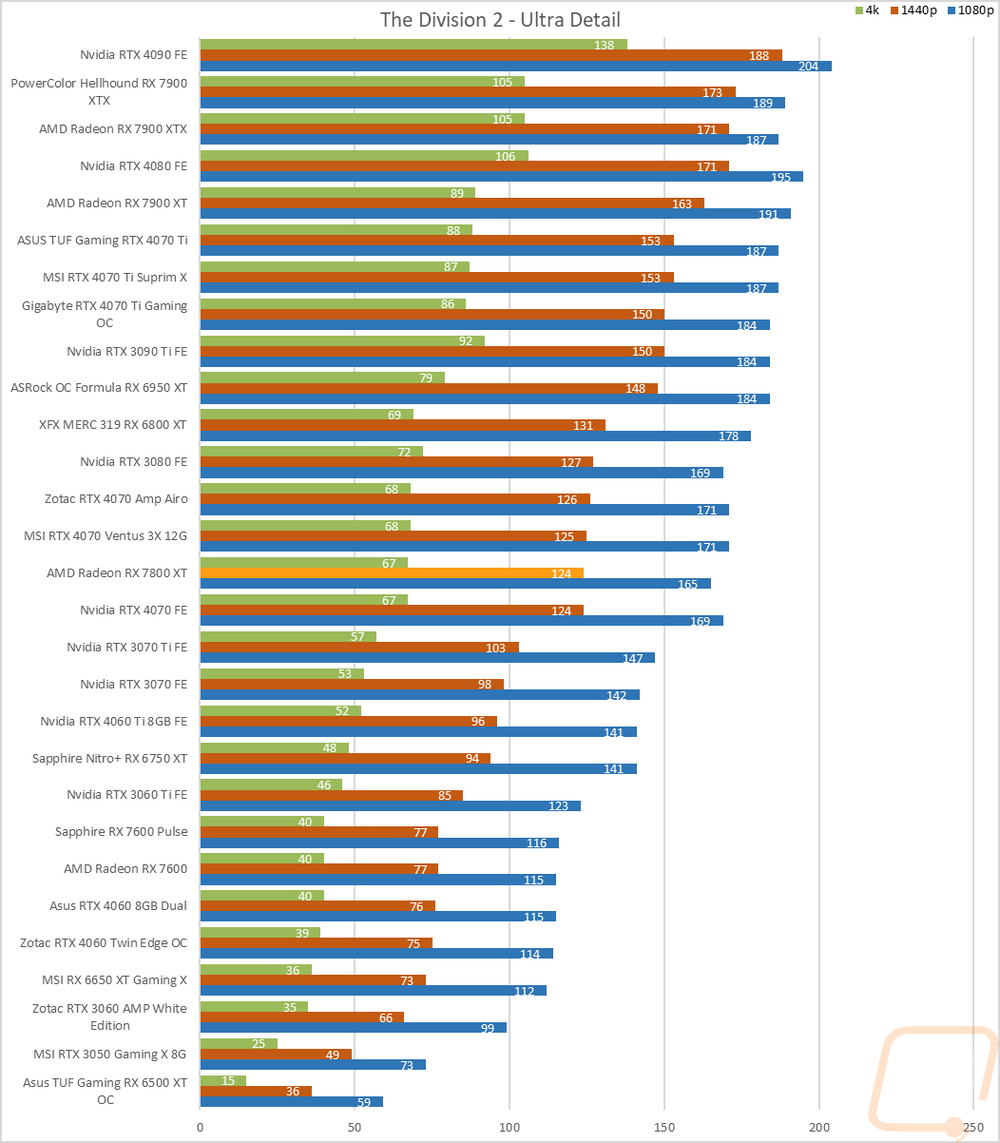
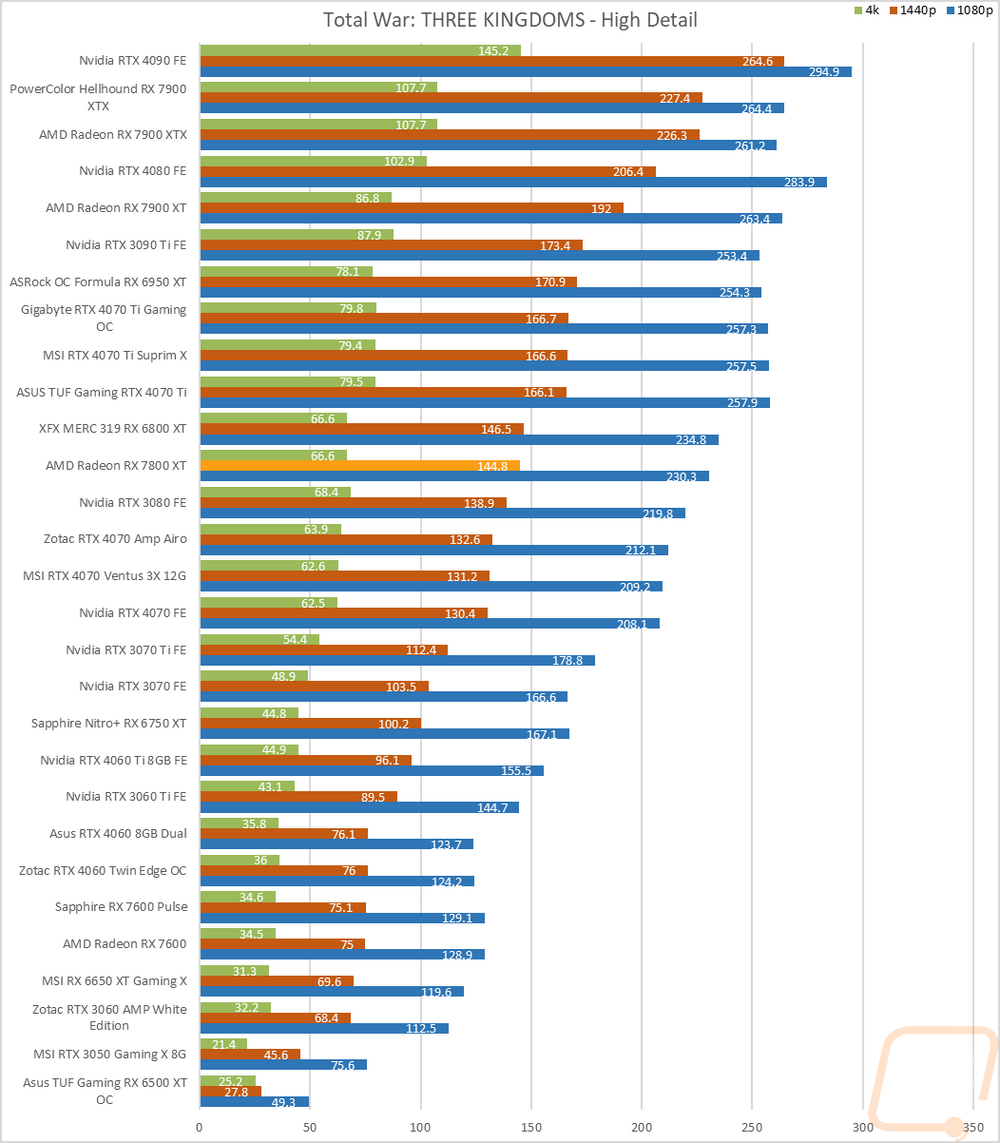
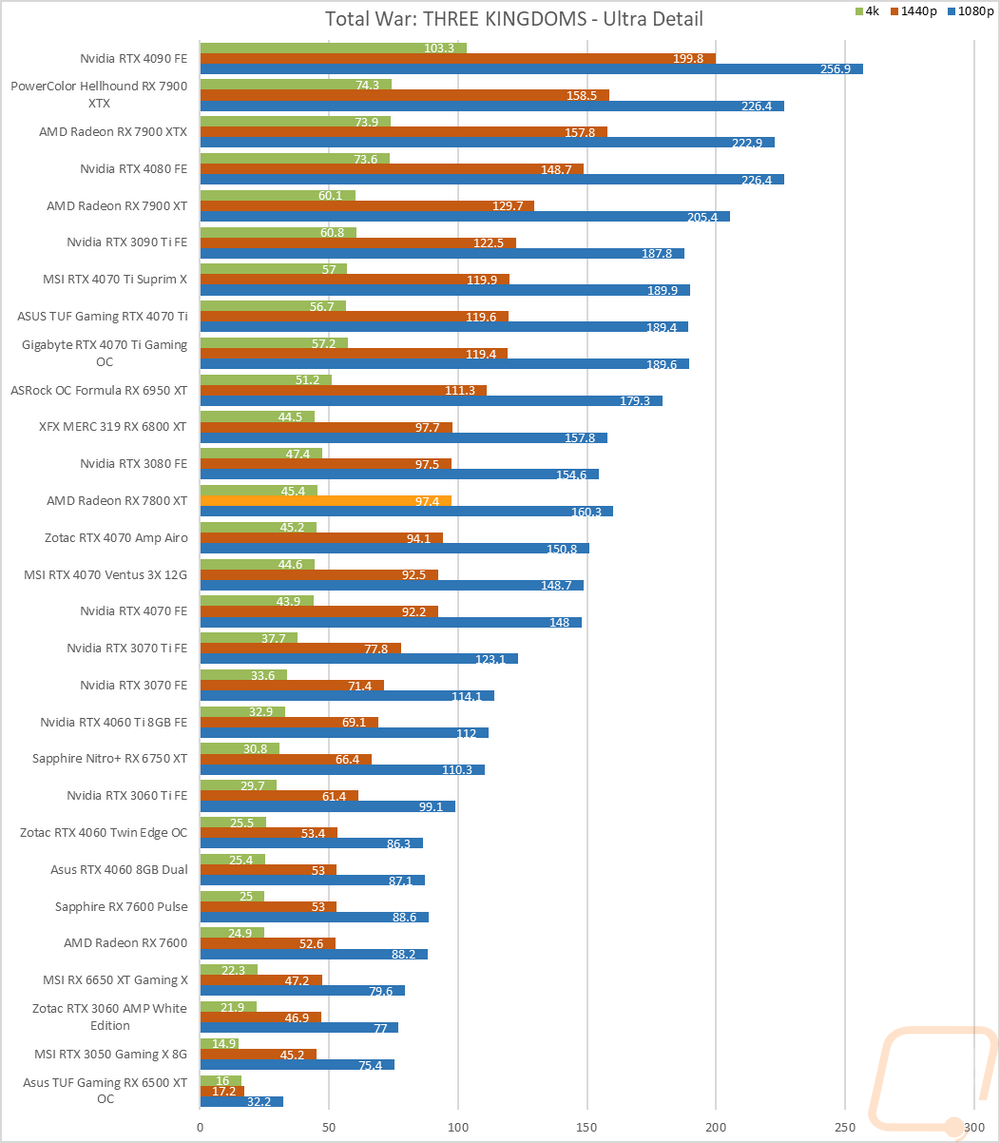
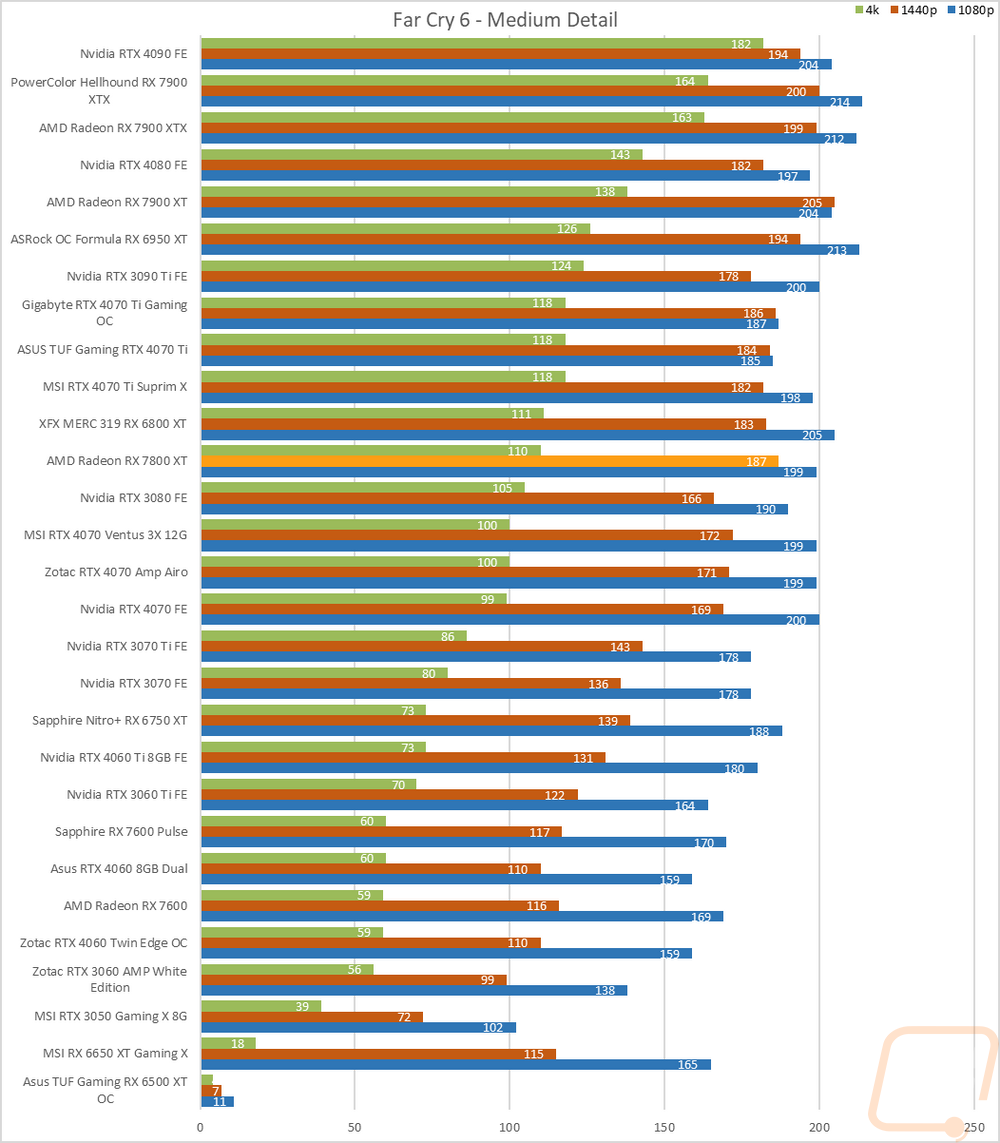
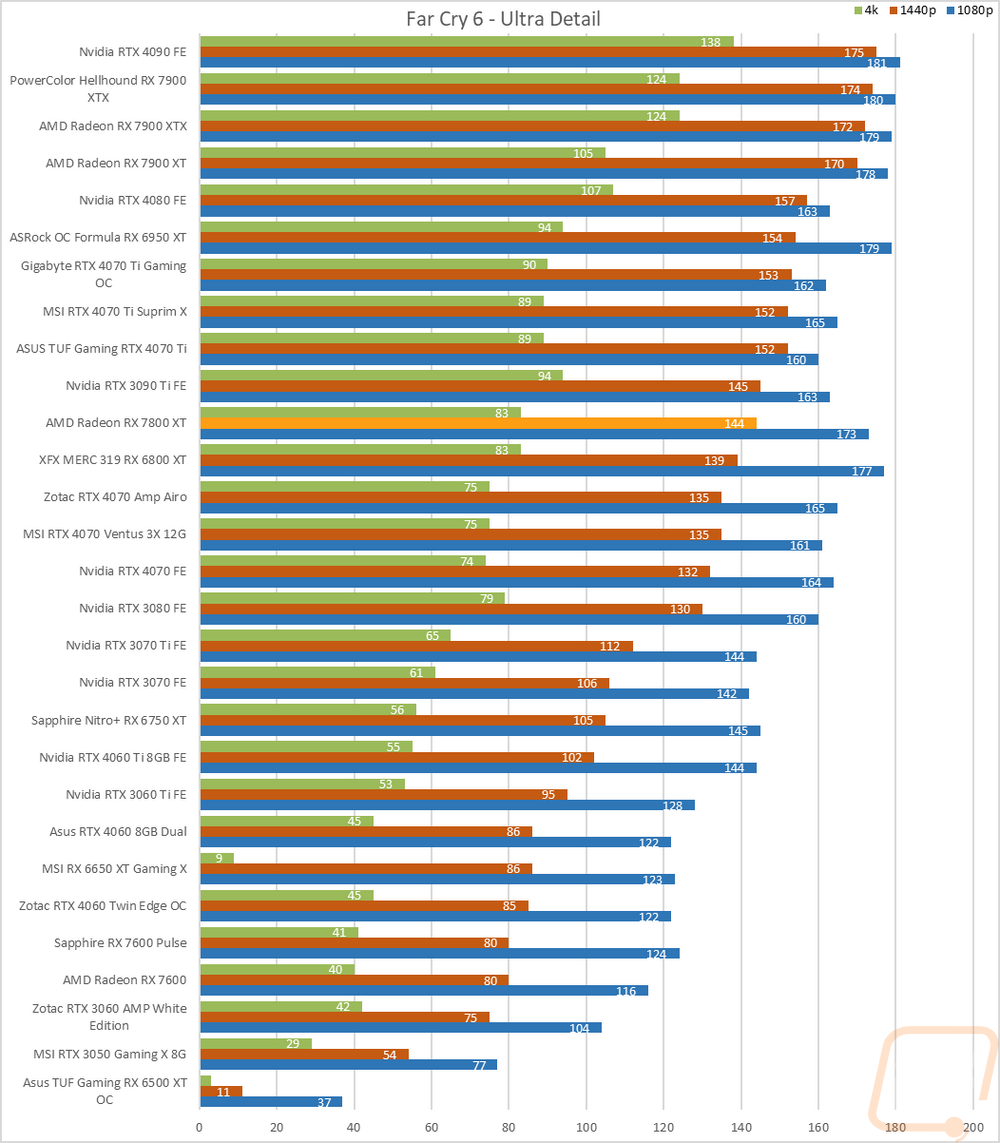
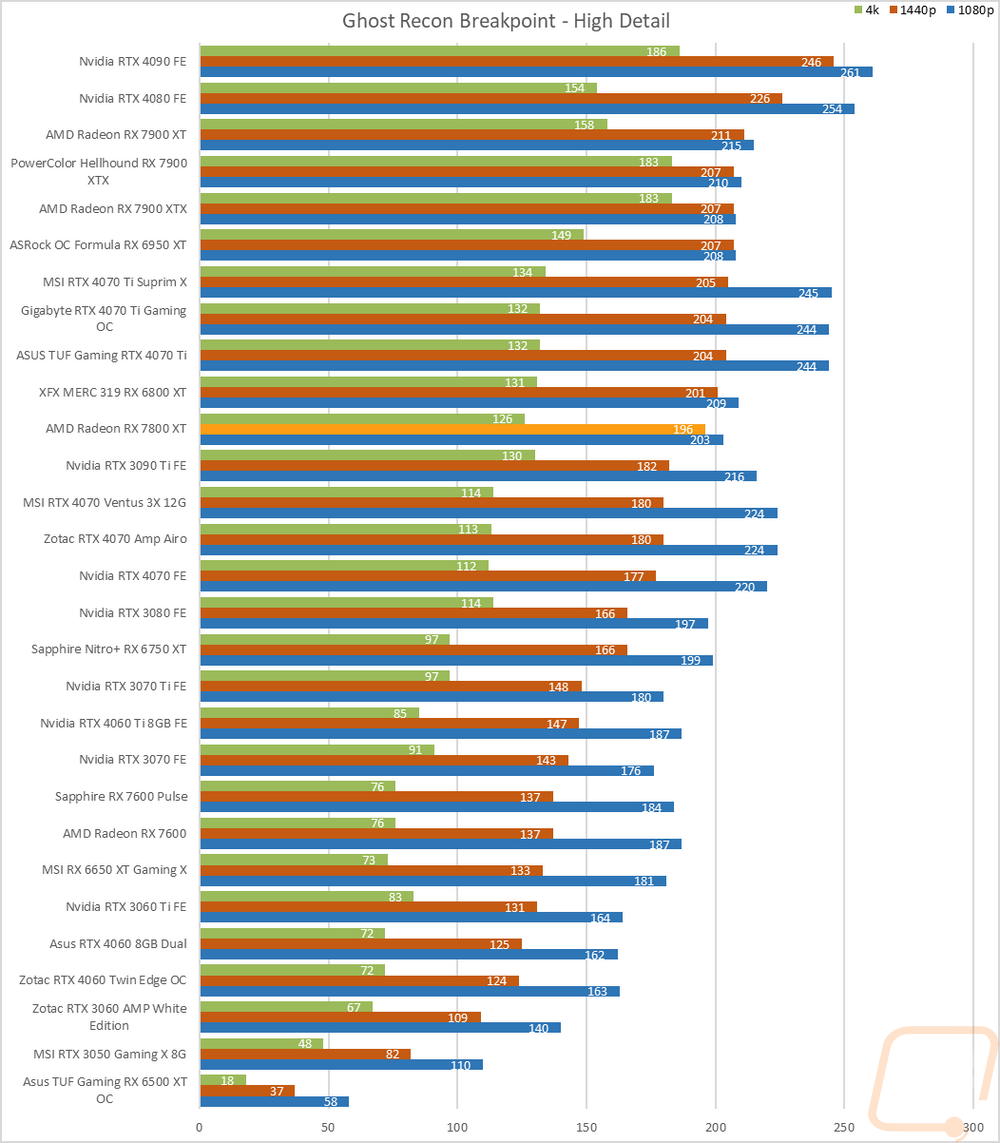
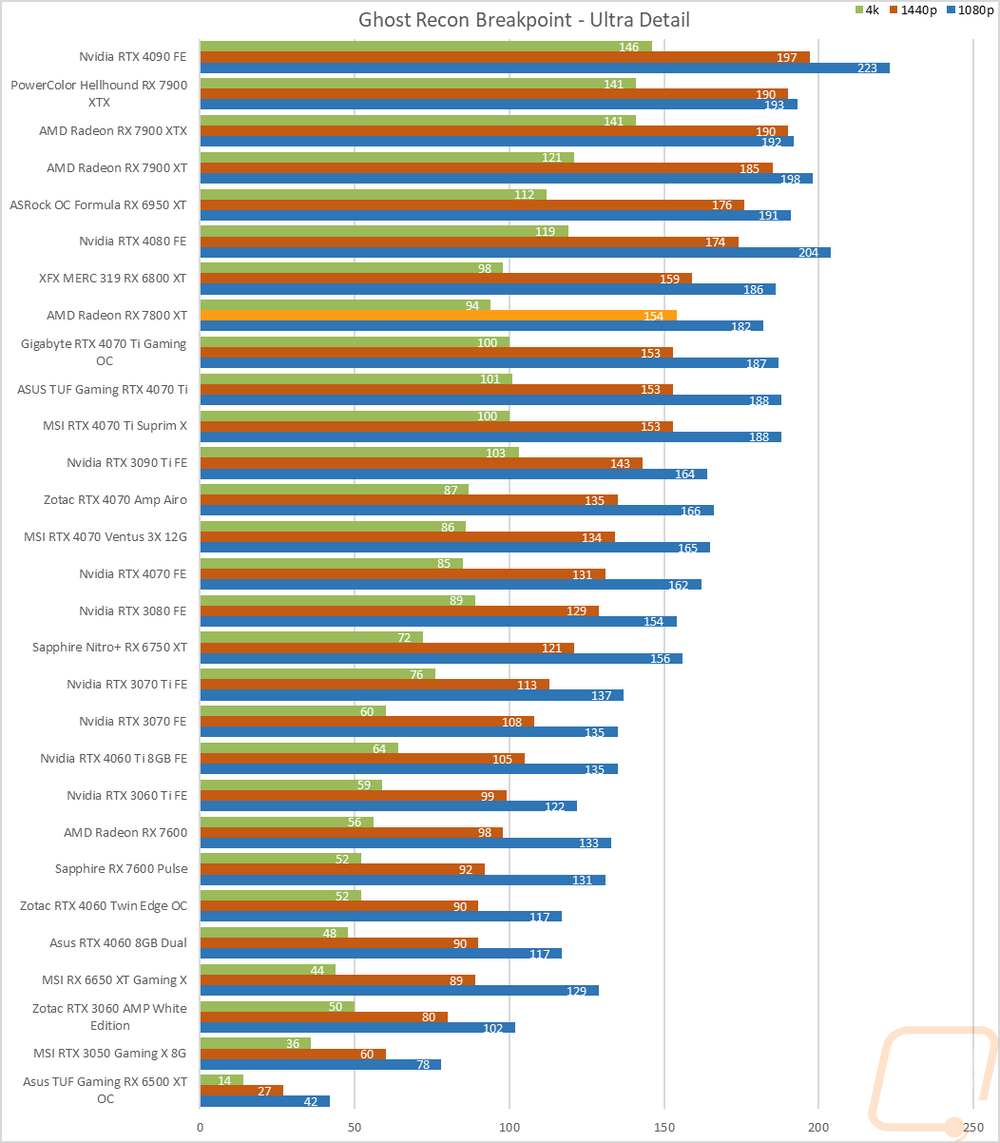
Of course, I have all of the actual in game results as well for anyone who wants to sort through the wall of graphs below. I have also put together the total averages for a list of cards which include all of our results except for CS:GO which would skew the results. This gives us a great look at how the Radeon RX 7800 XT compares to all of the cards around it. The 1080p results don’t mean too much, a lot of those are CPU limited but looking at the 1440p and 4k results we can see that the 7800 XT outperforms the RTX 4070 by 9 FPS at 1440p and 6 FPS at 4K. The gap is even larger once you look at the 6750 XT. But as we have seen in the other tests, the 6800 XT does outperform the 7800 XT across the board. This is going to be controversial given that going off of the model name this is the next generation up. But AMD is targeting the 7800 XT as a replacement for the RX 6800. Like with a lot of Nvidia’s cards, AMD seems to be shuffling things around slightly and this is always a big sticking point for shoppers. Diving into the main graphs they mostly tell the same story. But in some games like Watch Dogs, Total War: Three Kingdoms, and Far Cry 6 the 7800 XT is behind the 6800 XT in the lower detail but catches up or passes the 6800 XT at the higher detail settings.
|
|
1080p |
1440p |
4K |
|
XFX MERC 319 RX 6800 XT |
197.1 |
162.3 |
92.4 |
|
Radeon RX 7800 XT |
190.7 |
156.3 |
89.3 |
|
Nvidia RTX 4070 FE |
190.6 |
147.6 |
83.5 |
|
Sapphire Nitro+ RX 6750 XT |
165.2 |
119.4 |
64.5 |
|
Nvidia RTX 4060 Ti 8GB FE |
160.1 |
115.3 |
62.0 |
|
Zotac RTX 4060 Twin Edge OC |
135.7 |
94.5 |
50.1 |