Cooling Noise and Power
For my last few tests, rather than focusing on in game performance, I like to check out other aspects of video card performance. These are also the most important ways to differentiate the performance between cards that have the same GPU. To start things off I took a look at power usage.
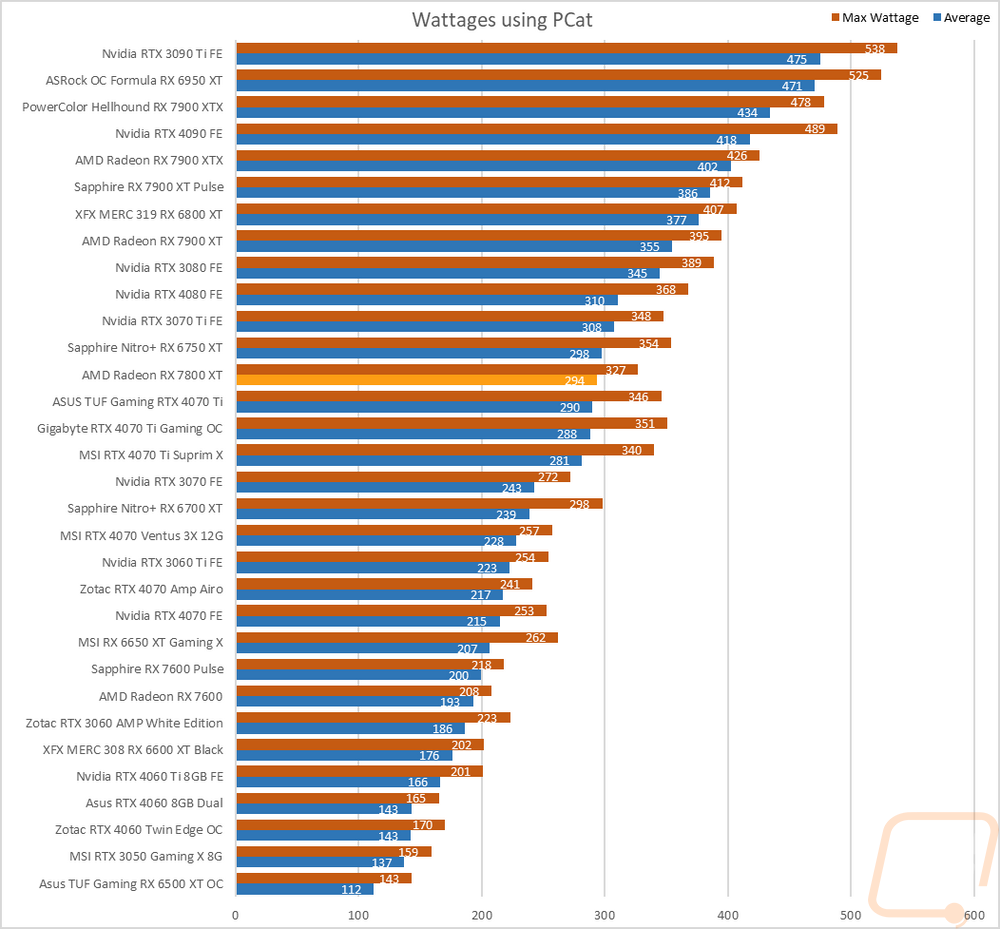
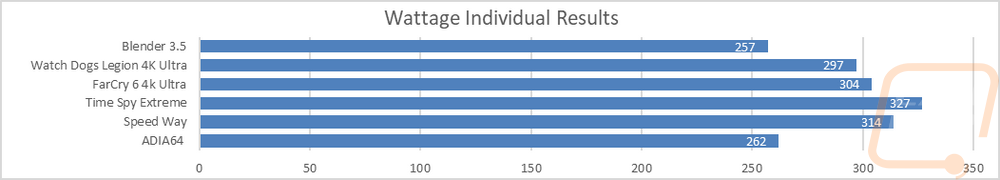
For this, our new test setup utilizes the Nvidia-designed PCat v2 along with cables to handle both traditional 6 or 8-pin connections as well as the new 12VHPWR. The PCat also utilizes a PCIe adapter to measure any power going to the card through the PCIe slot so we can measure the video card wattage exclusively, not the entire system as we have done in the past. I test with a mix of applications to get both in game, synthetic benchmarks, and other workloads like Blender and AIDA64. Then everything is averaged together for our result. I also have the individual results for this specific card and I document the peak wattage result as well which is almost always Time Spy Extreme. The Radeon RX 7800 XT peaked at 327 watts in Time Spy Extreme but averaged 294 watts across the test. That puts it 83 watts on the average lower than the 6800 XT but the RTX 4070 was 79 watts below the 7800 XT.
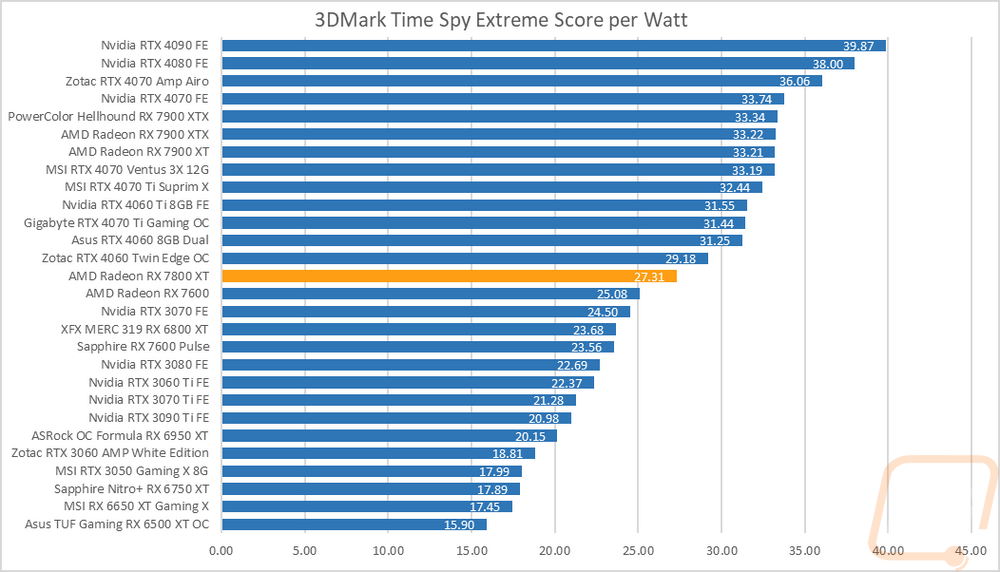
Having exact peak wattage numbers when running Time Spy Extreme I was also able to put together a graph showing the total score for each watt that a card draws which gives us an interesting look at overall power efficiency in the popular and demanding benchmark. This graph does a better job of showing the overall efficiency. Given that the in our tests was just behind the 6800 XT and ahead of the RTX 4070 it is now surprising that the 4070 is up near the top, the 7800 XT is in the middle, and the 6800 XT is down lower.
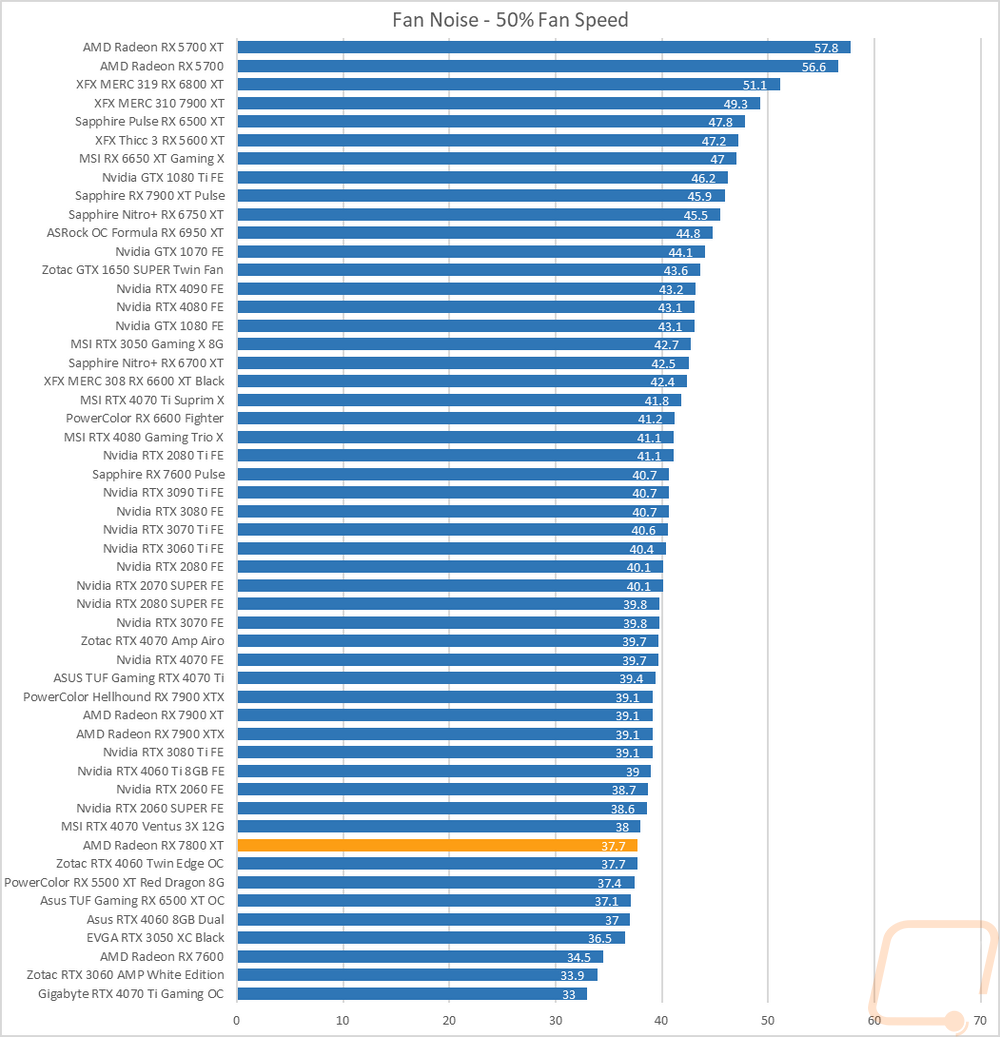
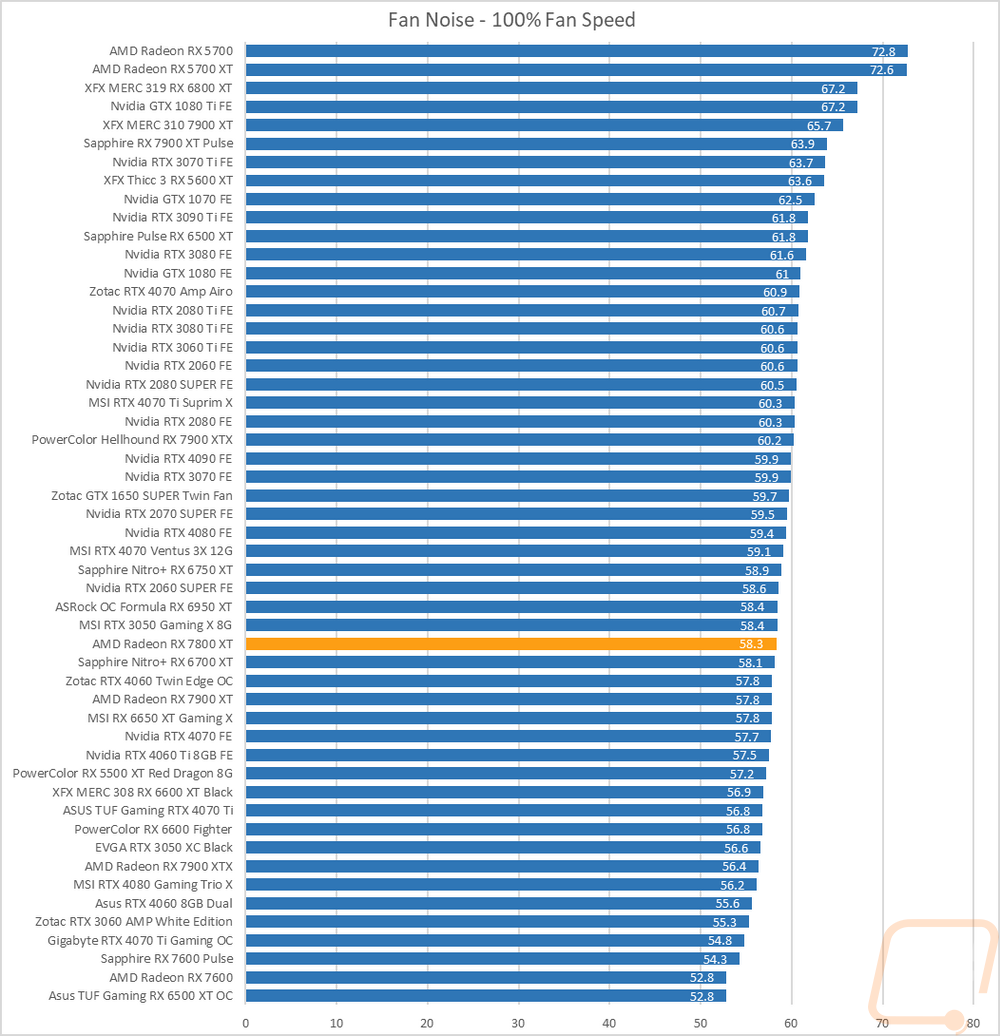
My next round of tests were looking at noise levels. These are especially important to me because I can’t stand to listen to my PC whirling. Especially when I’m not in game and other applications are using the GPU. For my testing, though I first tested with the fan cranked up to 100% to get an idea of how loud it can get, then again at 50% to get an idea of its range. The Radeon RX 7800 XT did well here with its two-fan configuration. At 50% fan speed, it came in at 37.7 decibels, this was 2 decibels lower than the 4070 Founders Edition from Nvidia and 1.4 dB lower than the triple fan reference cooler on the 7900 XT. At 100% fan speed it moved up in the charts slightly with its 58.3 dB noise level. At 100% the 4070 Founders Edition is quieter and the 7900 XT reference card was also a little quieter, surprisingly.
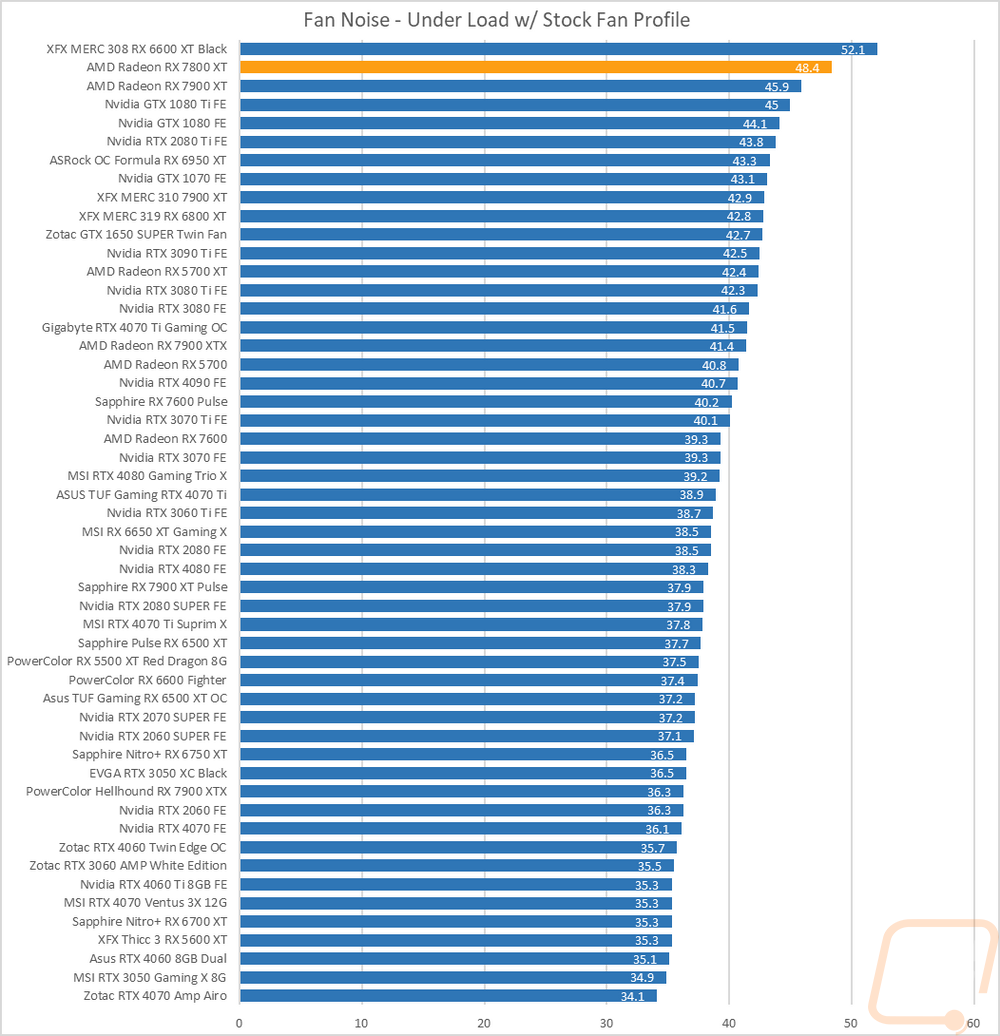
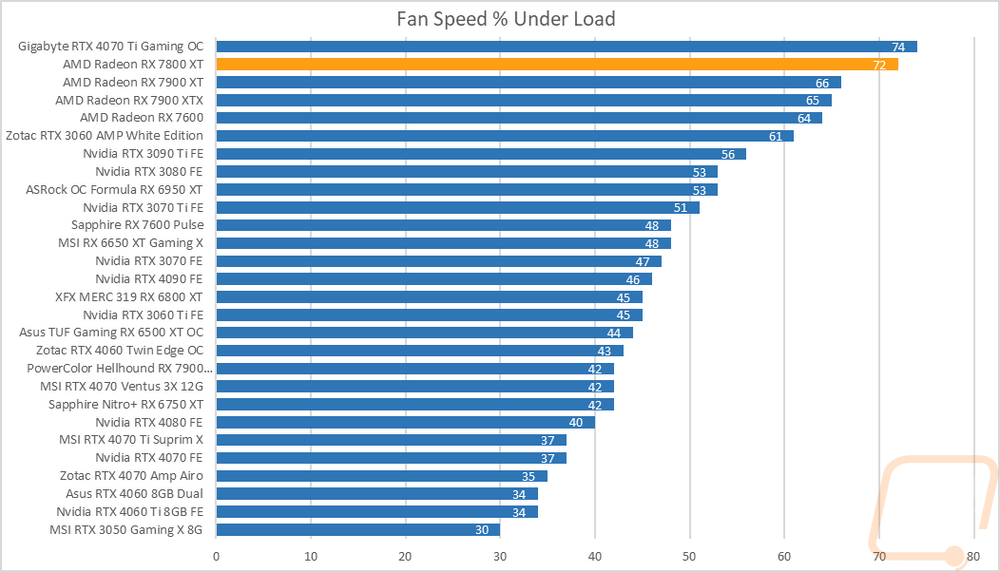
I also take a look at noise performance while under load. For that when running AIDA64’s stress test I wait until the temperature of the card has leveled off and then measure how loud things are when the card is at its worst-case scenario with the stock fan profile. Here the Radeon RX 7800 XT is up at the top of the chart and not in the good way. While under load it was noticeably louder than most other cards tested. Looking at the fan speeds which are also up near the top at 72% fan speed the stock fan profile is either aggressive or the card is running really hot and compensating for it. (Don’t worry we look at that next)
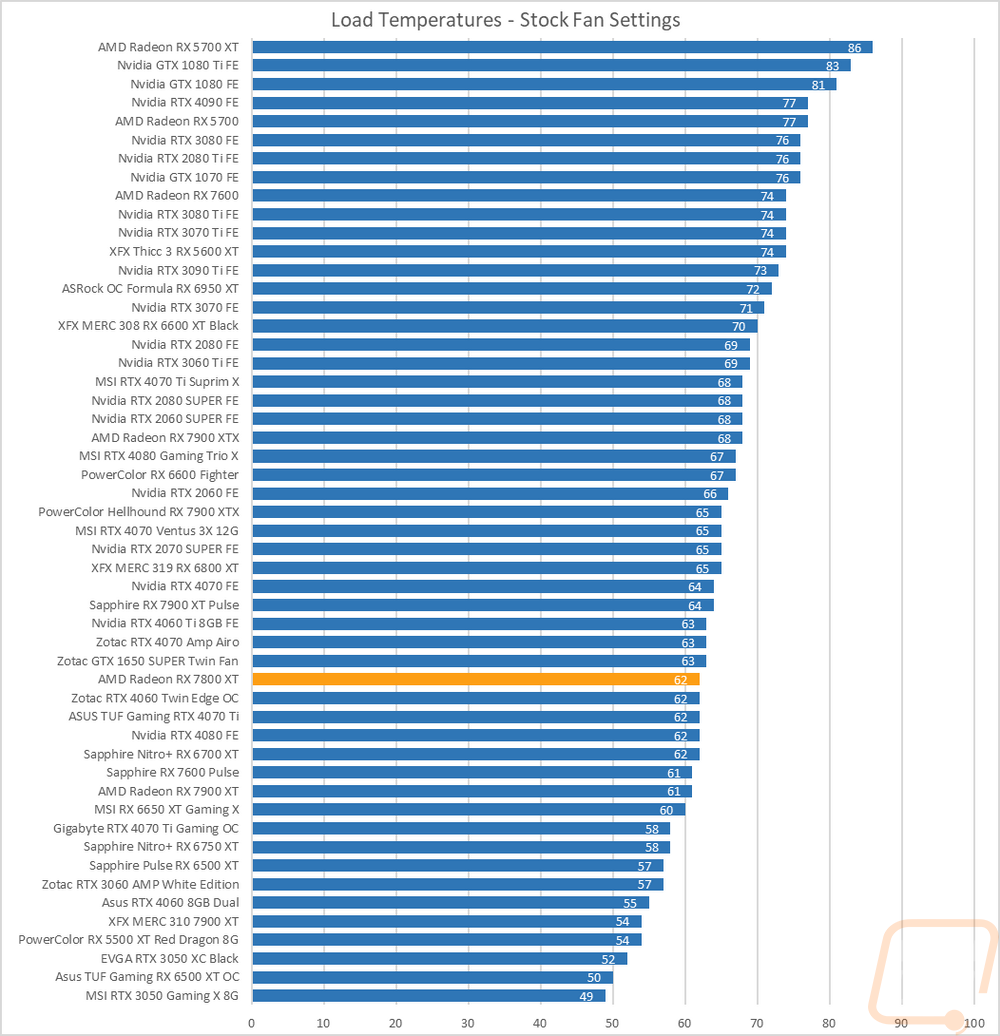
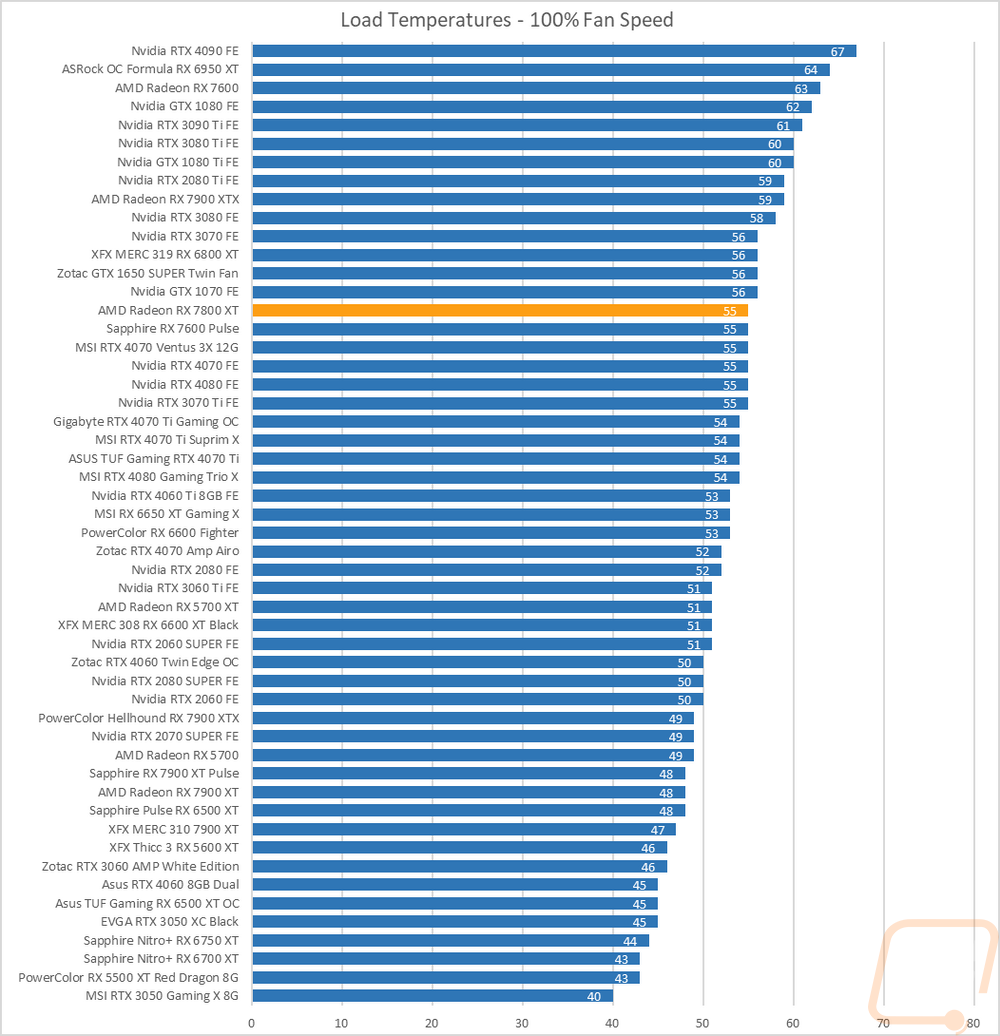
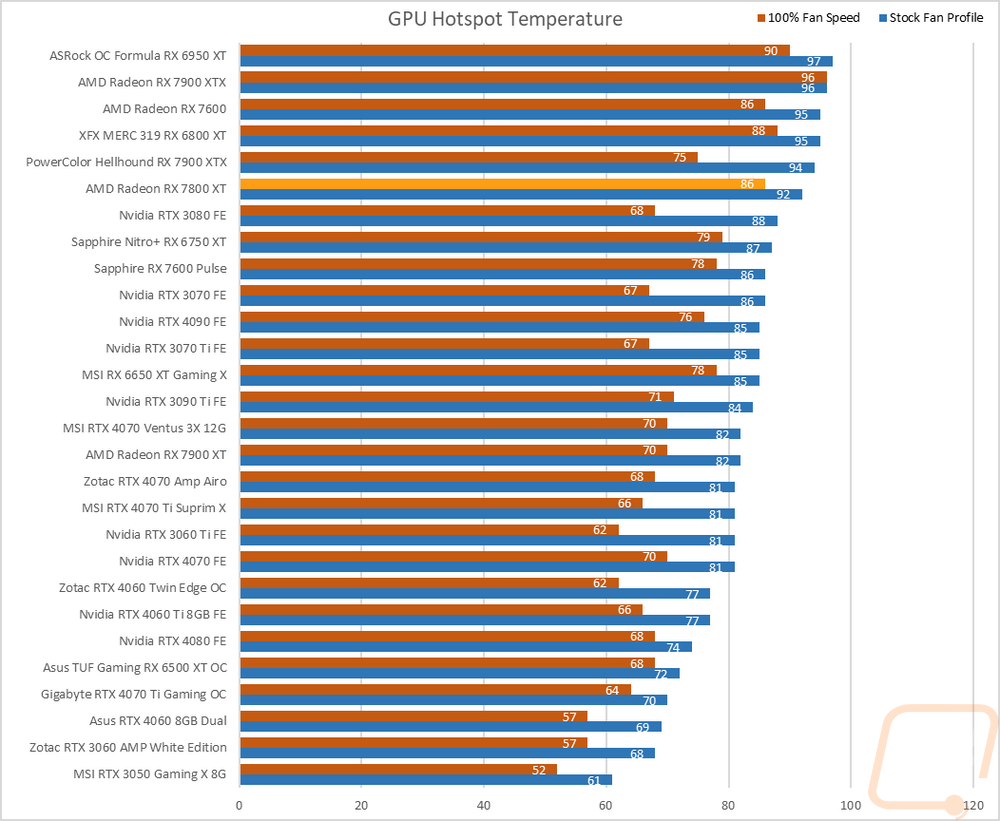
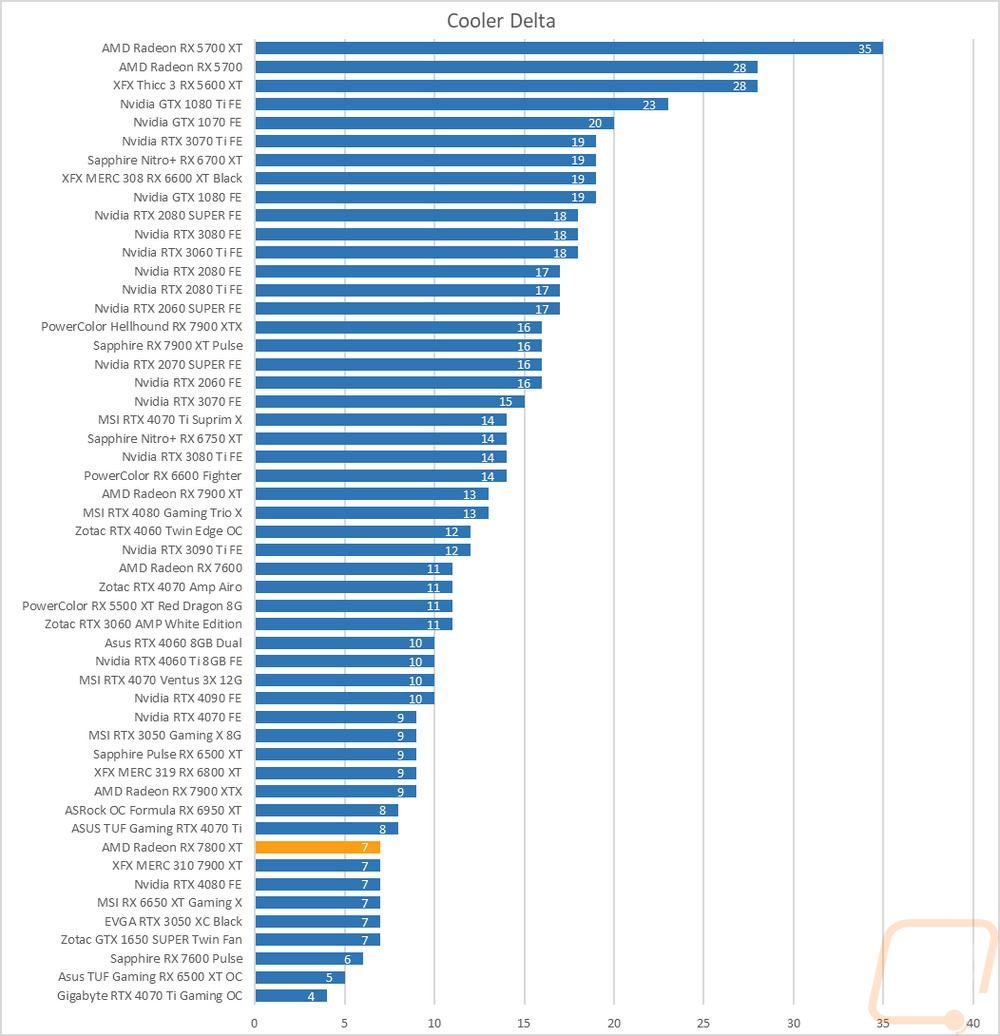
To finish up my testing I of course had to check out the cooling performance. To do this I ran two different tests. I used AIDA64’s Stress Test run for a half-hour each to warm things up. Then I documented what temperature the GPU leveled out at with the stock fan profile and then again with the fans cranked up to 100%. With the stock profile, the Radeon RX 7800 XT came in at 62c which was a lot lower than I expected after doing our noise tests and seeing just how high the fan profile had the fans running under load. The Radeon RX 7800 XT reference design is compact, not a thick/tall card like a lot of the partner card designs so 62c with that design is better than it should be really and that fan profile could be tuned to run a lot quieter without putting the Radeon RX 7800 XT up at the top of the chart. At 100% fan speed the Radeon RX 7800 XT is up in the top 1/3 of the chart which is more in line where I would expect it to be and is right with the RTX 4070 FE. I did also check GPU hotspot temperatures and I would normally check out memory temps as well but AMD doesn’t include support for those readings. The GPU hotspots for the Radeon RX 7800 XT with the stock fan profile were at 92c which is warmer than I would like. At 100% fan speed they did drop down to 86c but even that result is in the top few cards. Because of the aggressive fan profile, the delta between our stock fan profile and 100% fan speed results were 7c.
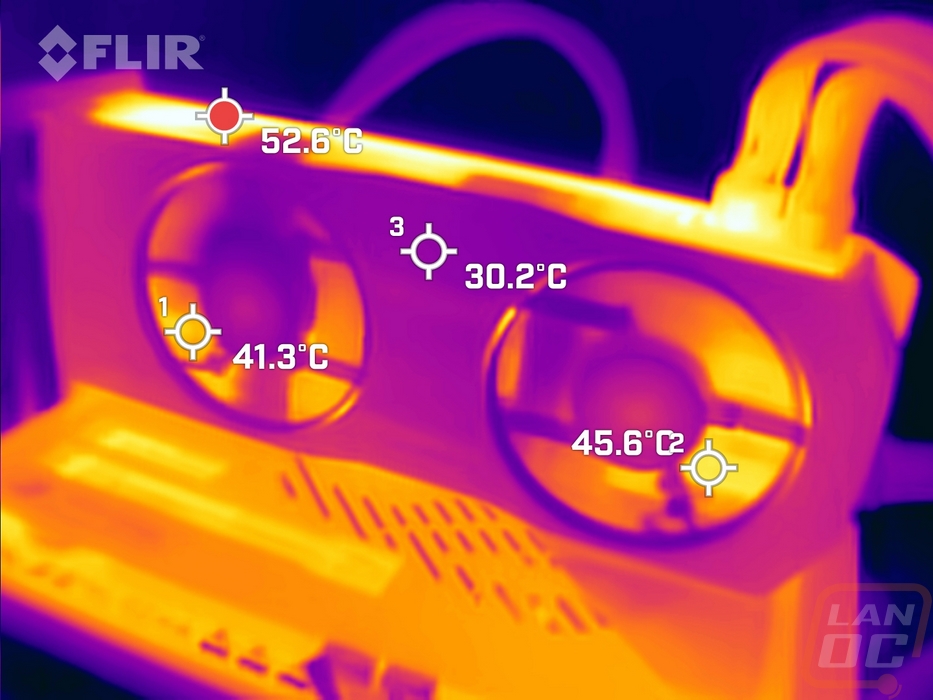
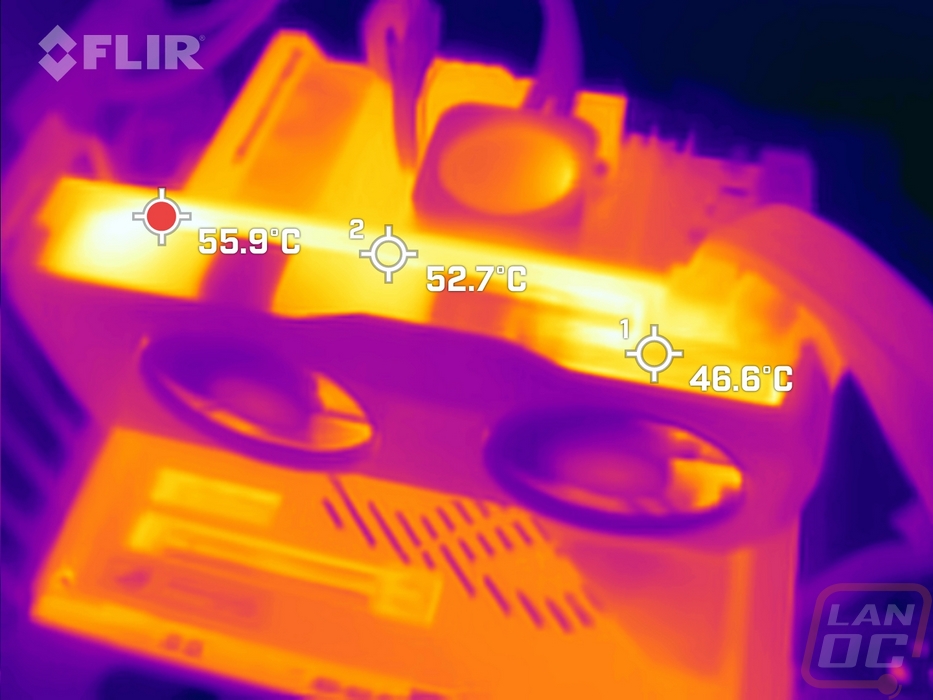
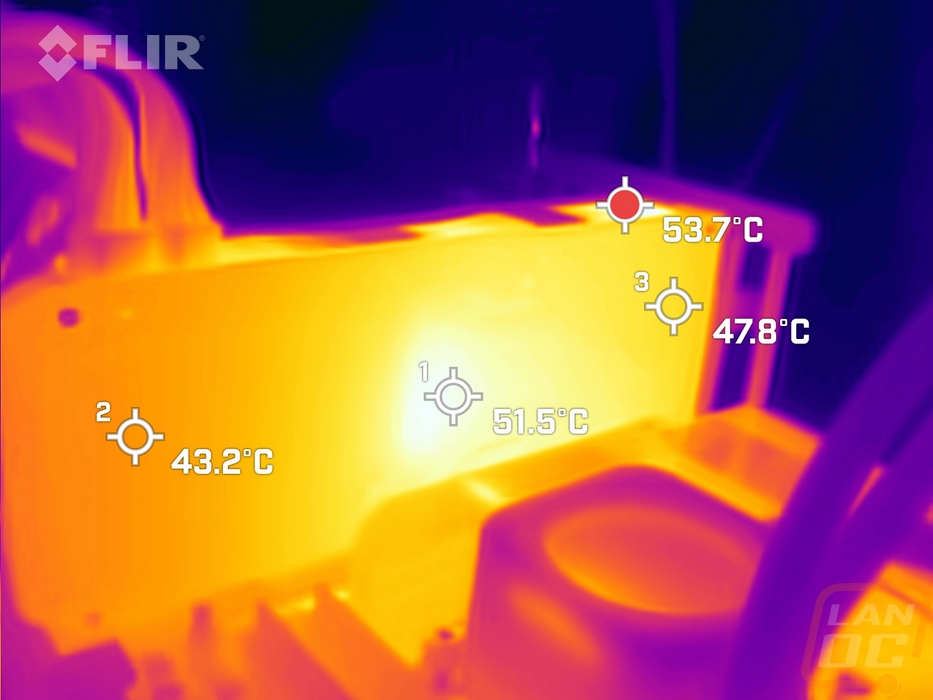
While running the stock fan profile testing I also took the time to get a few thermal images so we could see what is going on. The Radeon RX 7800 XT with its metal housing does heat up, especially given the numbers we saw above in the testing. The fan side of the card has the shroud at 30c which isn’t bad at all and the hottest areas behind the fans in the heatsink are at 45c. Because of how tight the card sits against the built-in heatsink on our Asus Extreme motherboard you don’t see much air blowing out that direction so most of the heat is coming up out of the top of the card with that reaching 55.9c on the left side and is cooler down towards the power connections at 46c. The metal backplate is pulling a surprising amount of heat out through it in the center with that reaching 51.5c behind the GPU and it is 47c and 43c on the other ends.