Synthetic Benchmarks
As always I like to start my testing with a few synthetic benchmarks. 3DMark especially is one of my favorites because it is very optimized in both Nvidia and AMD drivers. It's nice to not have to worry about it being favored too much either way and the repeatability of the results makes it a nice chance to compare from card to card, especially when comparing with the same GPU. In the case of the Radeon RX 7800 XT, this is the first 7800 XT that I am testing. So my focus is just on how it compares against the competition. That includes seeing how it compares to the 7600 and 7900 XT as well as the 6800 XT from last generation and then from Nvidia cards like the RTX 4070 and RTX 4060 Ti.
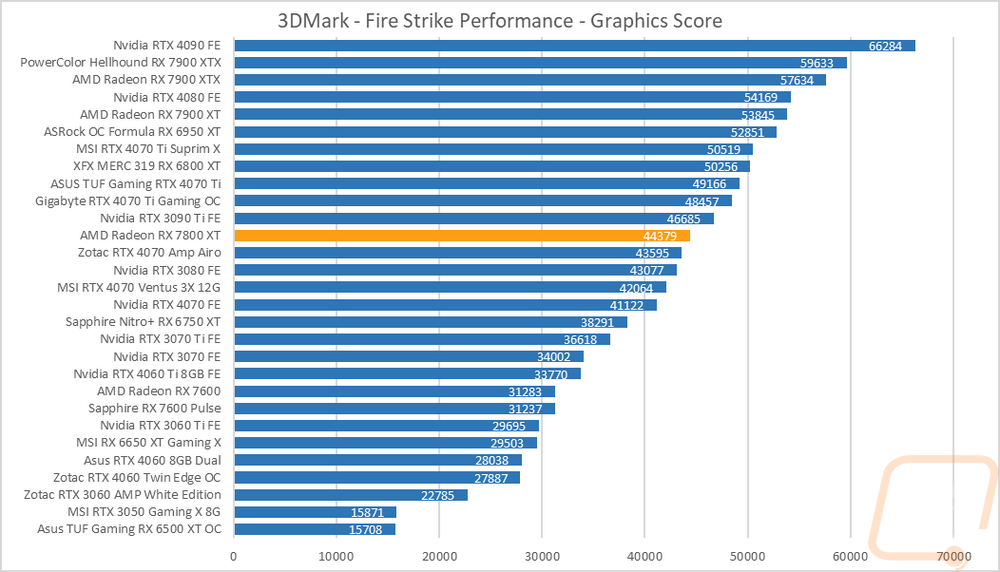
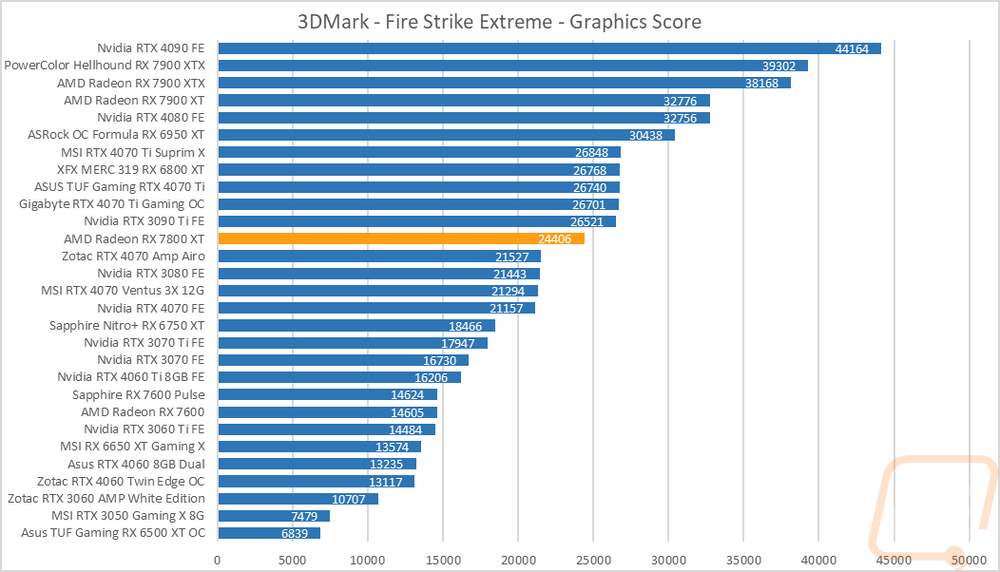
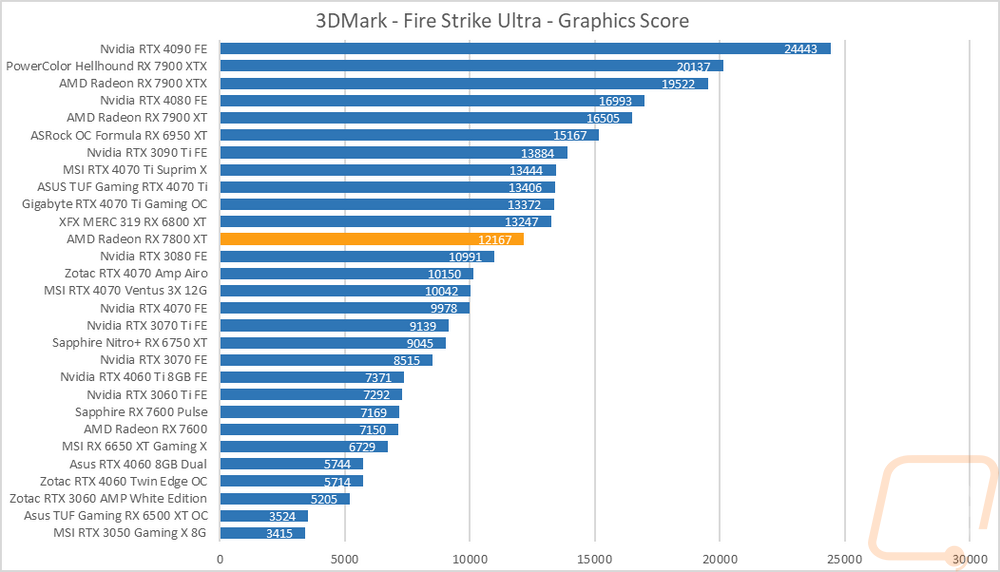
The first round of tests were done in the older Fire Strike benchmark which is a DX11 test. There are three detail levels, performance, extreme, and ultra. The Radeon RX 7800 XT scored a 44379 on the base Fire Strike test putting it above the overclocked RTX 4070 and the RTX 3080 but the 6800 XT, which is an overclocked card where this is a stock clocked reference card, is way out in front with a score of 50256. That gap shrunk in Fire Strike Extreme where the Radeon RX 7800 XT is even farther in front of the 4070 and Fire Stike Ultra has the 680 XT still ahead but even closer together.
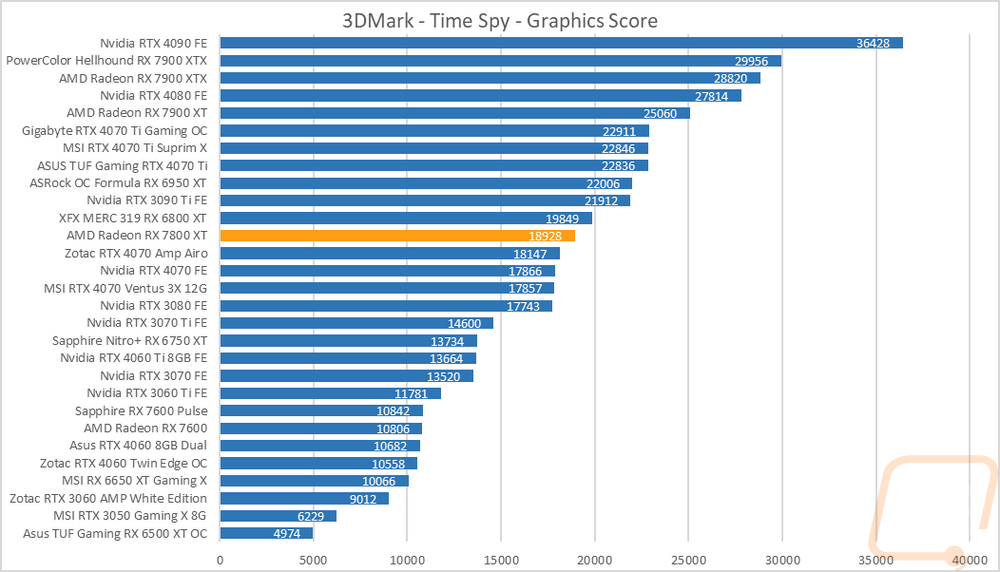
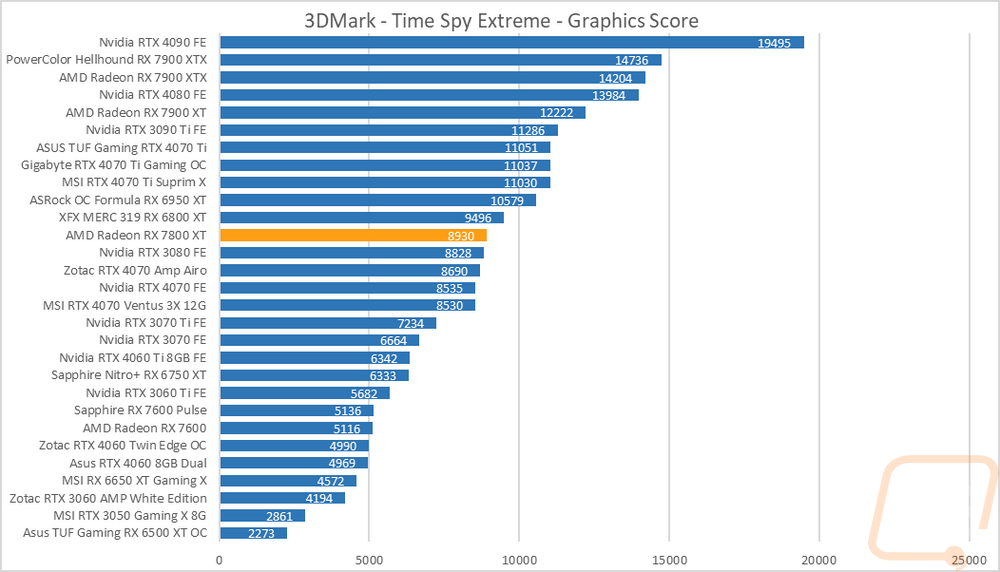
The next two were both based on the Time Spy benchmark. One is the standard test and then there is the extreme detail level. This is a DX12-focused test and a better look at modern game performance. The overclocked 6800 XT is ahead in both tests and the Radeon RX 7800 XT is out in front of both the 4070 and last generations 3080 in both tests as well.
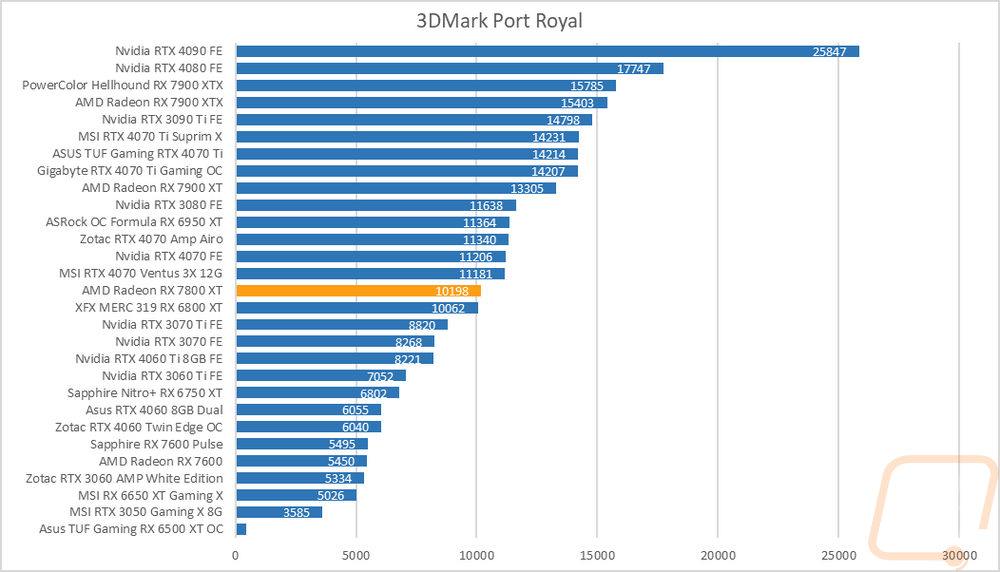
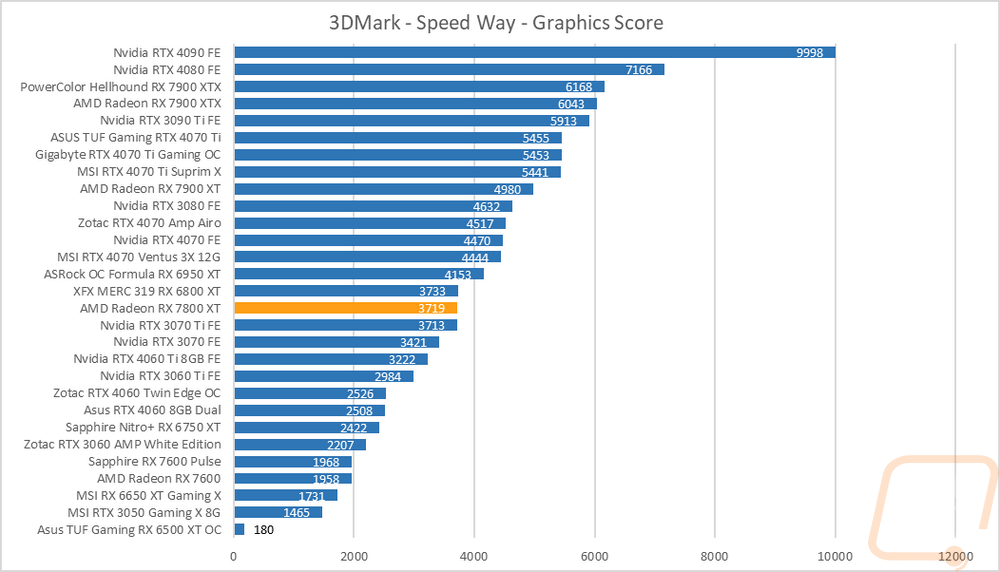
For ray tracing performance, I ran both the 3DMark Port Royal test which is ray tracing focused as well as the new 3DMark Speed Way test which tests all future-looking features including ray tracing. In Port Royal, the Radeon RX 7800 XT outperforms the RX 6800 XT in this situation but the RTX 4070, even the stock-clocked Founders Edition model jumps ahead here. In Speed Way, the 6800 XT and the Radeon RX 7800 XT are right together in performance but again the 4070 is way out in front here by an even bigger margin. For comparison, the Radeon RX 7800 XT is right with the 3070 Ti in performance here.
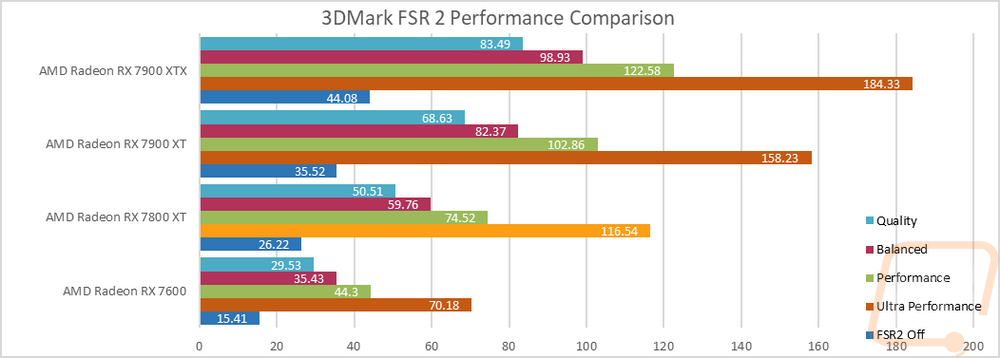
While in 3Dmark I did also check out the AMD FSR 2 performance demo which I ran at 4K in all four of the detail settings. I compared the Radeon RX 7800 XT against the other 7000 Series cards here. I was curious how much of a performance difference FSR 2 (not the new 3) can offer. For the Radeon RX 7800 XT, the base average frame rate with it off was 26.22 FPS. Even on the highest detail that performance nearly doubled but you can see that it goes up from there tripling on the performance setting and more than 4 times with ultra-performance.
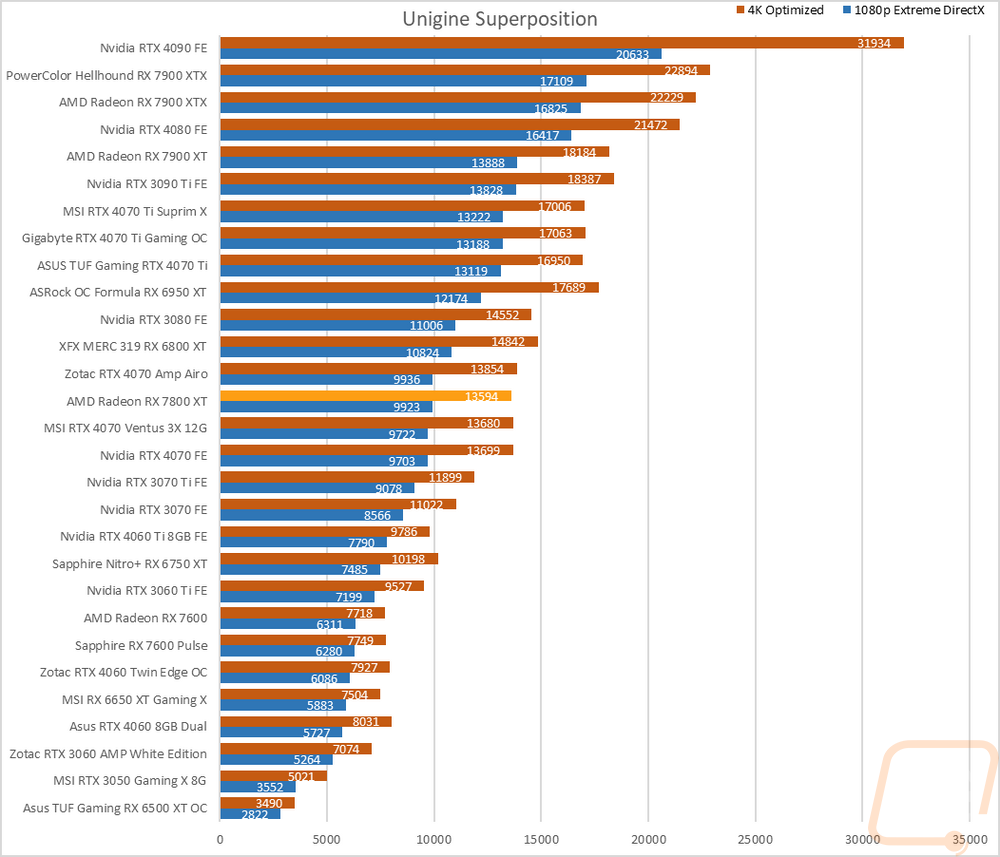
The last test was using the Unigine-based Superposition benchmark and I tested at 1080p with the extreme detail setting as well as the 4K optimized setting. In the extreme detail setting the Radeon RX 7800 XT is running right in the middle of the RTX 4070’s with it being just a hair behind on the 4K Optimized test and ahead on the 1080p Extreme benchmark. The overclocked 6800 XT on the other hand is up ahead of both the Radeon RX 7800 XT and the 4070.