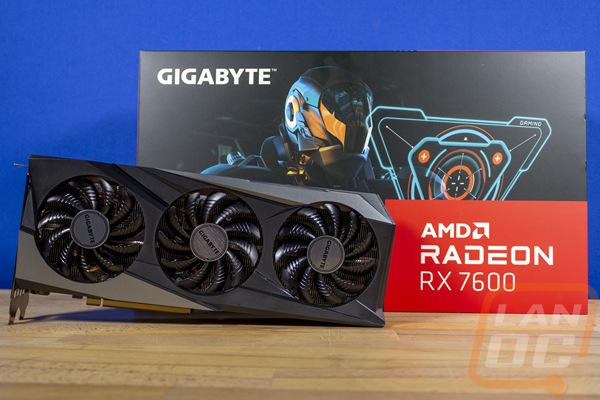
One of the interesting things about video cards is that while we only get a relatively small number of new GPUs each year, how models fit into the market and what is a good and bad buy is always changing. Prices go up and down and once you have new models out it changes things as well. Not to mention when you have previous generations of cards marked down as well. That doesn’t even figure in the used market which is its own monster. As reviewers, most of the cards we get in to test come in right around the launch so it is nice when later on I get a chance to revisit things. Gigabyte sent over their RX 7600 Gaming OC 8G and now that the 7700 XT and 7800 XT are out it should be interesting to see how it fits into the market, so today we are going to do just that after testing it and seeing how it compares to other RX 7600s that I’ve already tested.
Product Name: Gigabyte RX 7600 Gaming OC 8G
Review Sample Provided by: Gigabyte
Written by: Wes Compton
Amazon Affiliate Link: HERE
|
Specifications |
|
|
Graphics Processing |
Radeon™ RX 7600 |
|
Core Clock |
Boost Clock* : up to 2755 MHz (Reference card: 2655 MHz) Game Clock* : up to 2355 MHz (Reference card: 2250 MHz) |
|
Stream Processors |
2048 |
|
Memory Clock |
18 Gbps |
|
Memory Size |
8 GB |
|
Memory Type |
GDDR6 |
|
Memory Bus |
128 bit |
|
Card Bus |
PCI-E 4.0 |
|
Digital max resolution |
7680x4320 |
|
Multi-view |
4 |
|
Card size |
L=282 W=115 H=50 mm |
|
PCB Form |
ATX |
|
DirectX |
12 Ultimate |
|
OpenGL |
4.6 |
|
Recommended PSU |
550W |
|
Power Connectors |
8 pin*1 |
|
Output |
DisplayPort 1.4a *2 HDMI 2.1a *2 |
|
Accessories |
Quick guide |
|
Note |
* “Boost Clock” is the maximum frequency achievable on the GPU running a bursty workload. Boost clock achievability, frequency, and sustainability will vary based on several factors, including but not limited to: thermal conditions and variation in applications and workloads. * “Game Clock” is the expected GPU clock when running typical gaming applications, set to typical TGP (Total Graphics Power). Actual individual game clock results may vary. GD-147 |
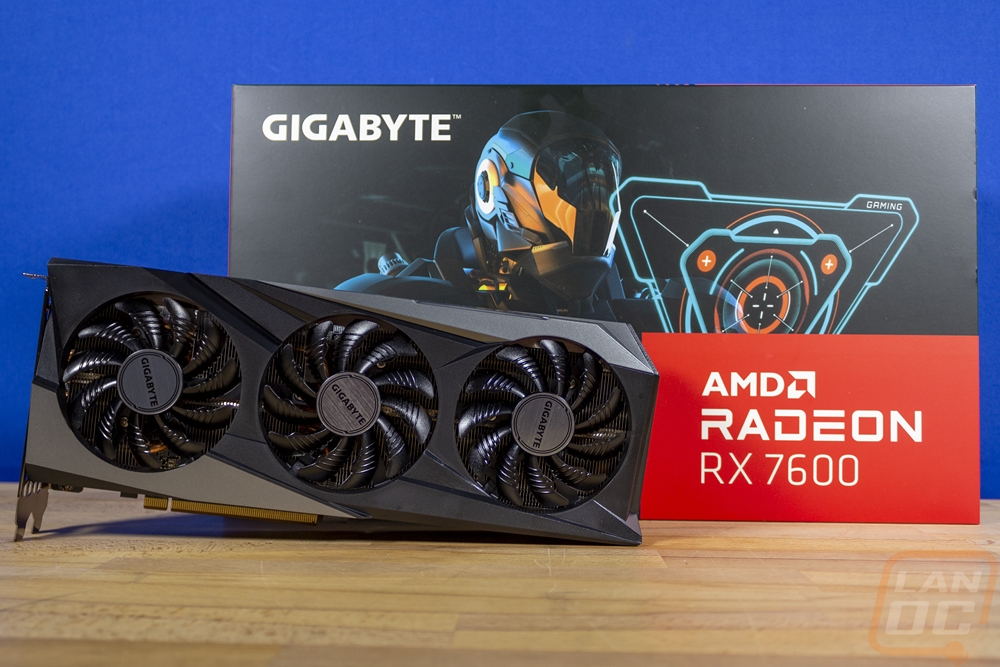
Packaging
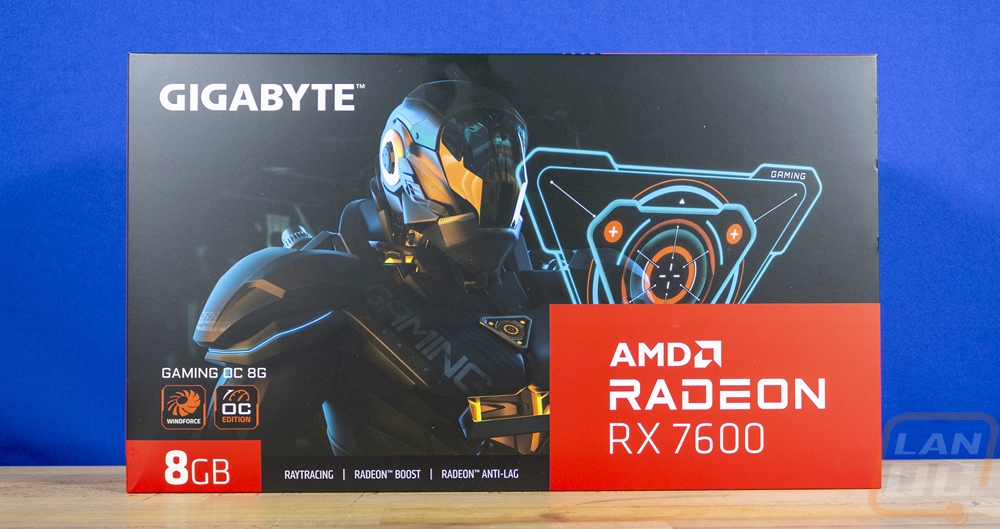
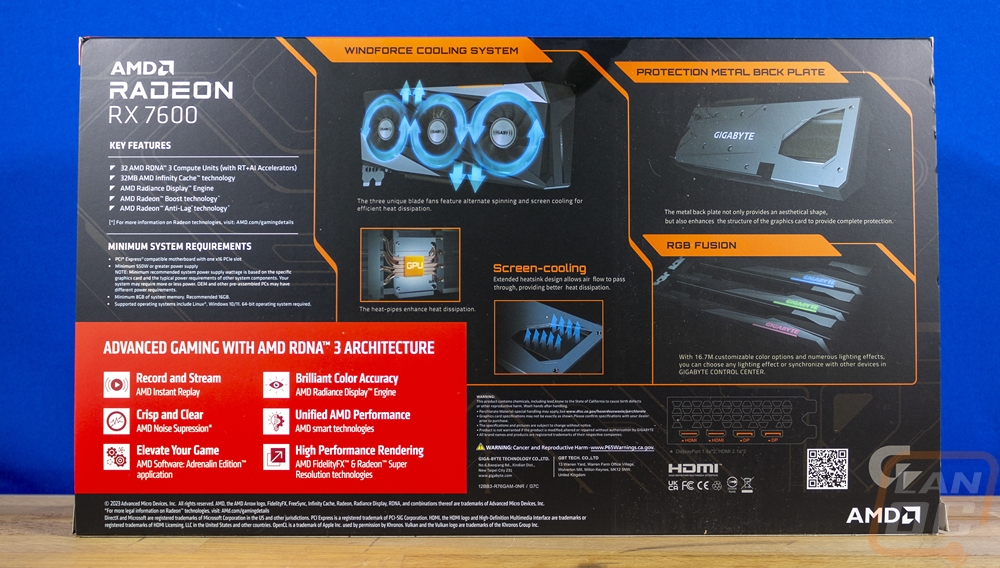
The Gigabyte RX 7600 Gaming OC 8G packaging has a black background and a rendering of a person in a space suite with gaming on it that covers most of the box. They have the Gigabyte logo in the top left and then in the bottom right it has a huge red wrap-around from AMD which has the RX 7600 GPU model in it. The Gaming OC 8GB model designation from Gigabyte is then in a really small font on the left over top of the VRAM. They also have badges to show that this is a Windforce card and is overclocked below the Gaming OC 8GB name. On the back, the AMD wrap-around does carry on with another big red box. That has some of the AMD-specific features about the RDNA 3 architecture. Gigabyte then filled the rest of the back with information on the RX 7600 Gaming OC 8G. This includes pictures of the card's features which also give us a peak at what the card looks like. It shows off the RGB lighting, the metal backplate, and how the windforce fan layout works as well. There is a line drawing that shows the display connections but there isn’t a specification breakdown that shows the card dimensions or clock speeds at all.
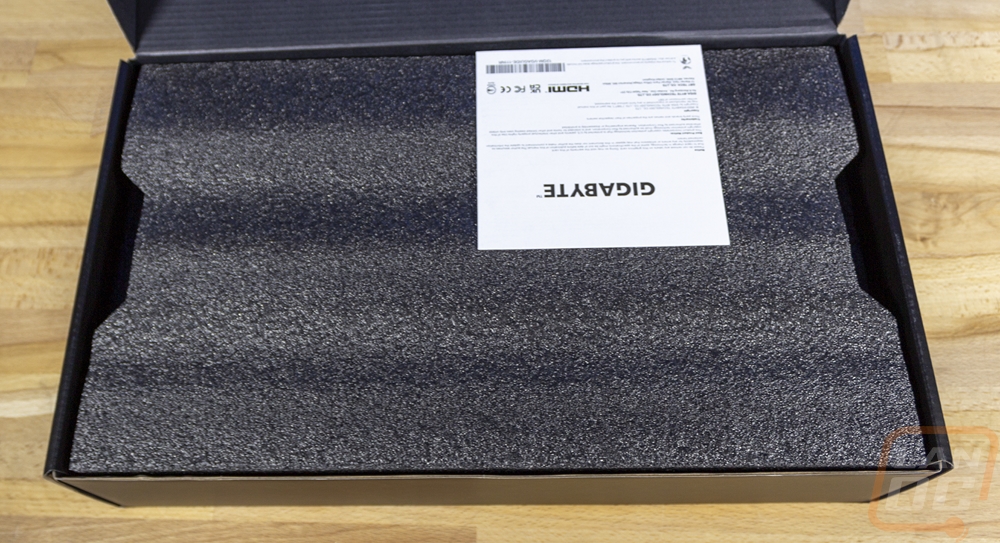
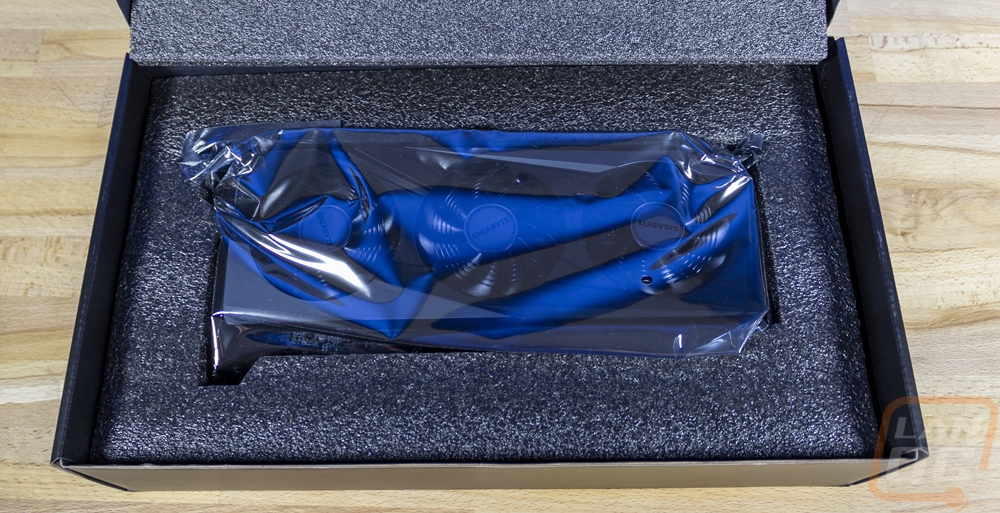
Inside of the outer liner is a black box, this is a standard box and gives the outer liner all of its structure. When you open this up right up on top is the documentation. Then you have a thick foam panel. Under that, the RX 7600 Gaming OC 8G comes wrapped up in a static protective bag and sits in a thick foam tray that is cut out to fit the card perfectly to keep it from moving around and keep it safe from damage. For documentation, the RX 7600 Gaming OC 8G just comes with a generic Gigabyte quick guide, nothing specific to this card and there aren’t any other accessories needed or included.

Card Layout and Photos
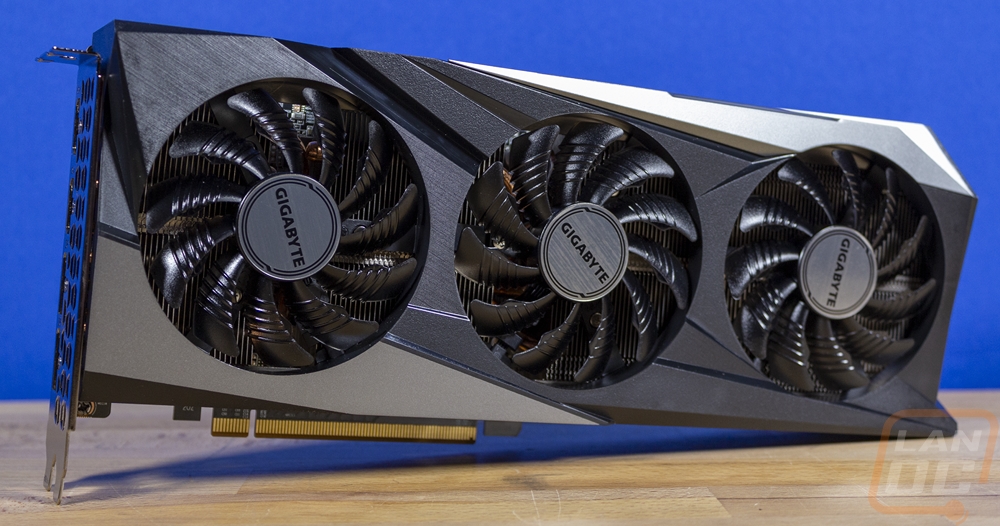
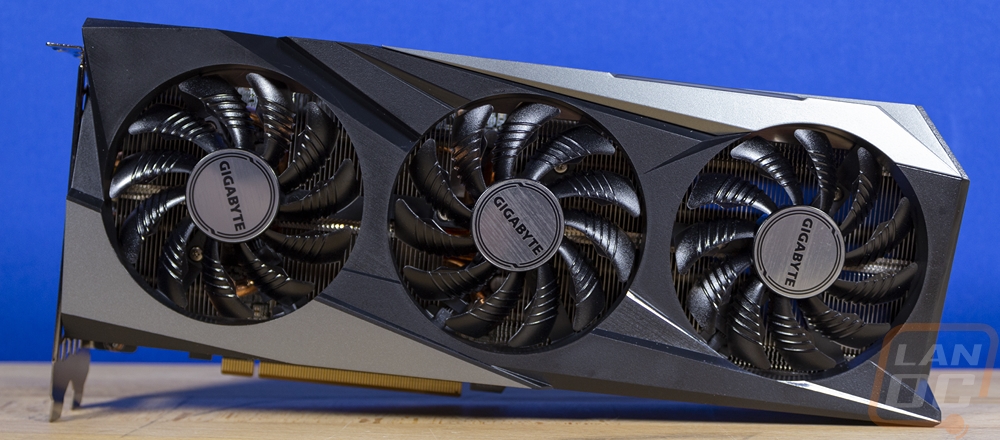
The Gigabyte RX 7600 Gaming OC 8G doesn’t look anything like the Gigabyte RTX 4070 Ti Gaming OC that I took a look at back in June. I would have expected them to be close in styling but the RX 7600 Gaming OC 8G looks closer to some of the older Gigabyte cards from a generation back. It has a mix of black and silver for its plastic fan shroud with the entire shroud being a mix of different angles that give it some depth. The black runs like a stripe from the top left to the bottom right corners with the silver in the bottom left and top right. It goes around the triple fan Windforce cooler which the fans match up with the black and silver theme as well.
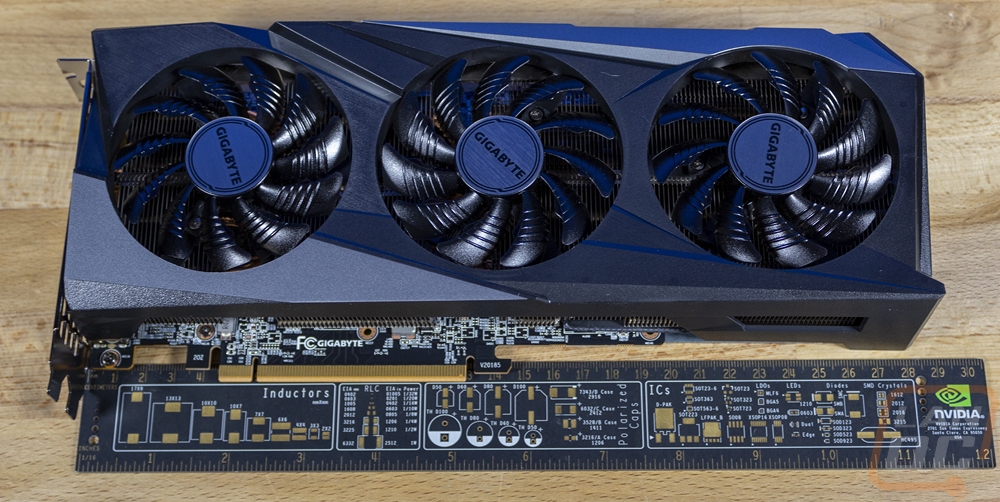
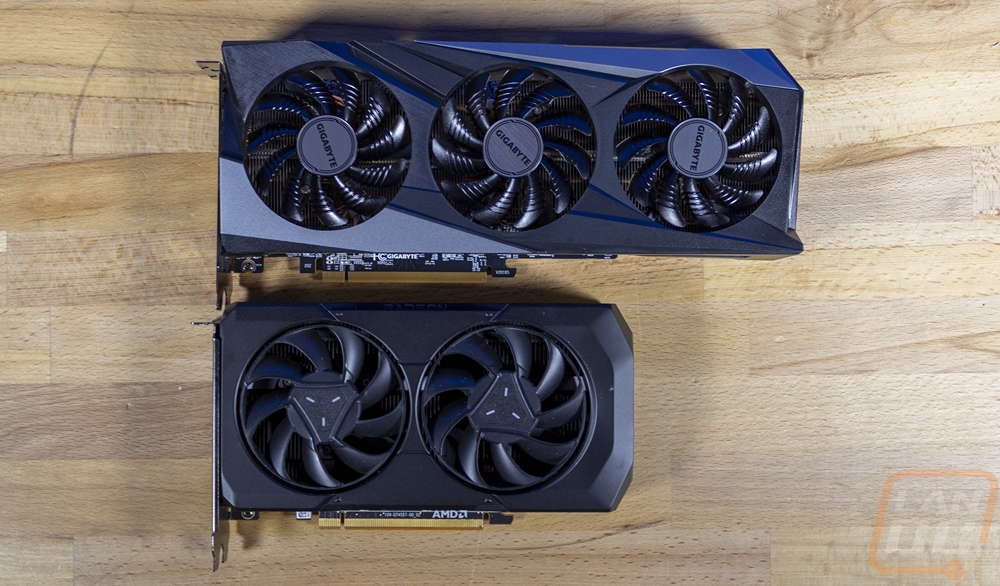
Now that we have had a few different RX 7600 cards in the office, it is interesting the range that you see when it comes to card sizing. The original reference design from AMD has a dual fan design but is very compact, not in the ITX card range but not that far off either. The RX 7600 Gaming OC 8G on the other hand is 284 mm long, its triple fan design is a lot longer than AMD's design. But at 155 mm tall it is not a super tall card like most cards these days and it is 50 mm thick making it a 2-and-a-half slot card. That is shorter than the Pulse RX 7600 that I previously took a look at but longer by 22 mm but then the RX 7600 Gaming OC 8G is a little thicker by 5 mm as well.
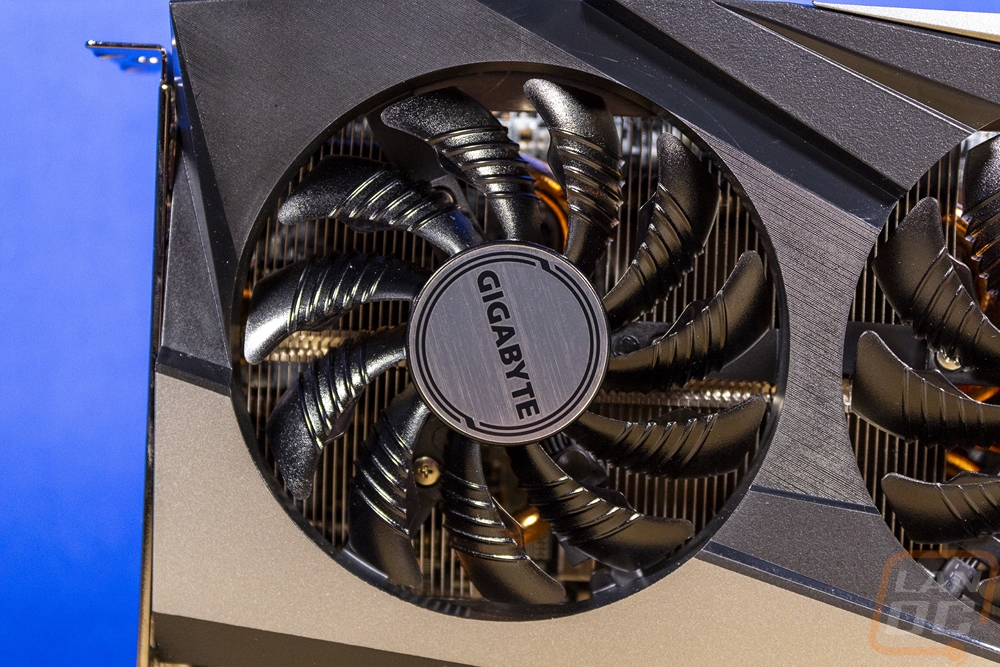
Gigabytes Windforce cooler design is always interesting to check out because they utilize two different fans with their triple fan designs. You can see that here again with the center fan having all of its blades bending clockwise where the two other cards are counter-clockwise. The center fan spins the opposite of the other two fans by design, this means that on the left and right sides of the middle fan where it is close to the other fans, they blow air in the same direction. If it was three of the same fan they would fight against each other. All three fans are the same width which if you measure from the edge of the shroud opening is 80 mm each or 76 mm from tip to tip. The blades have a silver metal finish on their center caps with the Gigabyte logo on them. The fans themselves aren’t like what I saw on the 4070 Ti Gaming OC, these are Gigabytes older fan design. They have 11 blades and each blade has 5 of the ribs on them whereas the newer fans have a matt finish and just three fins which are less aggressive as well.
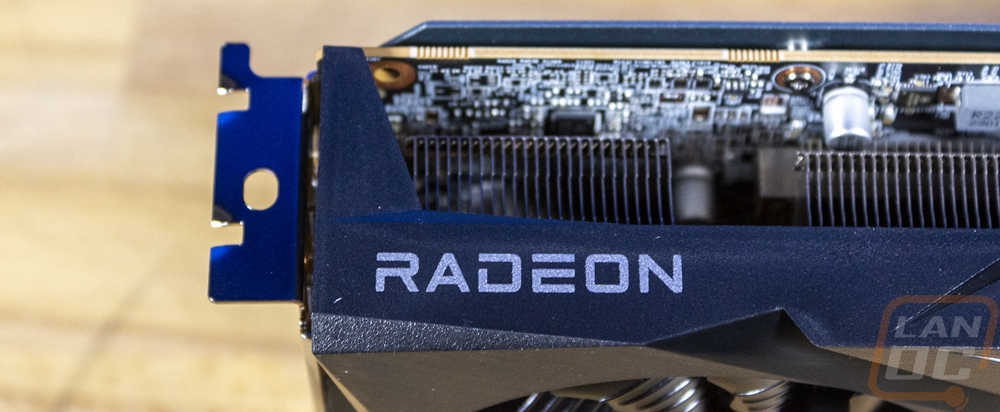
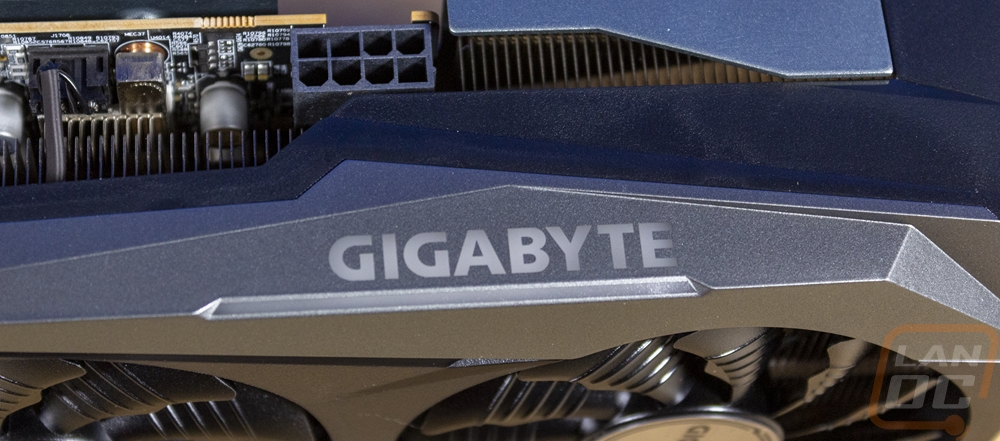
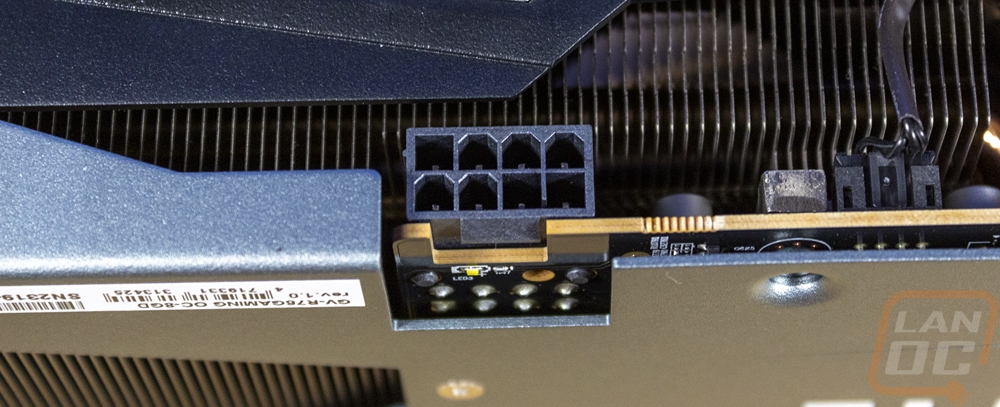
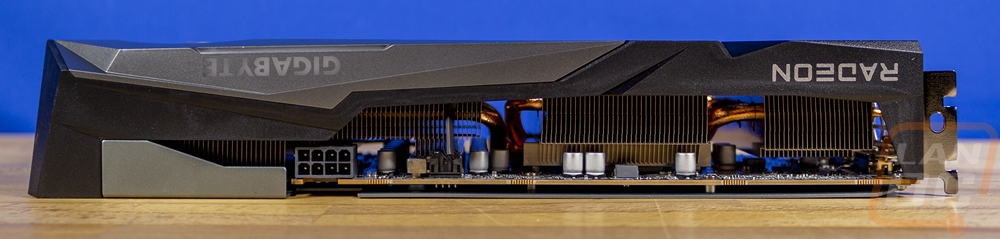
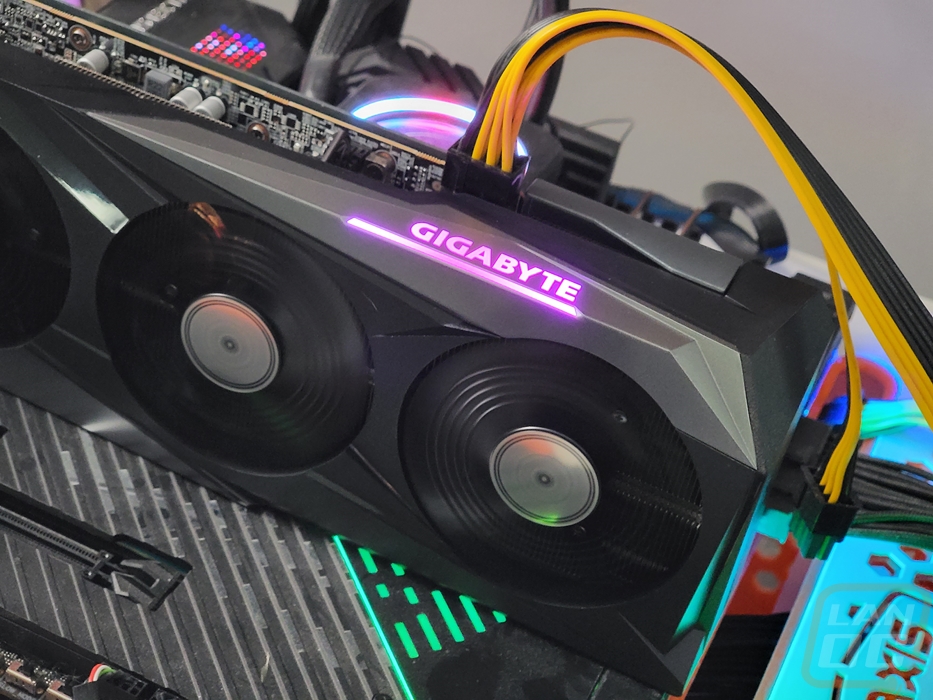
Up on the top edge, the fan shroud does wrap around and they have the Radeon branding printed on it in silver near the PCI bracket end of the card. Past the middle right at the end of the PCB, the shroud also has the Gigabyte branding which is backlit with RGB lighting. I’ve spoken about this before but I like RGB accents and lighting but really prefer to avoid the backlit branding, it starts to look like Times Square in your PC. On the other side of the Gigabyte logo, they also have the power connection up top. The RX 7600 Gaming OC 8G has one 8-pin for power and that is flipped around to have the clip towards the PCB which keeps things tight and means the heatsink can be closer to the connection.
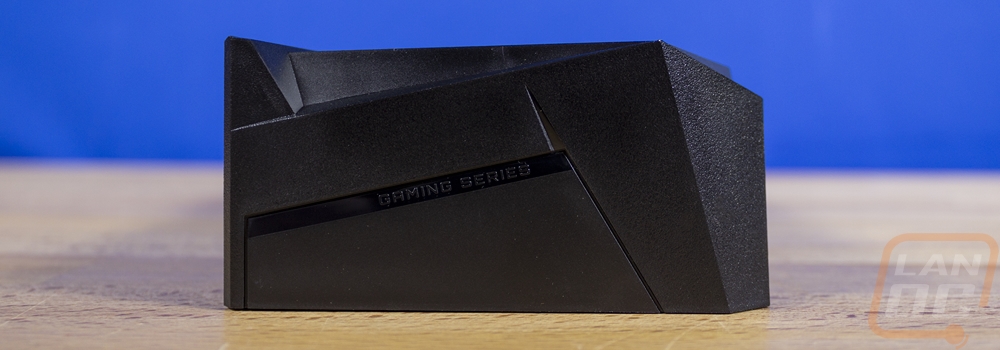
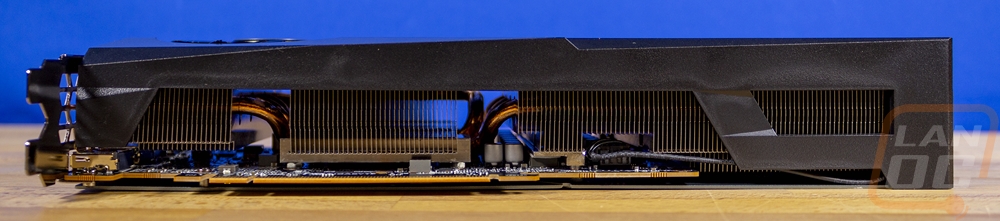
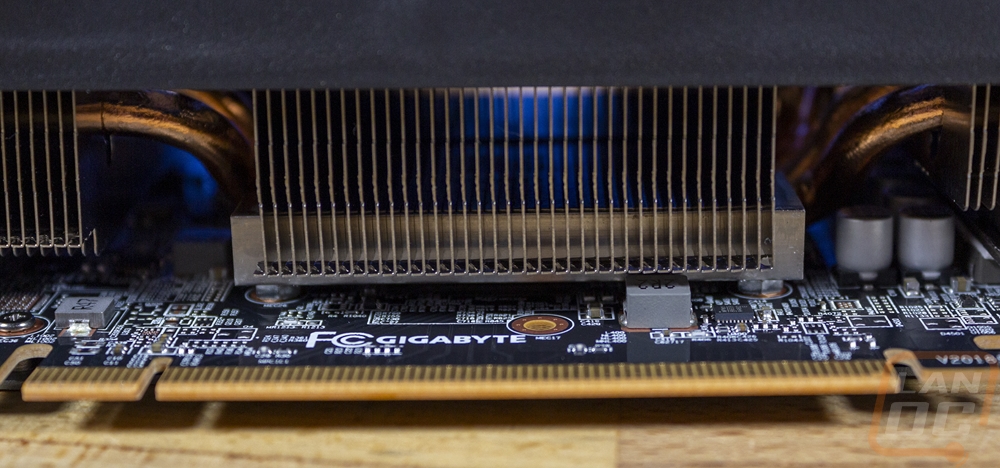
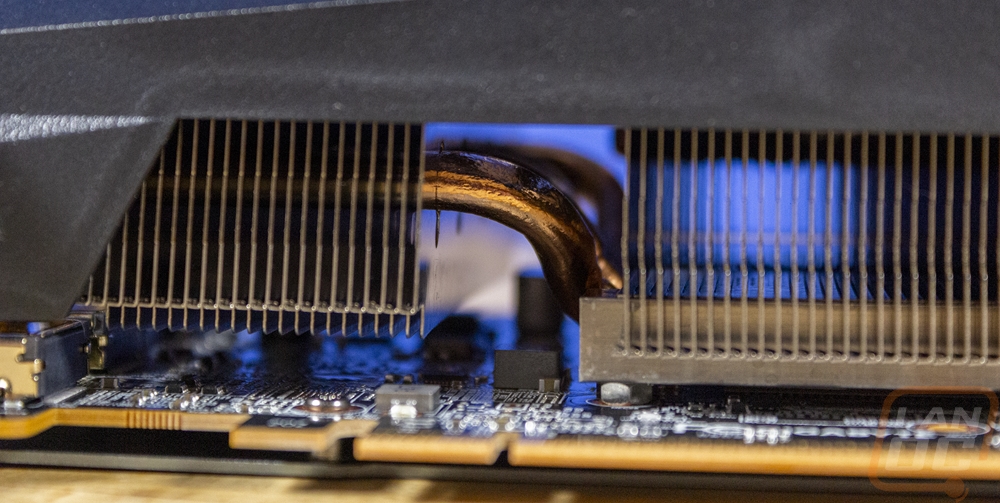
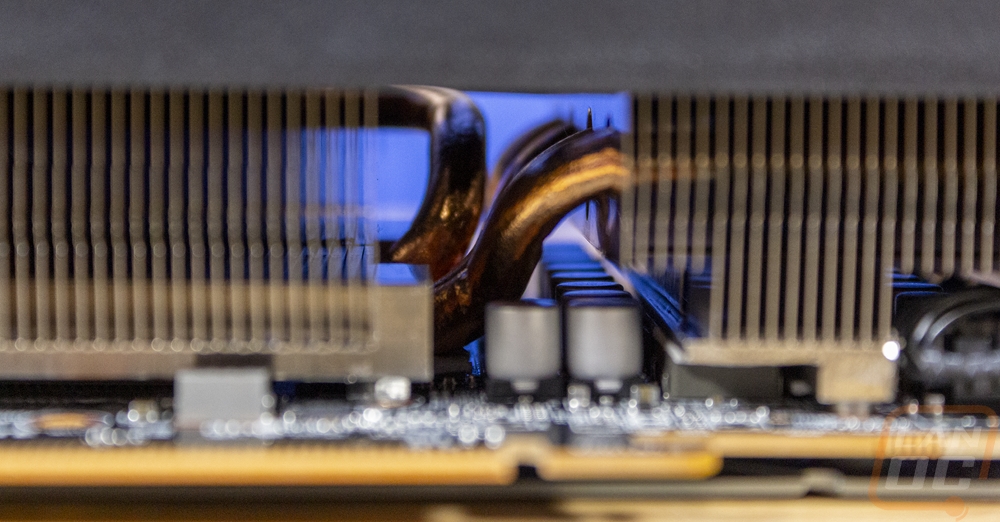
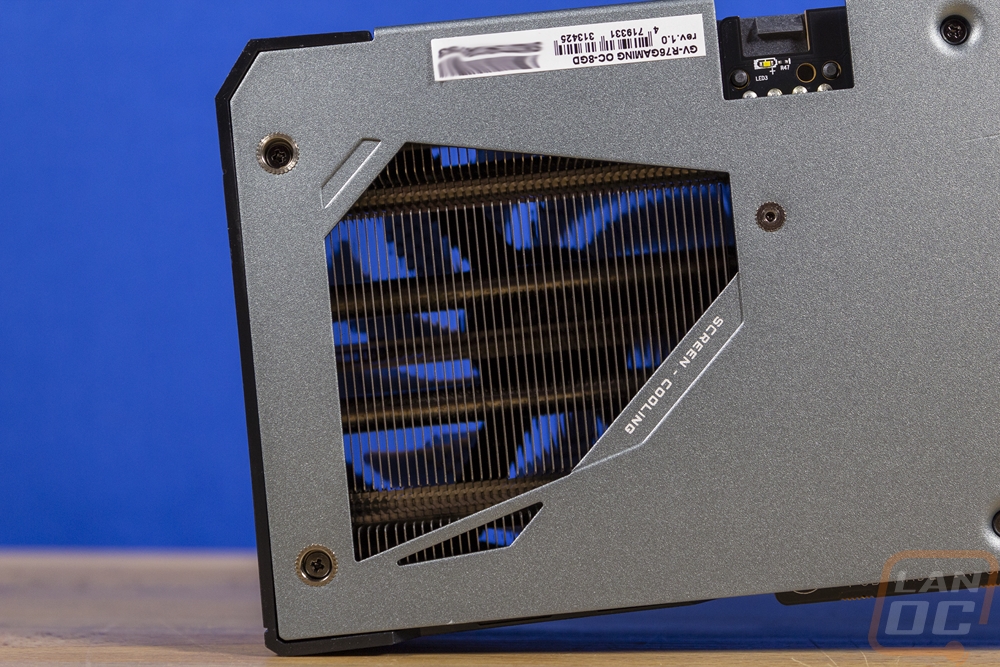
Looking around at the edges of the RX 7600 Gaming OC 8G we can start to get a better idea of the cooler on it as well. The top edge has a surprising amount of the top covered by the fan shroud that wraps around, especially toward the end of the card. That view also shows us that the cooler is aluminum sheet metal fins with copper heatpipes. The fins are in a vertical orientation that blows the air from the axial fans up out of the top and down out of the bottom of the card. The end of the card is completely covered with the plastic shroud but does have “Gaming Series” molded into it. Then on the bottom, we can see that the heatsink is split up into three sections. The center section sits on top of the heatspreader on the GPU and memory. The heatpipes run right on top of them. Then the two other heatsinks are to the left and right and the heatpipes have a small section between the heatsinks to adjust up into the center of the heatsink to better spread out the heat. The right side of the card has the largest heatsink and that heatsink extends all the way down even with the PCB once the PCB ends and we have the blow-through section. Beyond that, the heatsink does form around most of the components to utilize the rest of the space.
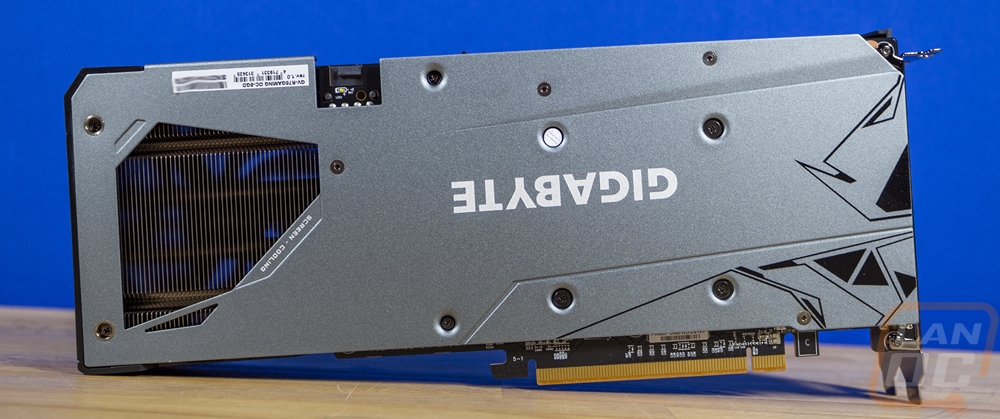
The backplate on the RX 7600 Gaming OC 8G is metal and runs the length of the card which goes well beyond the end of the PCB. You can see where the PCB ends easily here because Gigabyte has cut out a blow-through section in the backplate to help with cooling. The backplate has a white sticker with the serial number and model information on it. Beyond that, it has a grey finish and a few angular designs printed on it up at the front of the card in black.
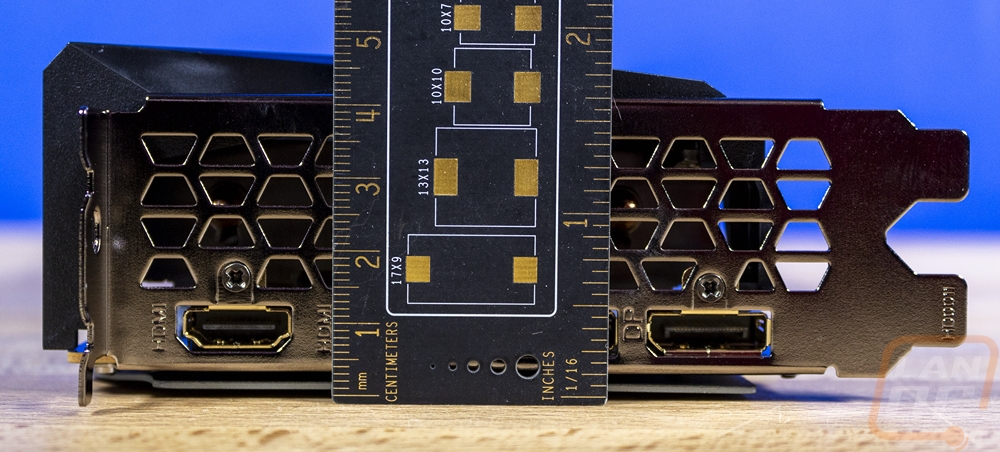
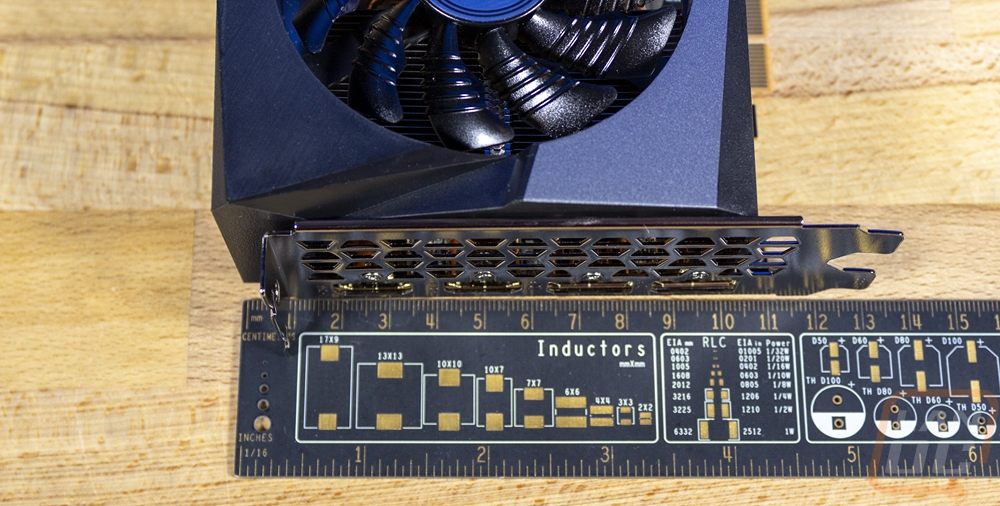
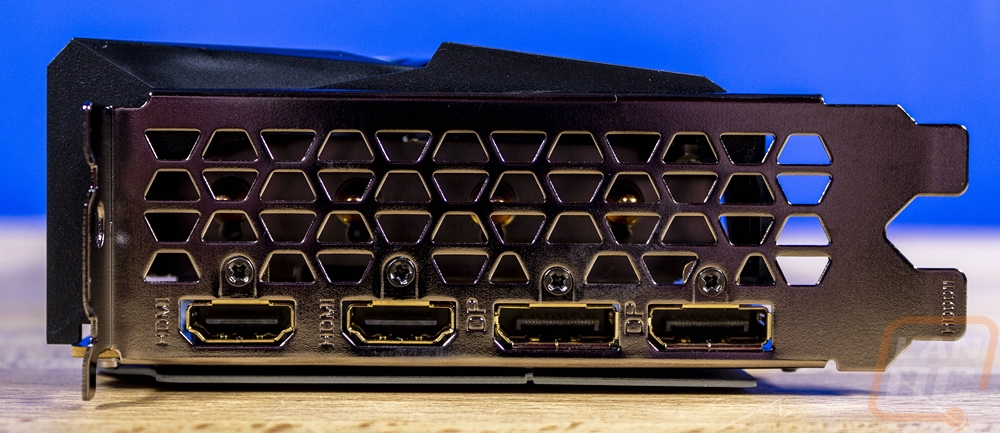
For display connections the RX 7600 Gaming OC 8G does have four connections on its back bracket. But unlike the reference card, which had three DisplayPort connections and one HDMI which is the go-to standard these days. Gigabyte has gone with two HDMI and then two DisplayPorts with the two HDMI up closer to the top edge of the PCI bracket. This setup does make sense though, with the RX 7600 being a 1080p designed card the odds are a little higher than users may be using older monitors and might not even have DisplayPort on some displays. Beyond the connections, the RX 7600 Gaming OC 8G does have ventilation across the rest of the back bracket even though the cooler isn’t designed to push air in that direction. The bracket itself has a slightly tinted metal finish, I’m always pushing to see blacked-out cards having black PCI bracket to match but for the RX 7600 Gaming OC 8G this is fine and matches the color scheme as well.
I mentioned just how much longer the RX 7600 Gaming OC 8G is compared to AMDs reference design earlier. Well putting them next to each other shows this off even more. The triple fan Windforce cooler nearly lines up with the reference card two fan design for the first two fans, then to fit the third fan they have the extra length.
Before getting into testing I did also get a picture of the RGB lighting in action. The Gigabyte logo lights up as I mentioned but I didn’t notice before that there is an accent line under that as well. The lighting looks good and works with Gigabytes software so you can color match it to your build. I would prefer it to be all accents and no logo lit up, but at least it isn’t completely over the top either.
Test Rig and Procedures
CPU: Intel Core-i9 13900K – Live Pricing
PL1=PL2: 253, τ: 56 / 307A
Motherboard: Asus Z790 Extreme – Live Pricing
Cooling: Corsair H100i Elite LCD Display - Live Pricing
Noctua NT-H1 Thermal Paste - Live Pricing
Memory: Crucial 32GB Kit (2 x 16GB) DDR5-5600 UDIMM– Live Pricing
Storage: Sabrent Rocket Q4 2TB – Live Pricing
Power Supply: be quiet! Dark Power Pro 13 1600W- Live Pricing
Case: Primochill Wetbench - Live Pricing
OS: Windows 11 Pro 64-bit - Live Pricing
|
Our Testing Procedures |
|
|
3DMark |
All 3DMark-based tests are done using the most recent version. We test using all three versions of Fire Strike, Both Time Spy and Time Spy Extreme, and Speed Way. Tests to look at ray tracing performance are done with Port Royal when supported and for Nvidia cards that support DLSS, the DLSS subtest is also done at 1440p with the performance setting and DLSS 2.0 as well as a look at DLSS 1, 2, and 3 at 4K. |
|
Unigine Superposition |
1080p Extreme and 4k Optimized benchmarks along with the VR Future test are done. The VR test is done at the Oculus resolution |
|
VRMark |
Only the Blue room test is run |
|
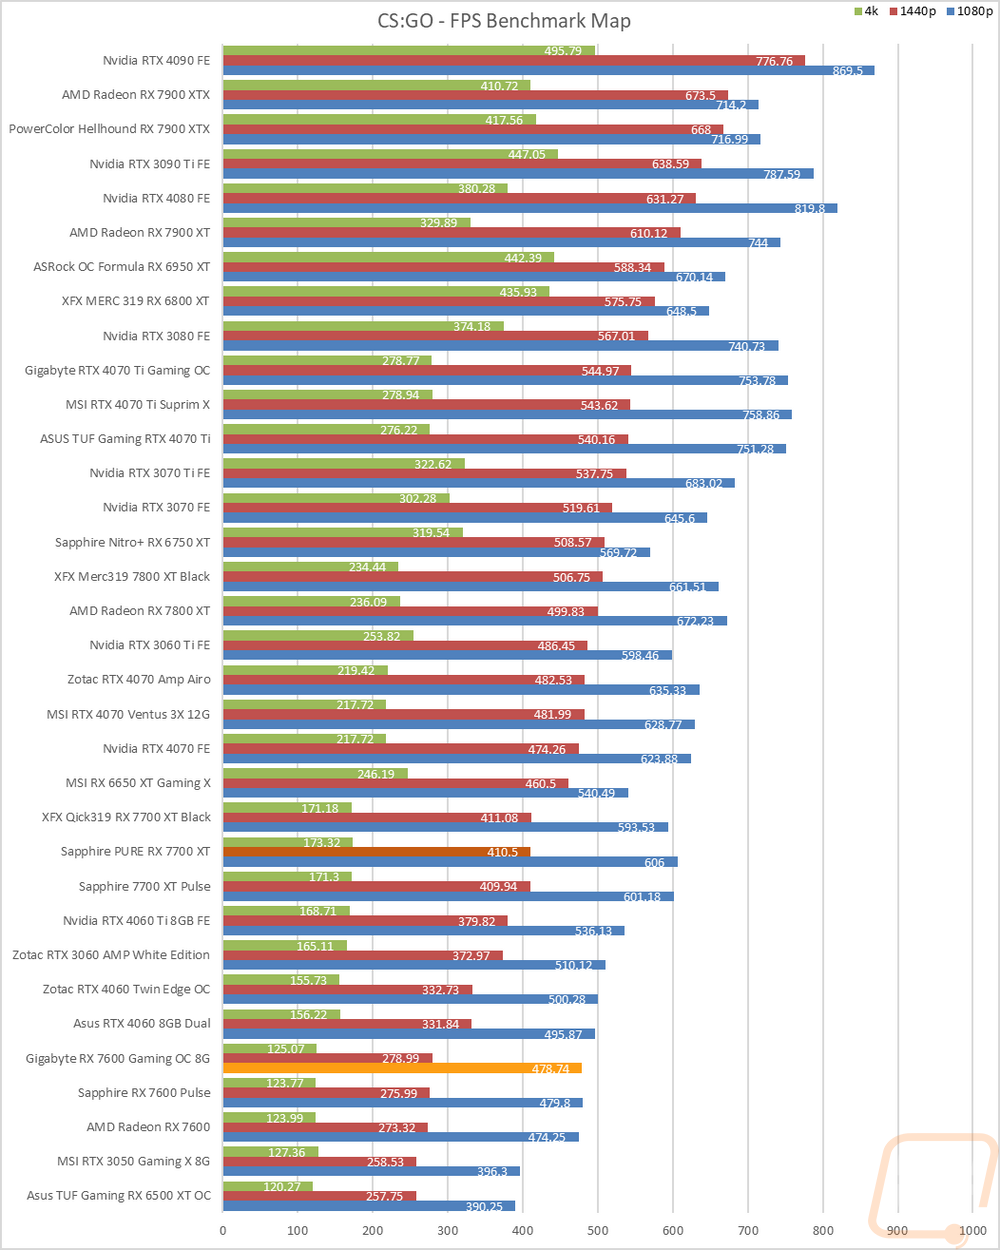
CS:GO |
This test is done using the workshop map called CS:GO Benchmark. You can find more information at this link. https://www.gamingpcbuilder.com/how-to-install-csgo-fps-benchmark-map/ I test at 1080p, 1440p, and 4K resolutions. All auto settings are turned off and detail is set to their highest settings. shadow quality high, model texture detail high, shader detail very high, AA set to 16x, uber shaders enabled |
|
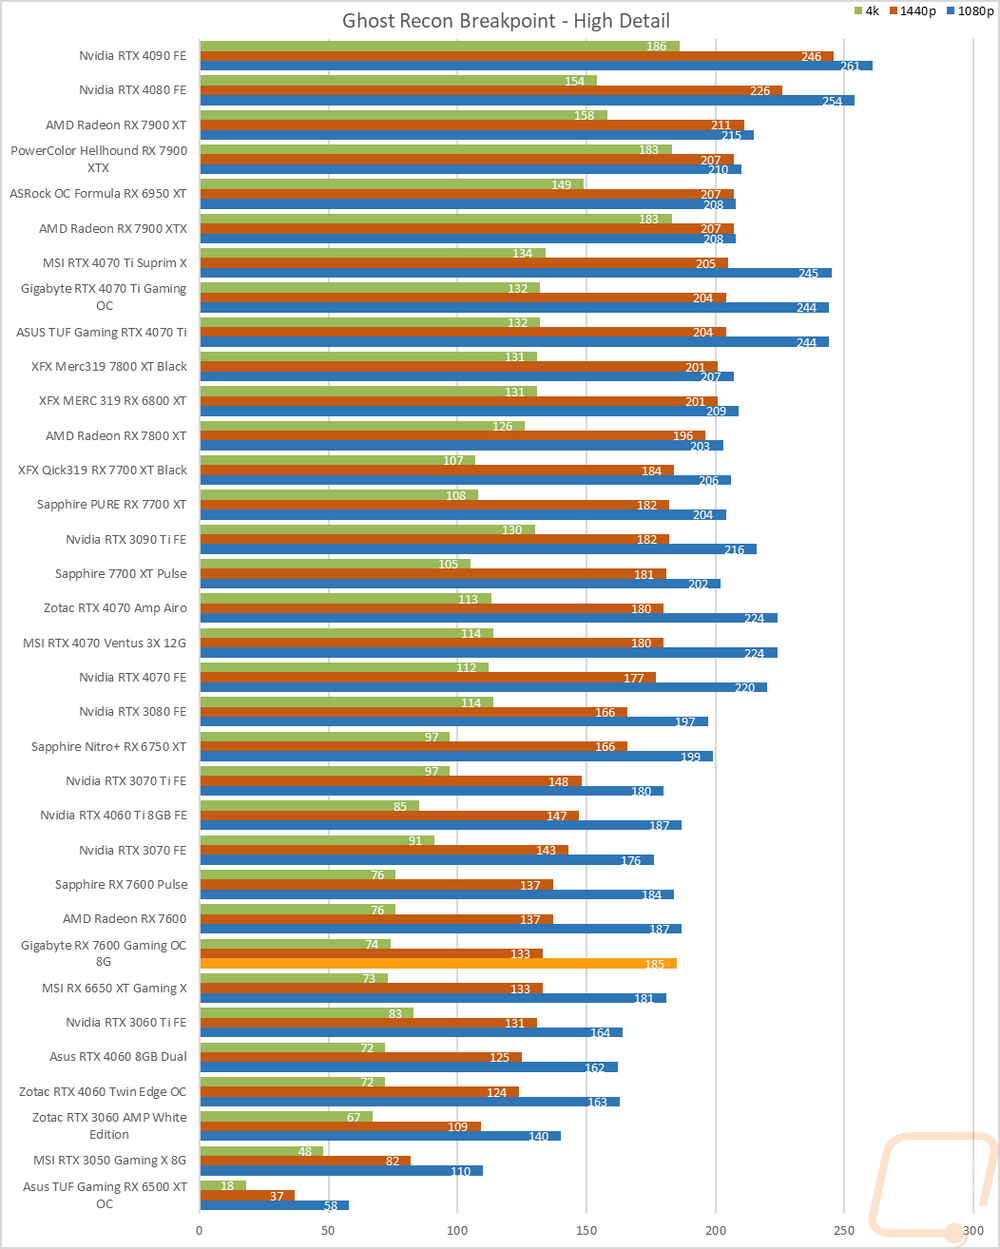
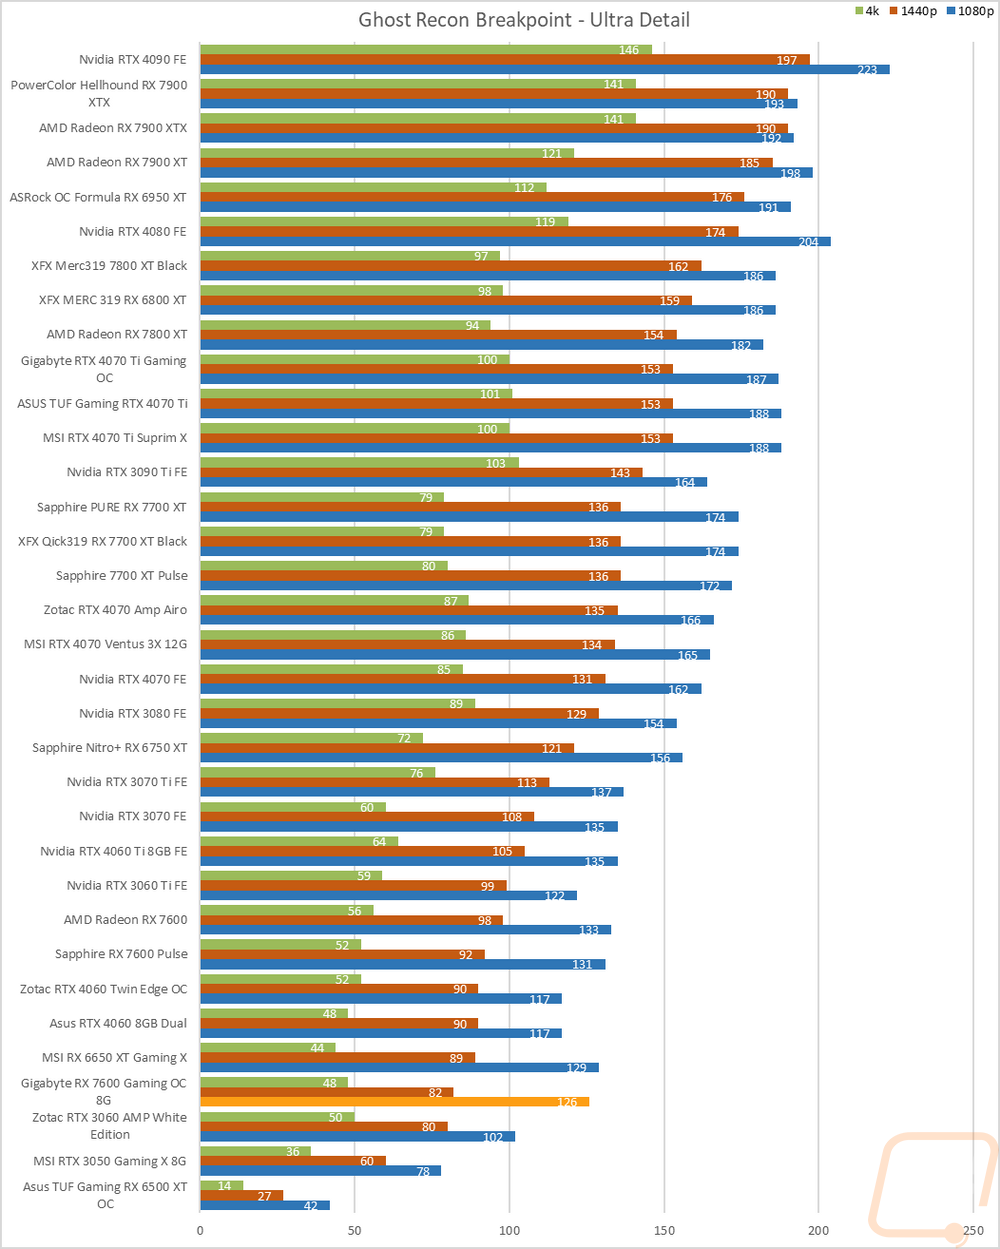
Ghost Recon Breakpoint |
Built-in benchmark tested at 1080p, 1440p, and 4k with the Ultra and Medium detail settings |
|
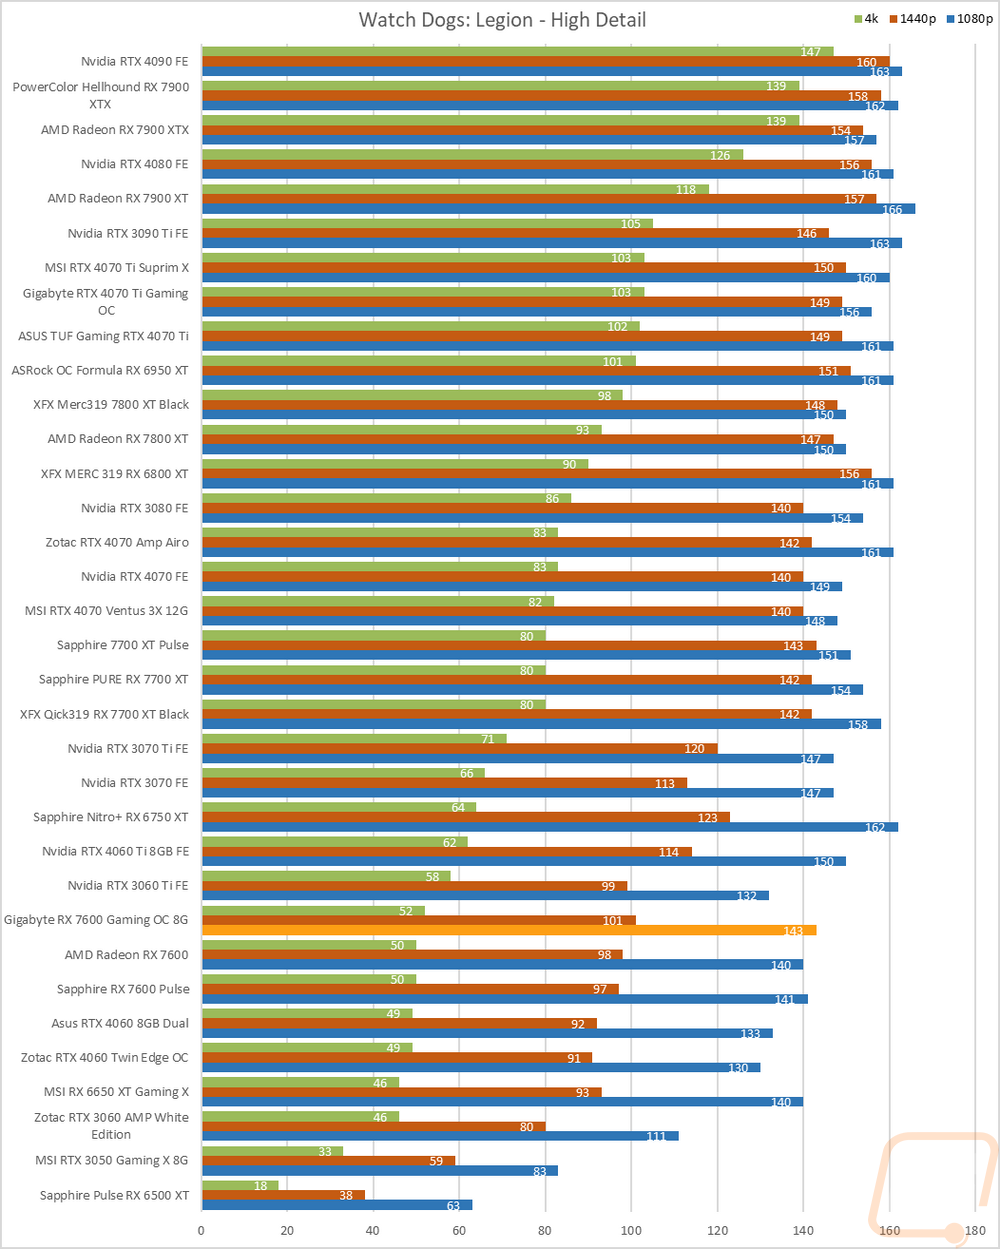
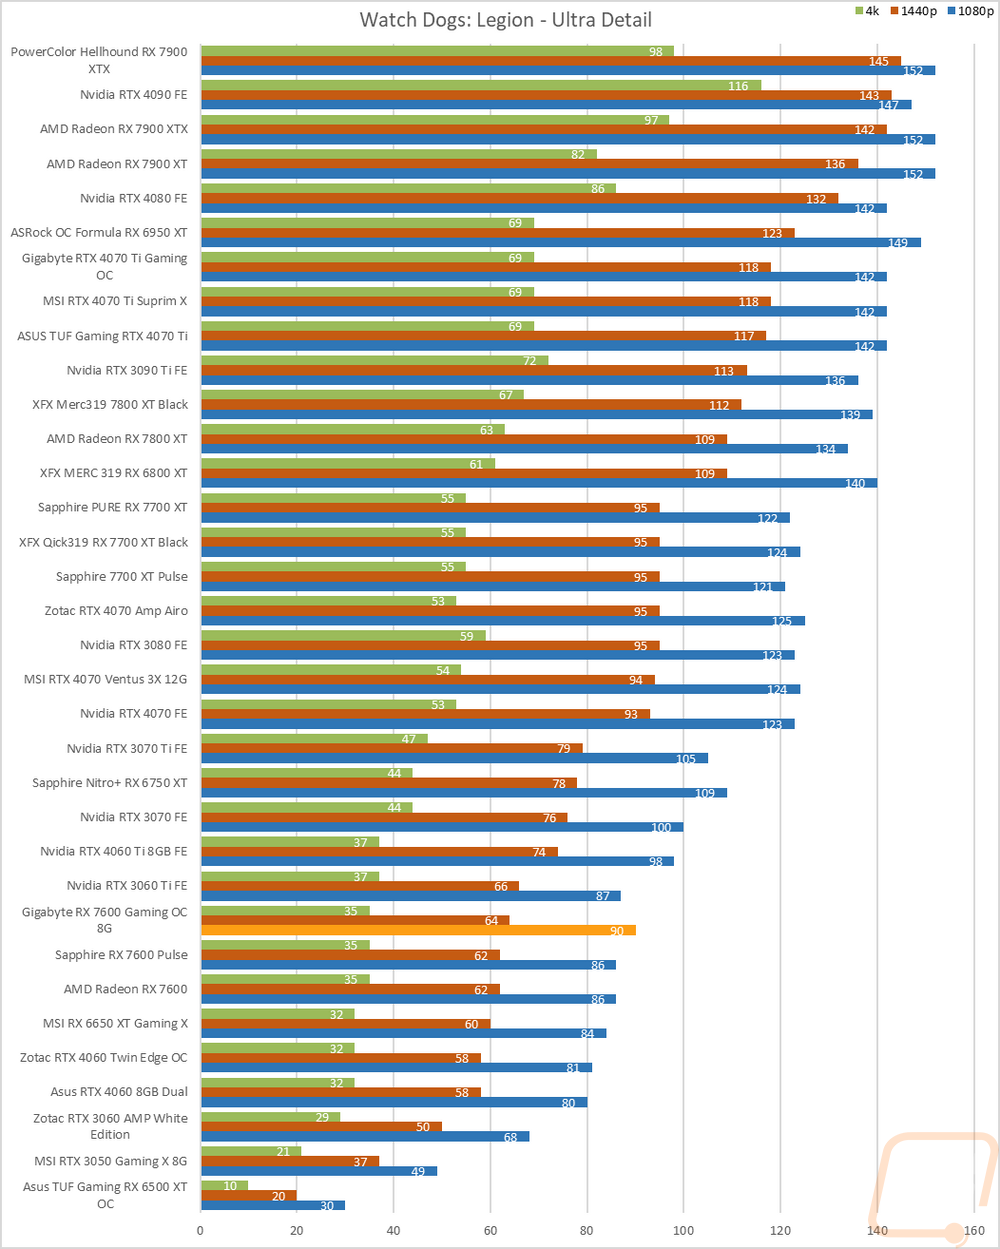
Watch Dogs: Legion |
Built-in benchmark testing at ultra and high details. Tested at 1080p, 1440p, and 4k. I also do RTX and DLSS testing on Nvidia cards at 4K using the Ultra detail settings as a base as well. |
|
Borderlands 3 |
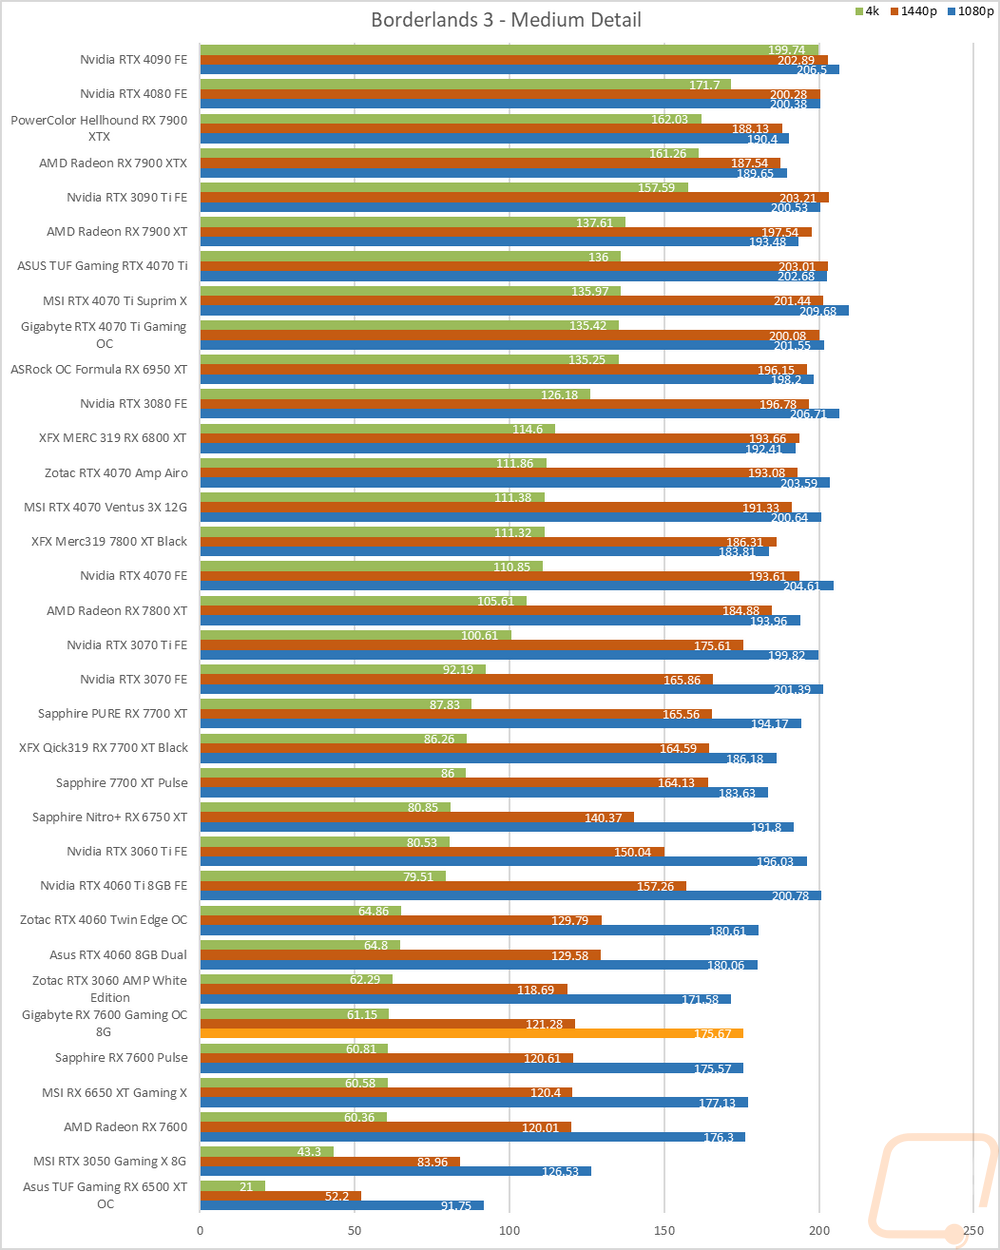
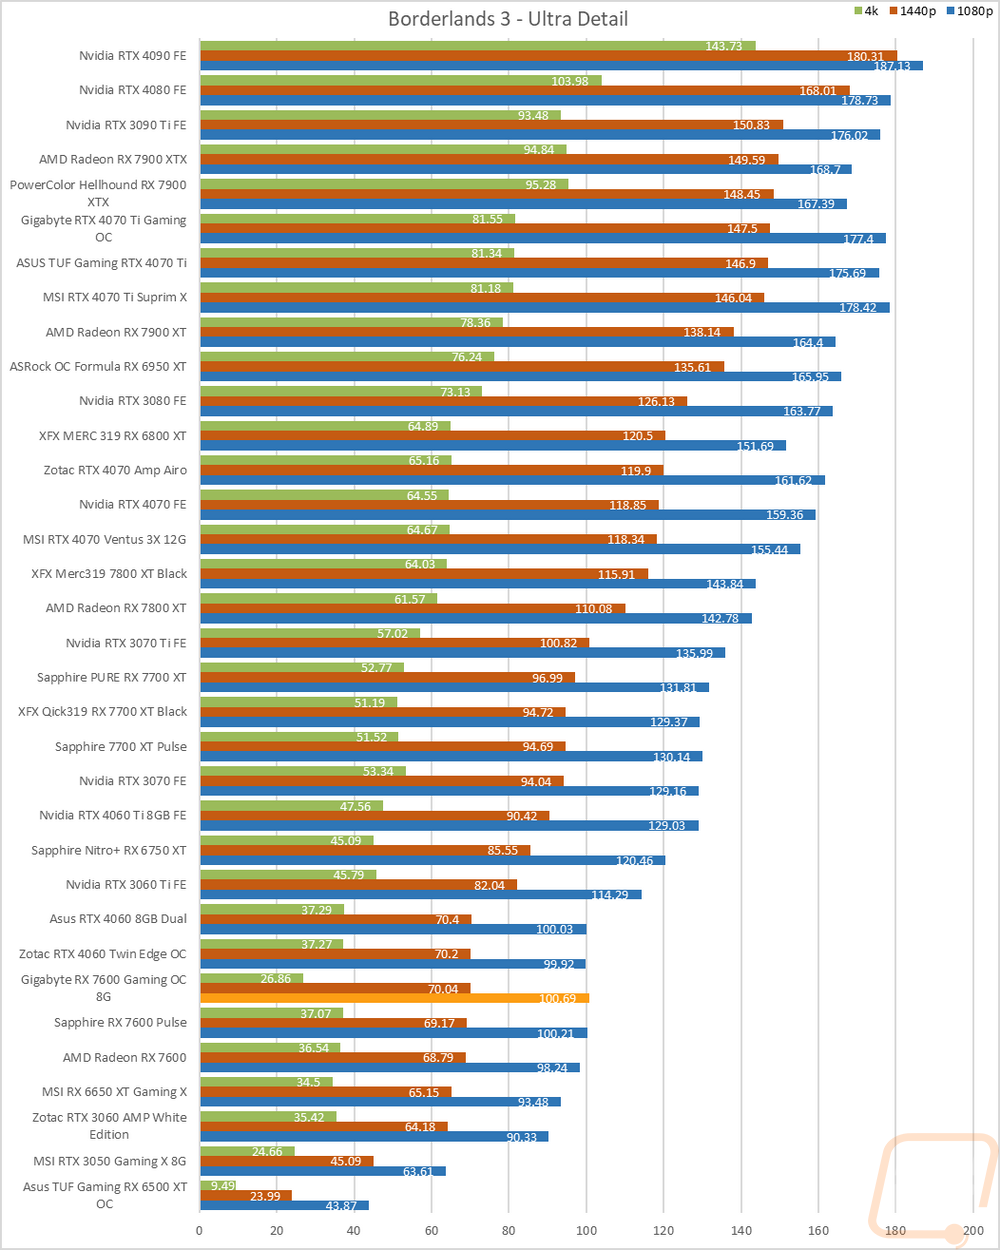
Built-in benchmark testing with the ultra detail setting and medium detail setting, done at full screen with default settings at 1080p, 1440p, and 4k on DX11 |
|
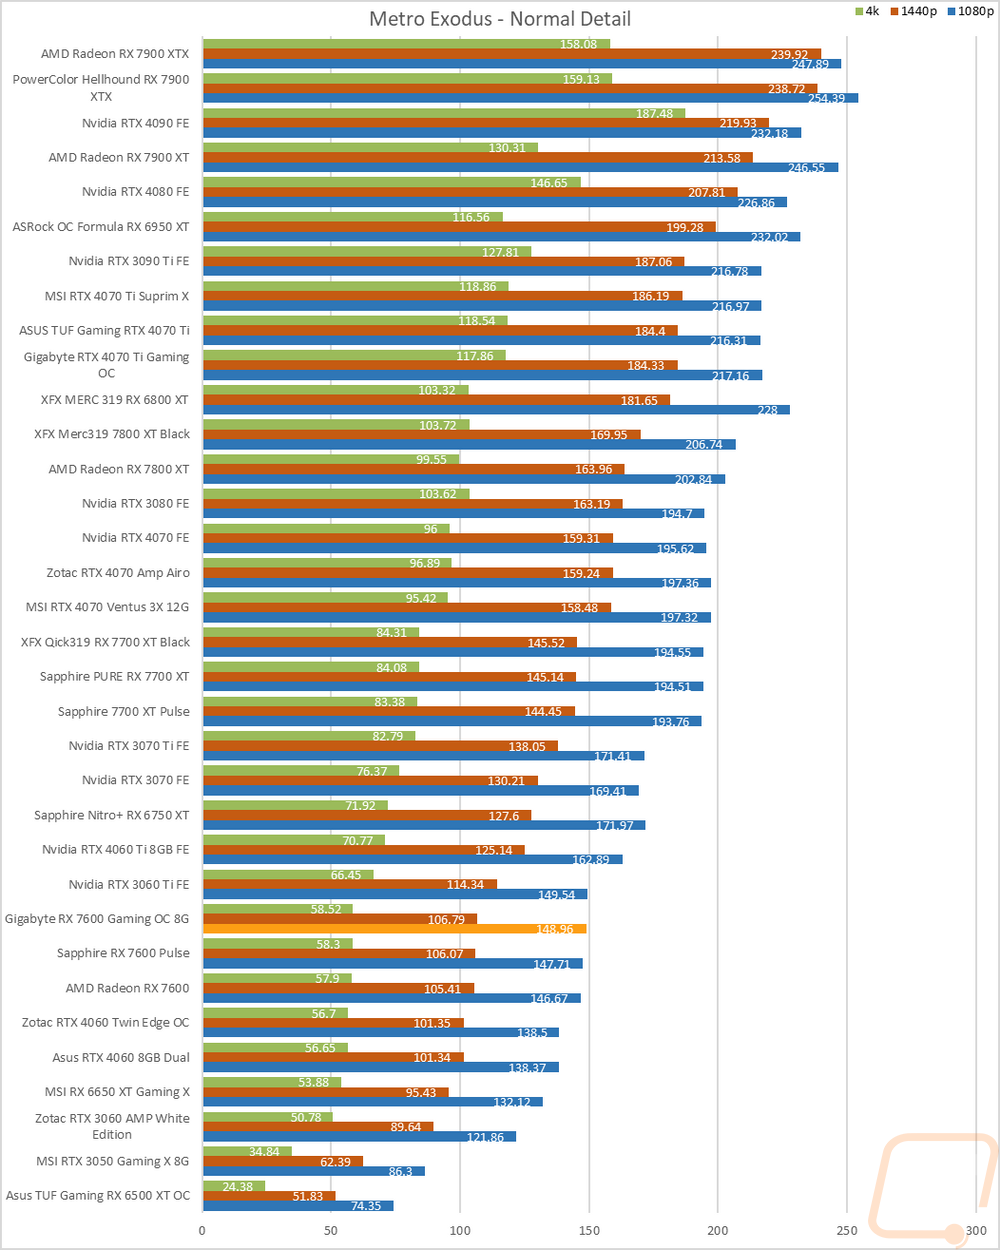
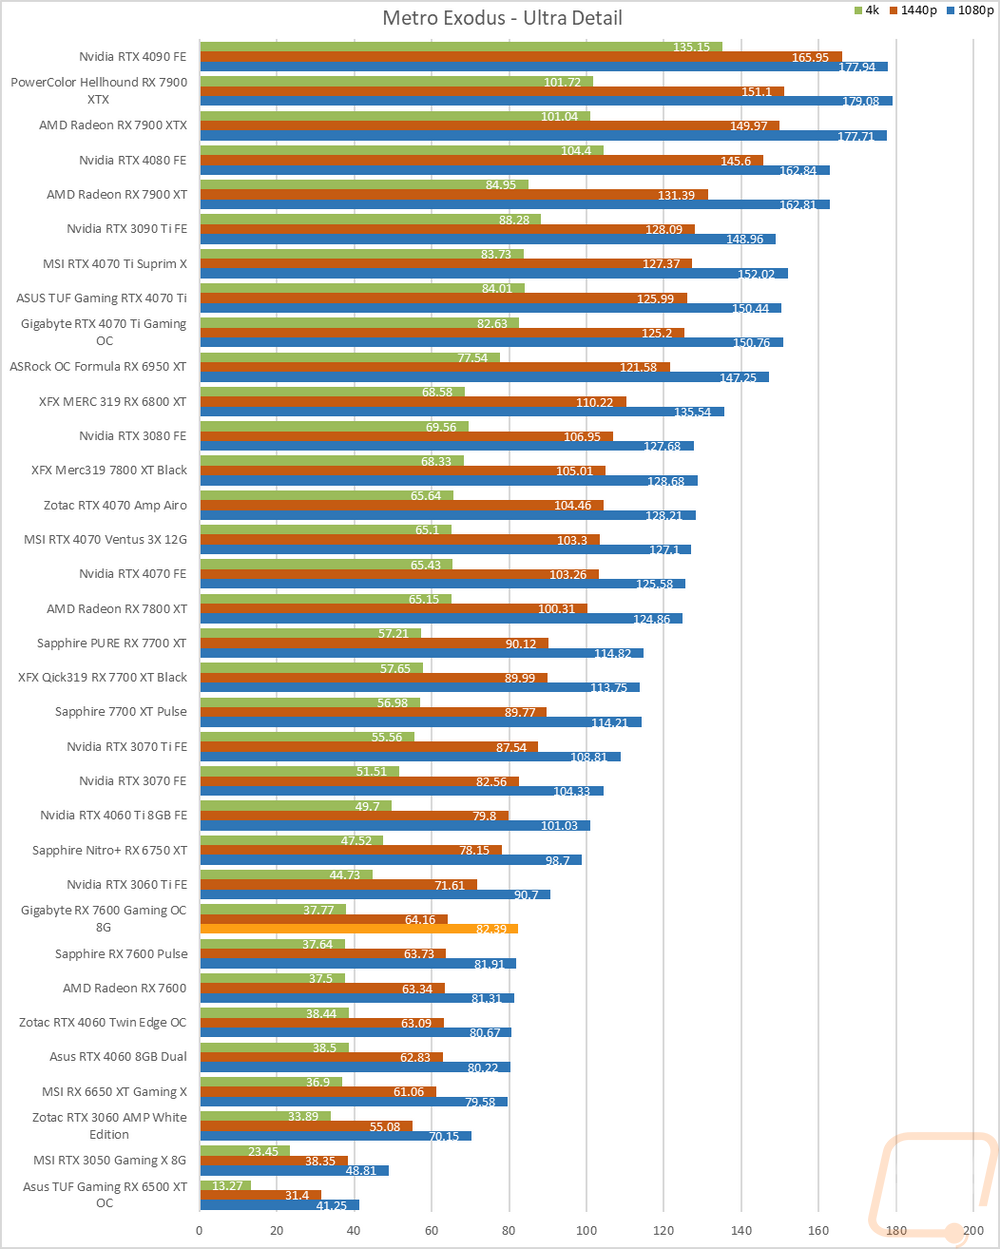
Metro Exodus |
Using built-in benchmark, testing at ultra and normal details at 1080p, 1440p, and 4k. I also do RTX and DLSS testing at 4K with the ultra-detail base settings for Nvidia cards as well. |
|
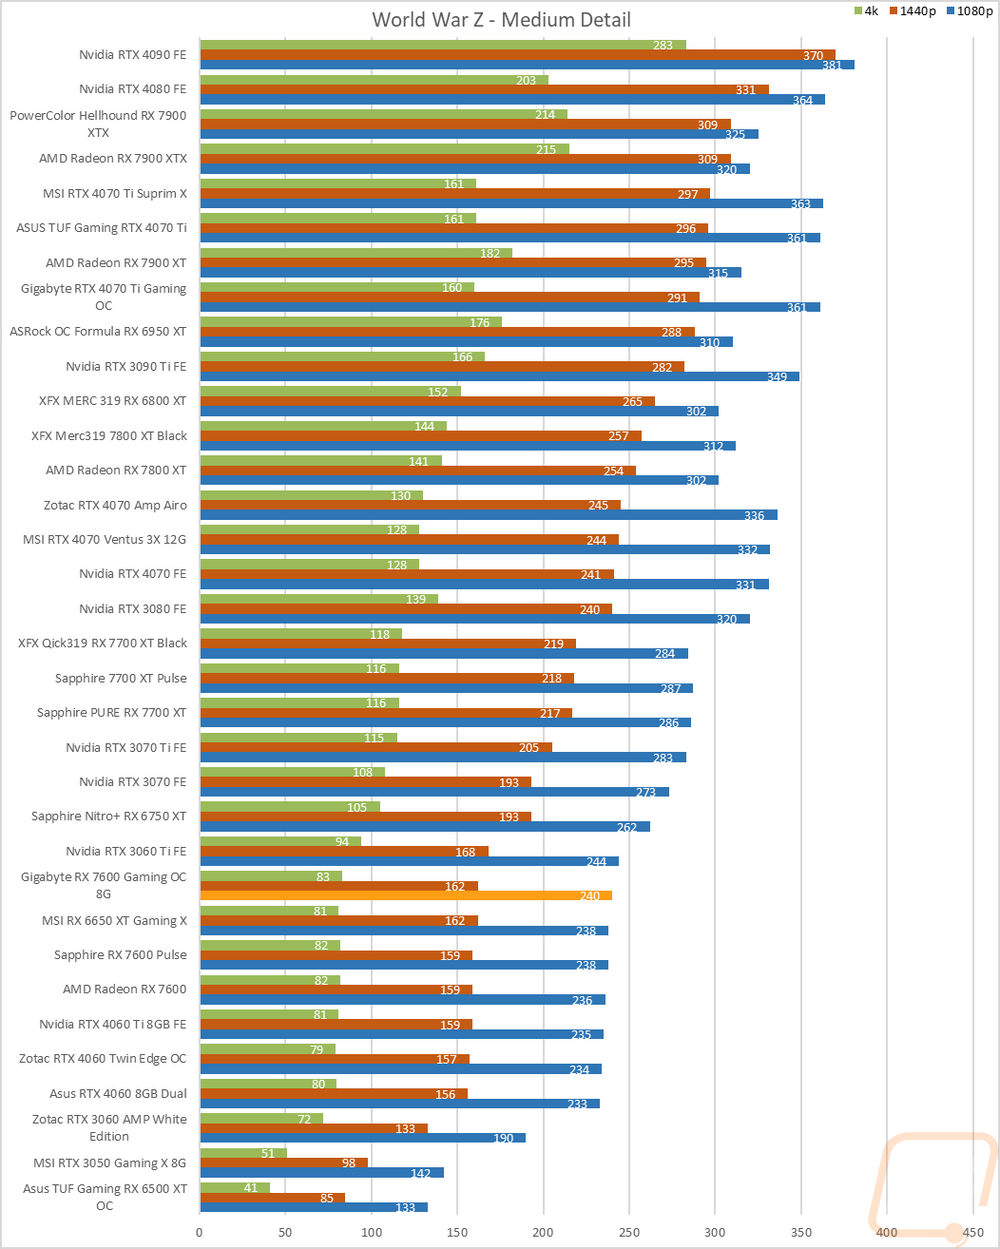
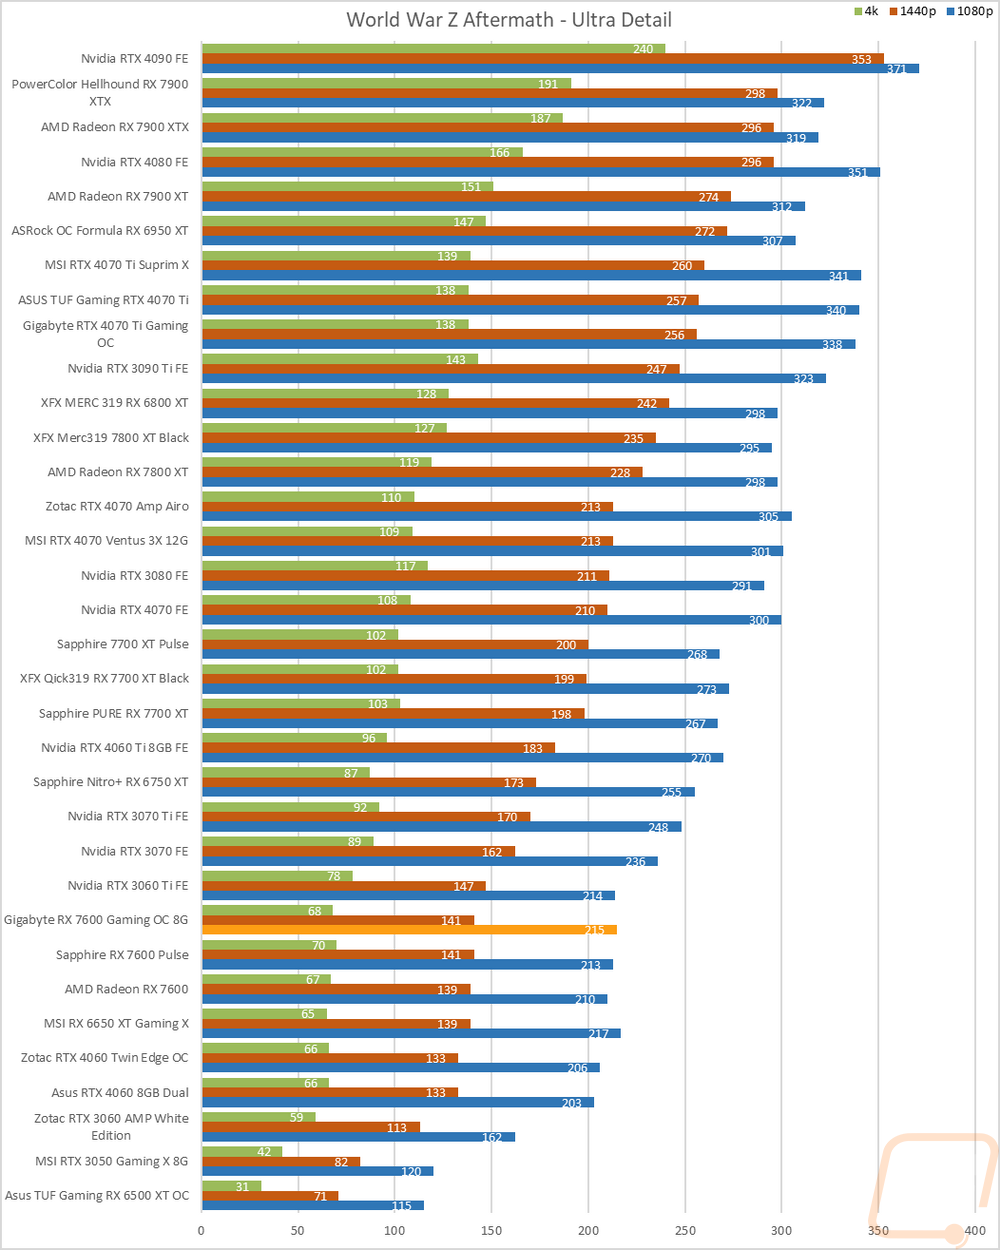
World War Z Aftermath |
Built-in benchmark in DX11 testing both the Ultra detail and Medium detail levels at 1080p, 1440p, and 4K resolutions |
|
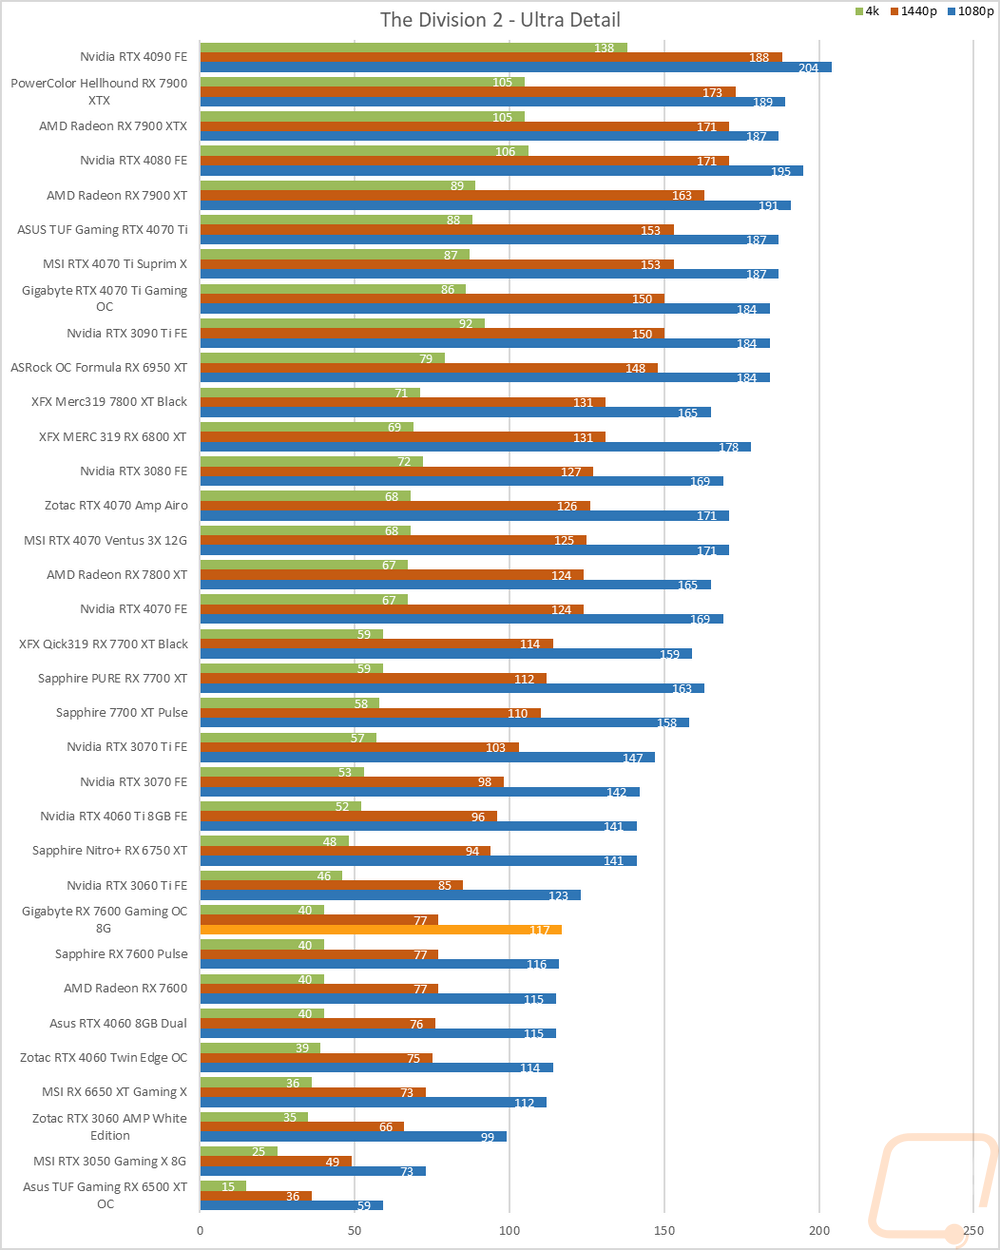
The Division 2 |
Built-in benchmark at Ultra detail with V-Sync turned off at 1080p, 1440p, and 4k resolutions. |
|
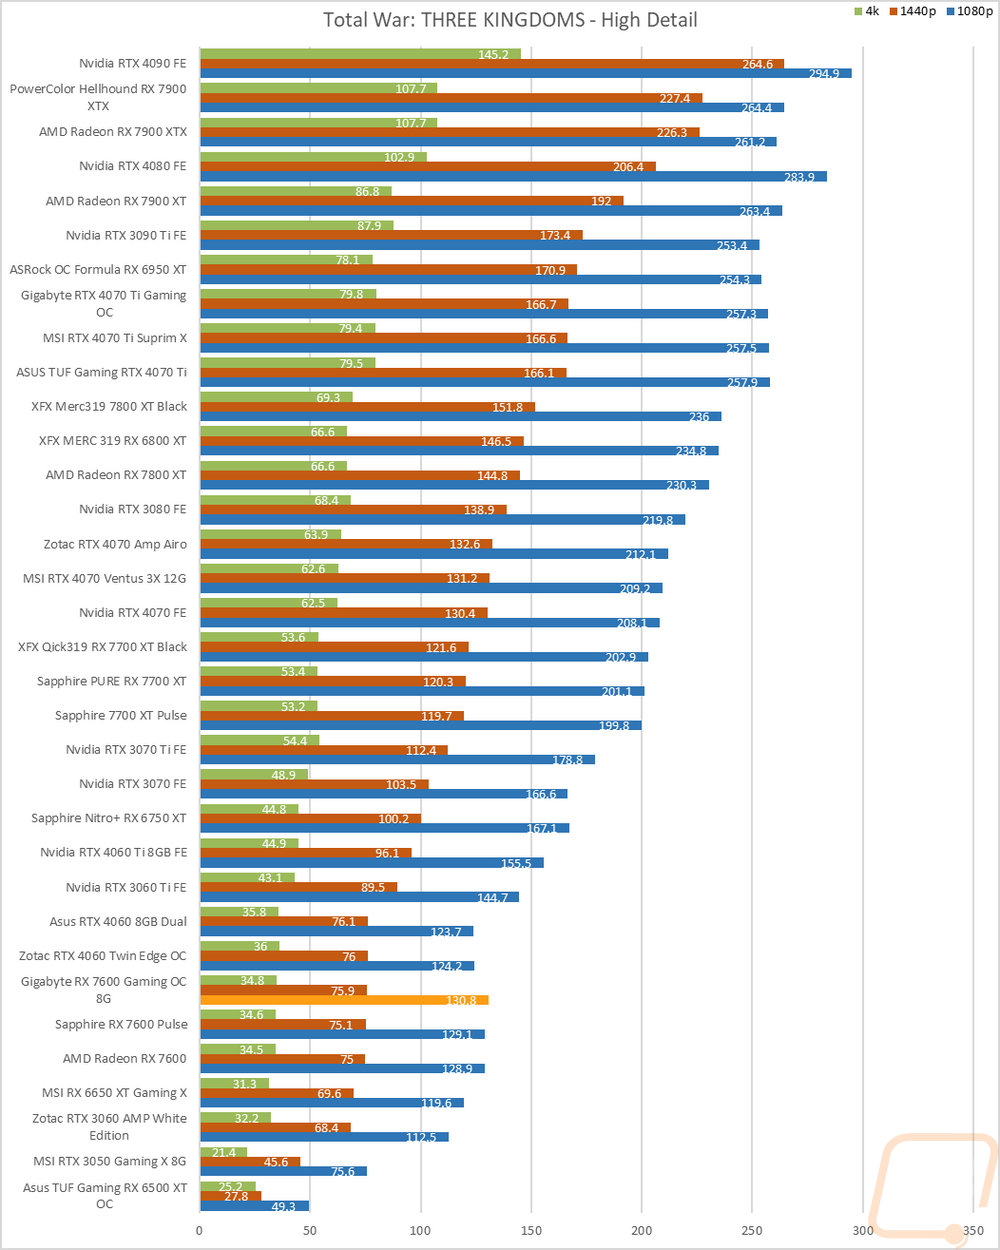
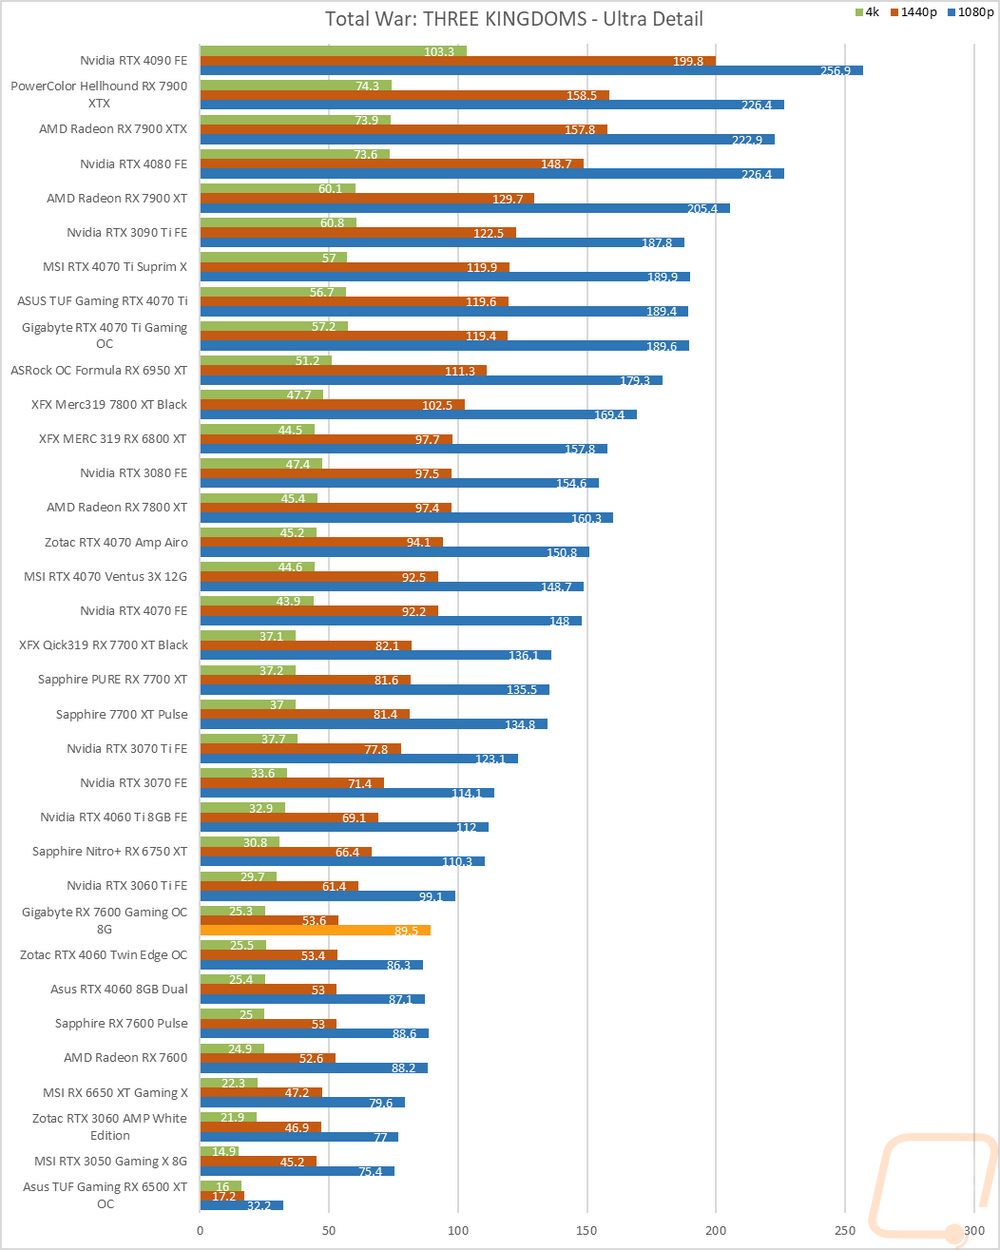
Total War: Three Kingdoms |
Built-in benchmark using the Battle Benchmark setting. Tested at 1080p, 1440p, and 4k at both high and ultra detail settings |
|
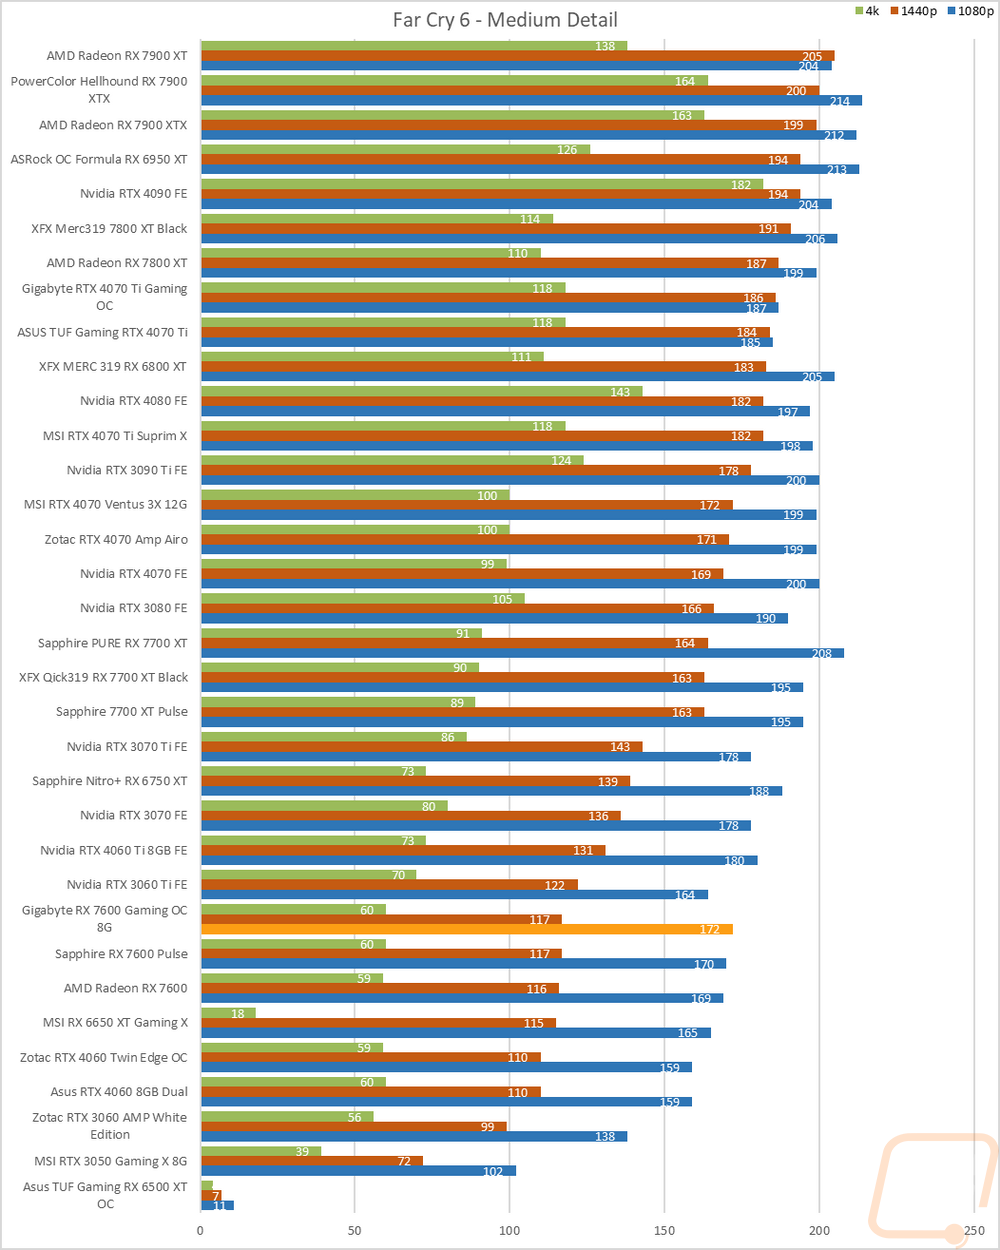
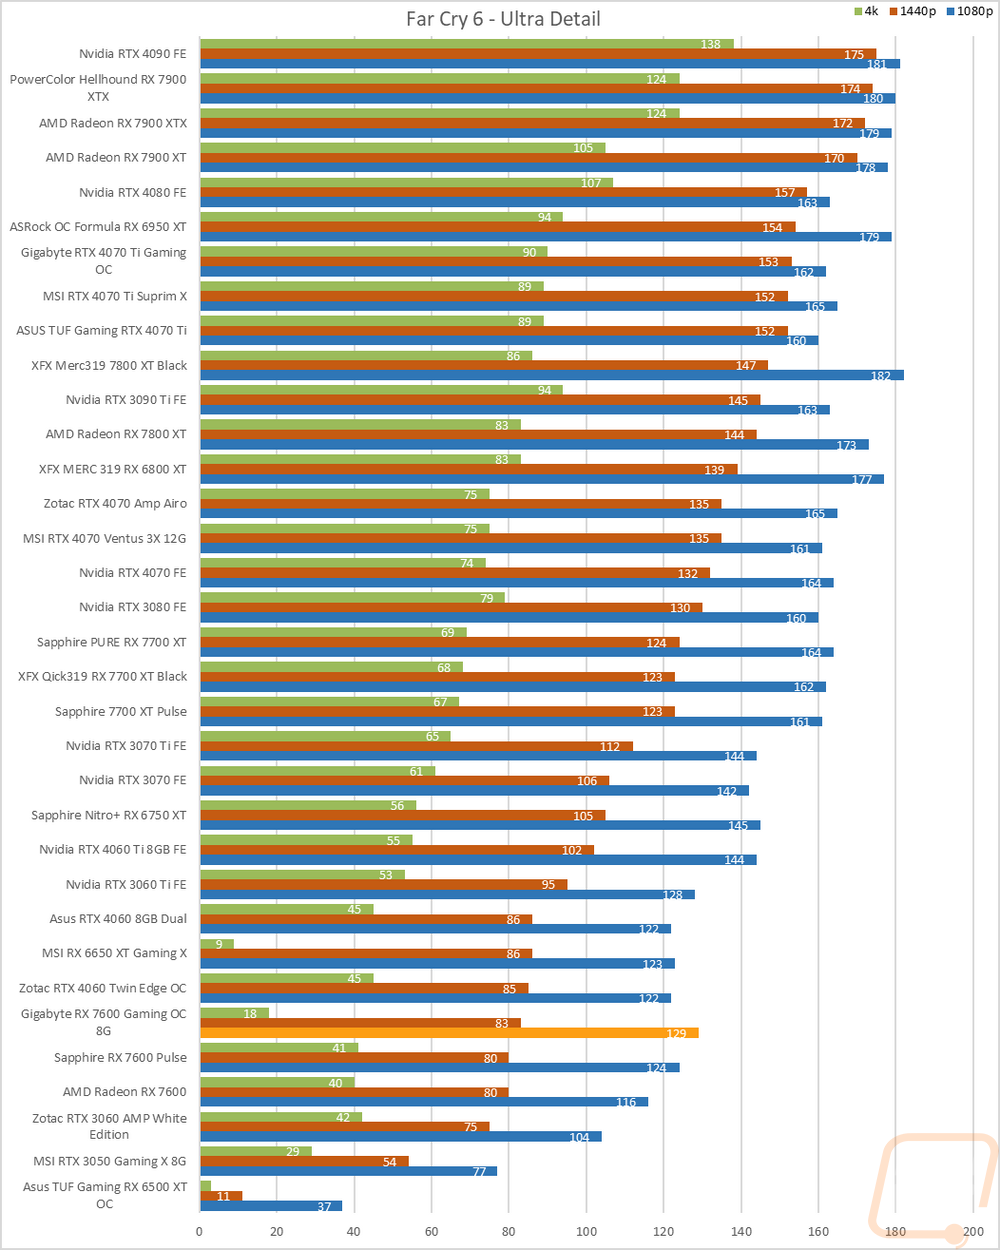
Far Cry 6 |
Built-in benchmark tested at 1080p, 1440p, and 4k with the Ultra and Medium detail settings |
|
V-Ray 5 |
V-Ray 5 benchmark us run with CUDA and RTX settings on cards that support it |
|
Boundary Benchmark |
Testing different DLSS detail levels on cards that support it. All testing is done at 4k with RTX on |
|
Bright Memory Infinite RTX Benchmark |
Benchmark all of the different RTX detail levels. Resolution at 4k and DLSS on balanced for each test |
|
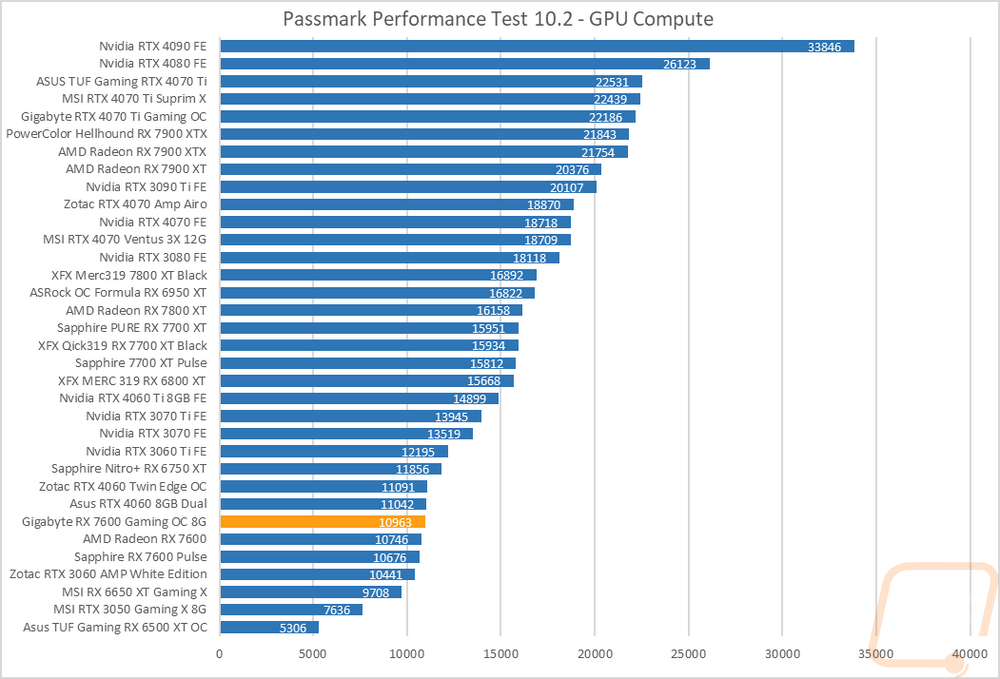
Passmark Performance Test 10.2 |
Test using the GPU Compute Score inside of PassMark's Performance Test 10.2 |
|
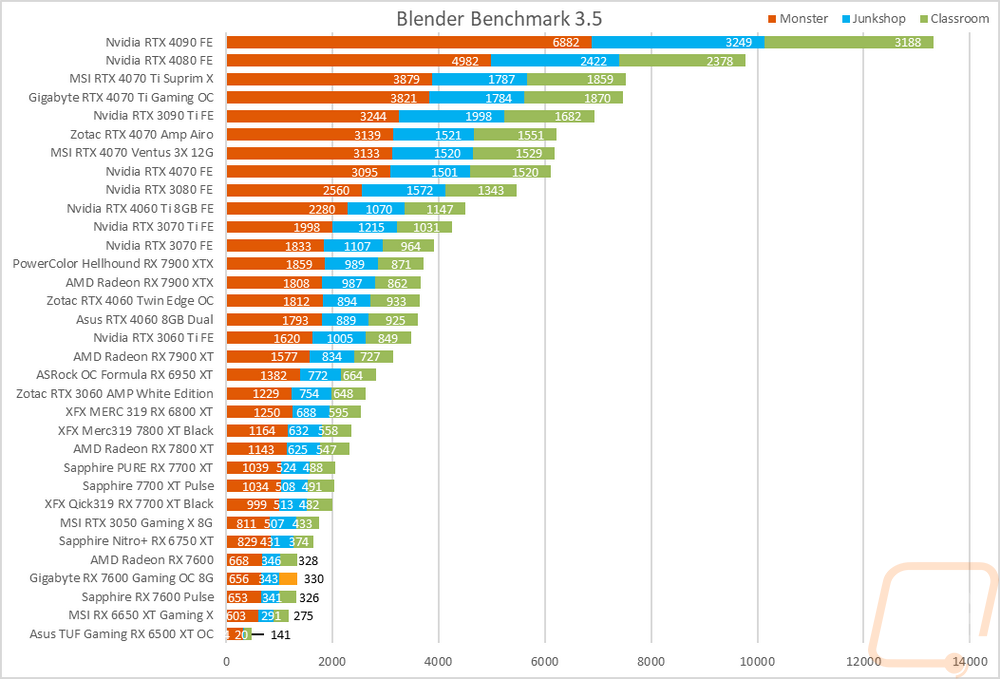
Blender |
Using the standard Blender Benchmark I run the test using the Blender 3.4 setting which tests using the Monster, Junkshop, and Classroom tests. |
|
OctaneBench 2020.1 |
OctaneBench is designed to test rendering in OctaneRender. RTX and non-RTX are both ran. This is a CUDA-only test so only Nvidia cards are tested |
|
Power Testing |
Using a PCat v2 to monitor power between the PCIe slot and the card as well as power through the power cables I test the peak power when running ADIA64, 3DMark Speed Way, 3DMark Time Spy Extreme, FarCry 6 at 4k and Ultra Detail, Watch Dogs Legion at 4K and Ultra detail, and Blender 3.4.0. The results are then averaged as well as the highest result. |
|
Noise Testing |
Our Noise testing is done using a decibel meter 18 inches away from the video card on the bottom/fan side of the card. We test at 50% and 100% fan speeds as well as a third test while under load using AIDA64's stress test. This is done using a Protmex PT02 Sound Meter that is rated IEC651 type 2 and ANSI S1.4 type 2. Tests are done set weighted to A and set to a slow response using the max function. The ambient noise level in the testing area is 33.3 decibels. |
|
Temperature Testing |
Using AIDA64, the GPU stress test is run for 30 minutes or until the result has leveled off. The test is run twice, once with the stock fan profile and a second time with 100% fan speed. During this, I also document the 100% fan speed RPM and document the delta between the fan profile and 100% fan speed as well as get thermal images. |
Synthetic Benchmarks
As always I like to start my testing with a few synthetic benchmarks. 3DMark especially is one of my favorites because it is very optimized in both Nvidia and AMD drivers. It's nice to not have to worry about it being favored too much either way and the repeatability of the results makes it a nice chance to compare from card to card, especially when comparing with the same GPU. For the Gigabyte RX 7600 Gaming OC 8G, I have previously taken a look at the AMD reference RX 7600 as well as the Sapphire Pulse RX 7600. The Pulse had a boost clock speed of 2751 MHz and the reference card had a boost clock of 2655 MHz. The RX 7600 Gaming OC 8G is a little higher than both reaching up to 2755 MHz. For the base clock speed, the Pulse ran at 2356 Mhz which is over the 2250 MHz of the reference card. The RX 7600 Gaming OC 8G is right in line with that, 1 MHz lower than the Pulse at 2355 MHz. It will be interesting to see how that affects performance.
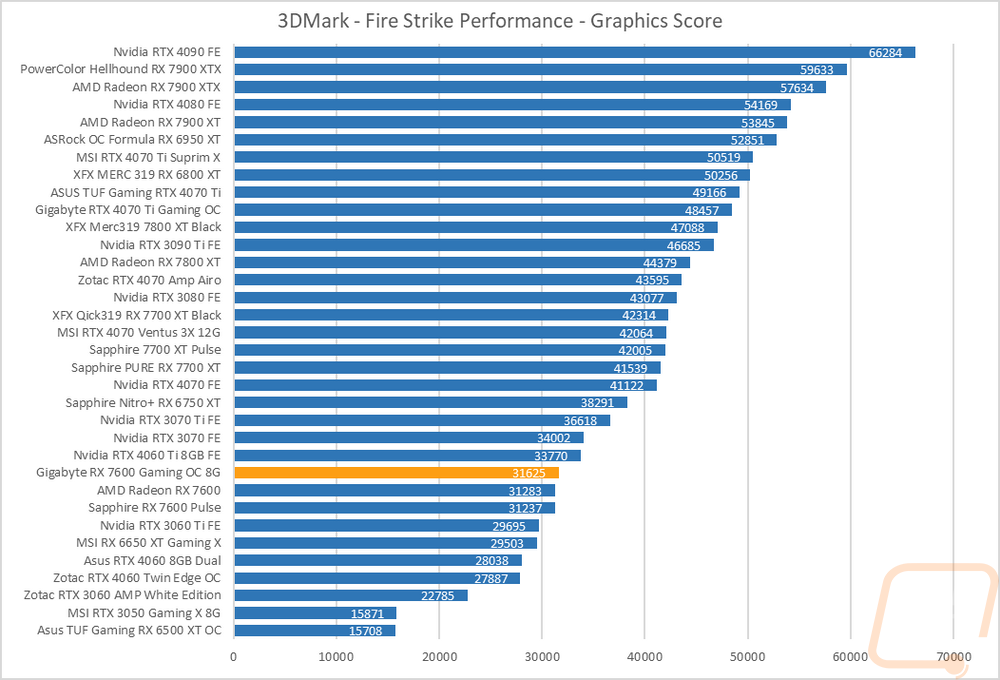
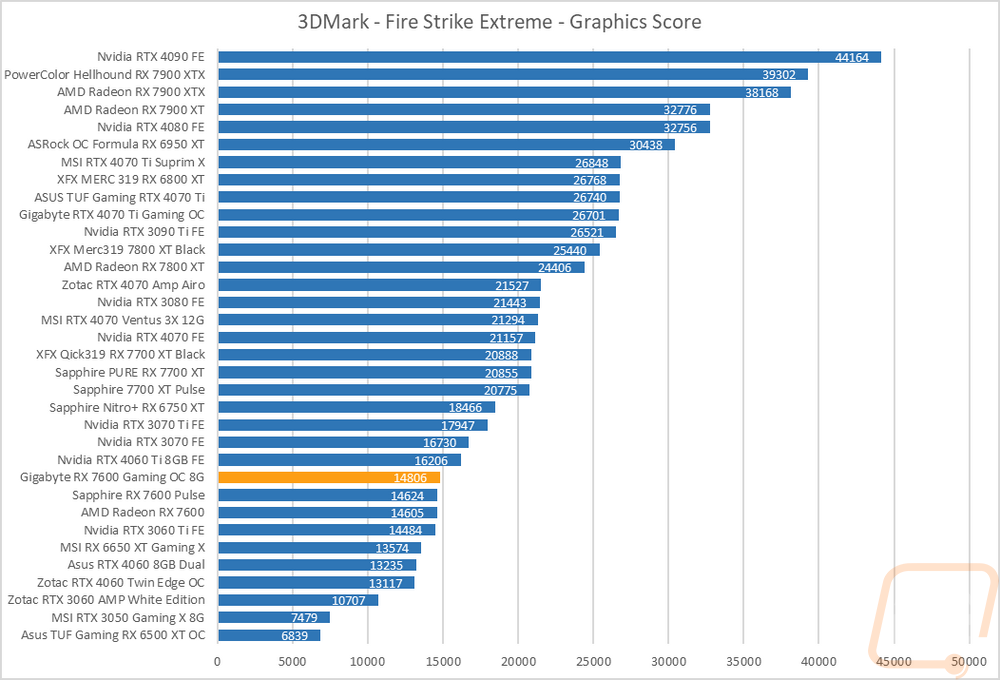
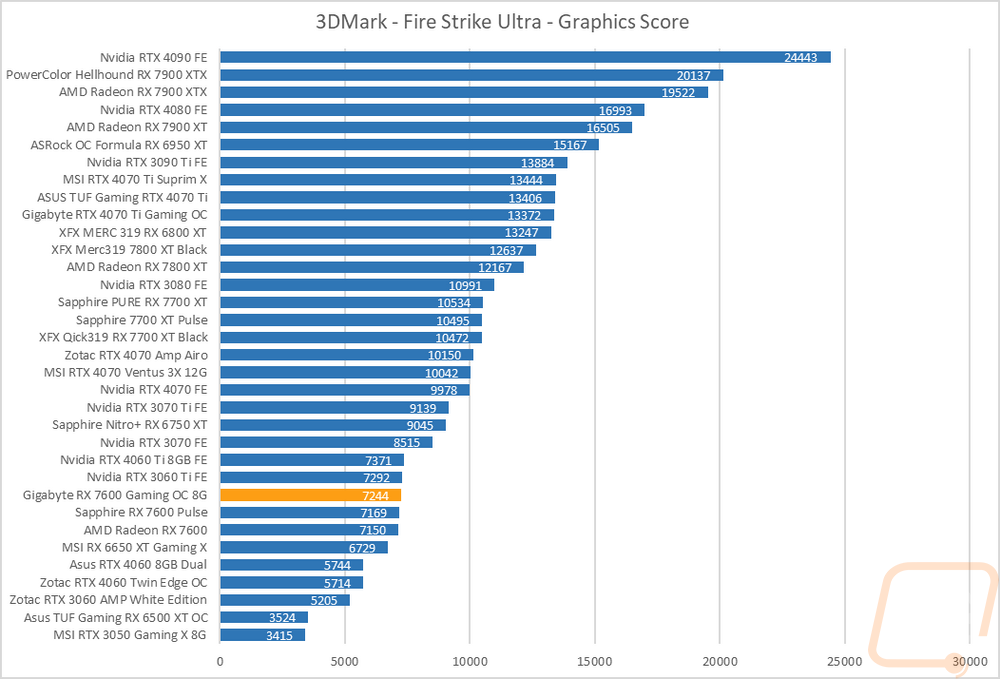
The first round of tests were done in the older Fire Strike benchmark which is a DX11 test. There are three detail levels, performance, extreme, and ultra. The RX 7600 Gaming OC 8G was out ahead of the stock 7600 and Pulse by 1% on the base Fire Strike test, 1.3% in Fire Strike Extreme, and 1.3% on Fire Strike Ulta.
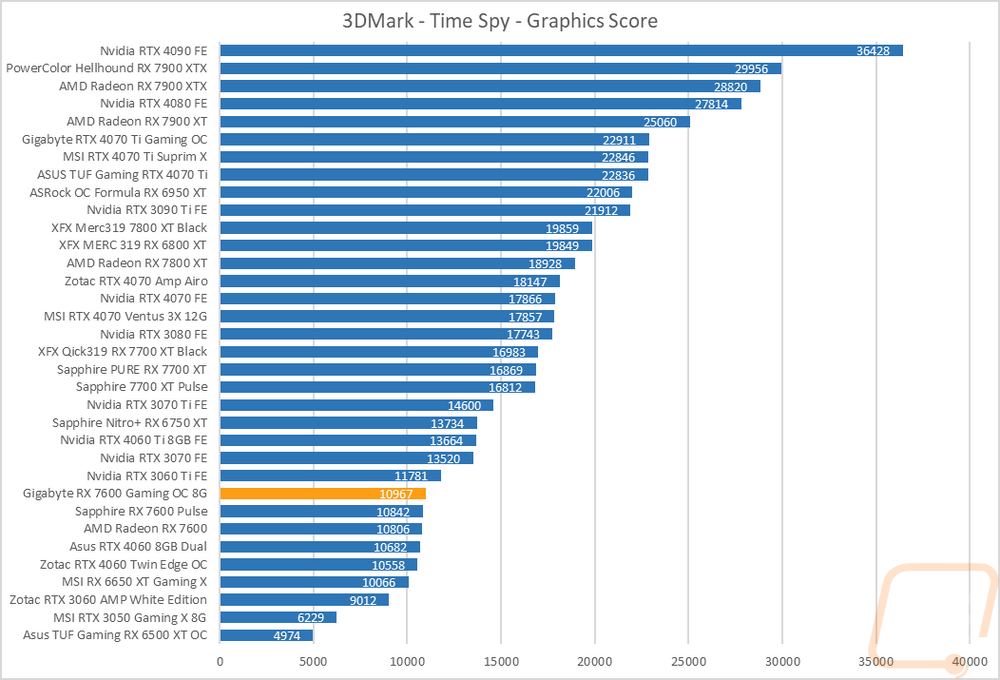
The next two were both based on the Time Spy benchmark. One is the standard test and then there is the extreme detail level. This is a DX12 test which is more relevant to today's games. The RX 7600 Gaming OC 8G scored a 10967 on the base Time Spy which put it 1.5% ahead of the stock RX 7600 and nearly the same for the Sapphire Pulse. It reached 2% in the Time Spy Extreme test as well, again in front of the Pulse as well. This wasn’t enough to change where it landed compared to everything else though with the RTX 3060 Ti in front of it and the RTX 4060 just barely behind it.

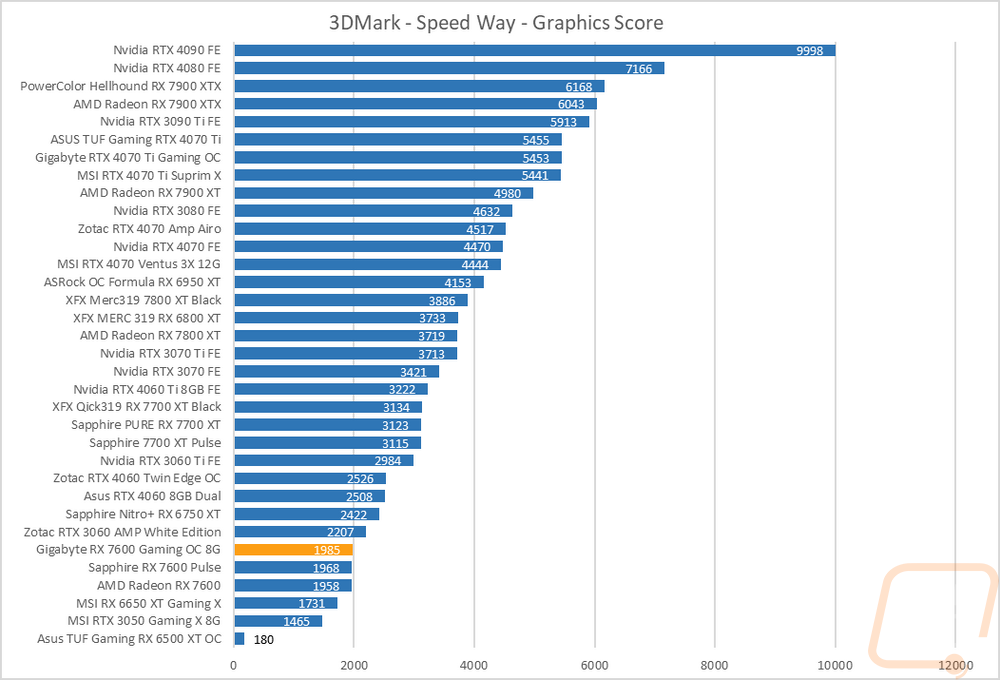
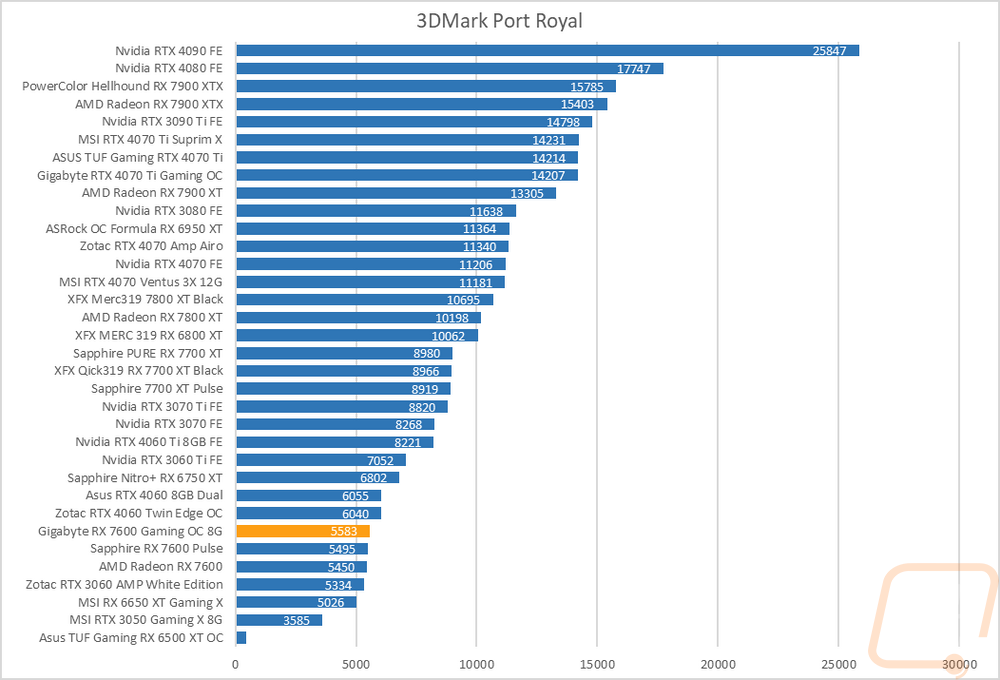
For ray tracing performance, I ran both the 3DMark Port Royal test which is ray tracing focused as well as the new 3DMark Speed Way test which tests all future-looking features including ray tracing. In Speed Way, the RX 7600 Gaming OC 8G scored a 1985 which does put it out ahead of both of the other RX 7600s but down below the RTX 3060 when compared to Nvidia’s cards, AMD as a whole is struggling here. The same goes for Port Royal where the RX 7600 Gaming OC 8G is behind the RTX 4060 but 2.4% ahead of the stock clocked RX 7600.
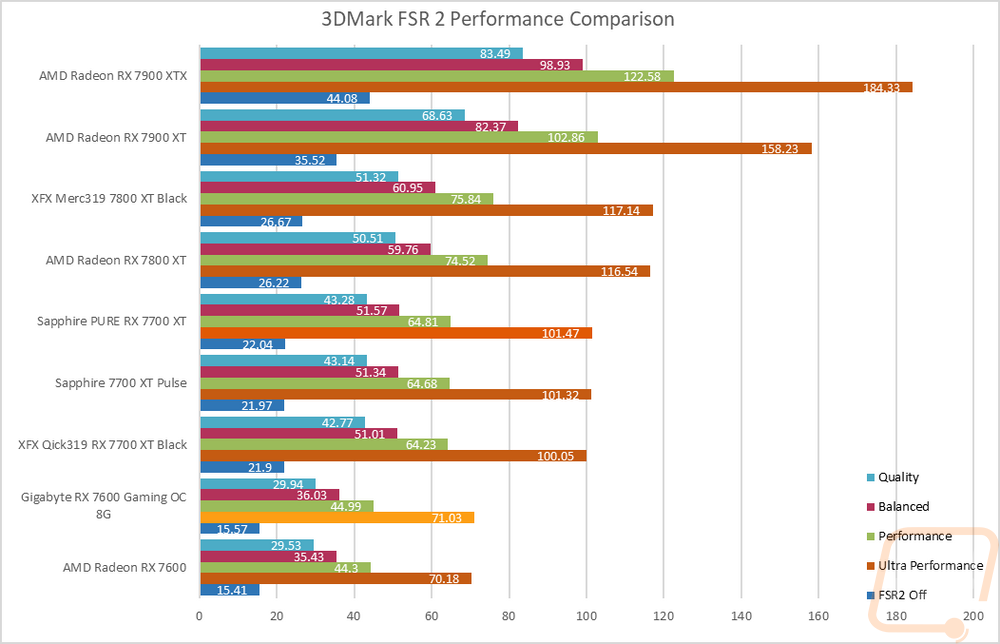
I added in one more test while in 3Dmark, this time testing the FSR 2 performance across all of the detail settings. The RX 7600 Gaming OC 8G isn’t really that far ahead of the stock 7600, but this does give a great example of how FSP 2 can improve performance at times. The RX 7600 Gaming OC 8G went from 15FPS and doubled it for the highest detail. That went up to 36 and then 44 FPS on the balanced and performance settings then an impressive 71 FPS with ultra performance.
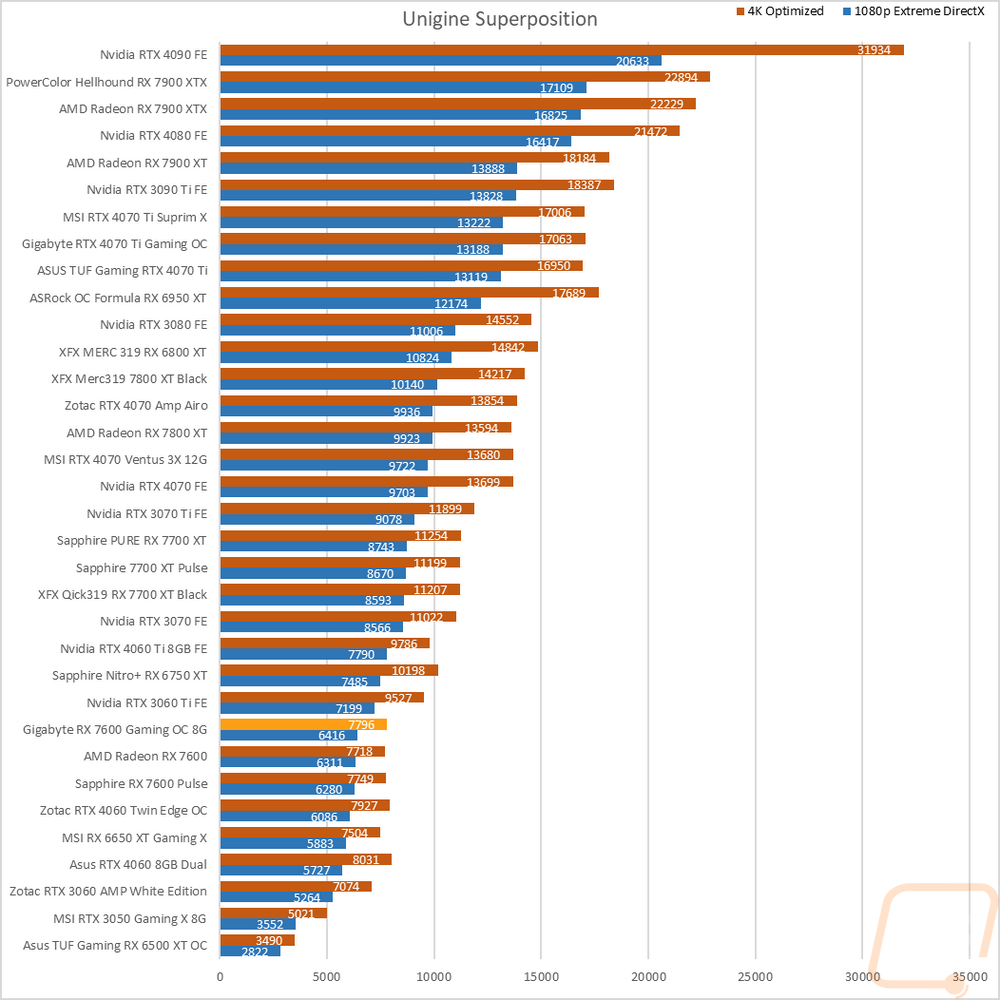
The last test was using the Unigine-based Superposition benchmark and I tested at 1080p with the extreme detail setting as well as the 4K optimized setting. In the extreme detail setting all three of the RX 7600 are still clumped together but the RX 7600 Gaming OC 8G was out in front in both the 4K and 1080P Extreme tests. The RTX 4060 was behind them in the 1080p results but ahead in the 4K test just slightly.
VR Benchmarks
As for Virtual Reality, I love it but it is more demanding than traditional gaming. This is partially because of the resolutions needed to render for two eyes and because they render more than what is immediately visible. But also because of post effects to get the proper “fisheye” effect for it to look proper in your eyes with the HMD. You also have to have much higher expectations for frame rates in VR, skipping frames or lower FPS can cause motion sickness in VR. Because of that, I ran a few tests.
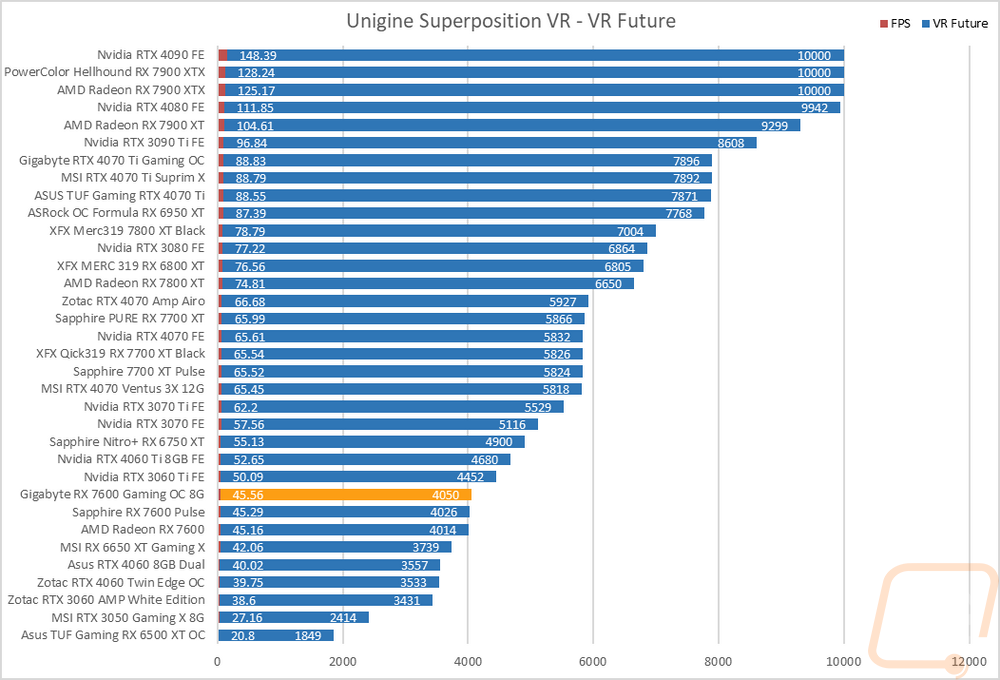
My first test was again in Superposition. This time I tested the VR Future test using the Oculus resolution. I have also included the average frame rate as well which is important for the cards at the top of the chart because for some reason Superposition is capped at 10,000 for its scores and that doesn’t show the performance gap in those cards at the top. The RX 7600 Gaming OC 8G scored a 4050 in this test, less than a 1% improvement over the reference card and that is even closer with the Pulse. All three are ahead of the 4060 by a big margin here but still behind the 3060 Ti.
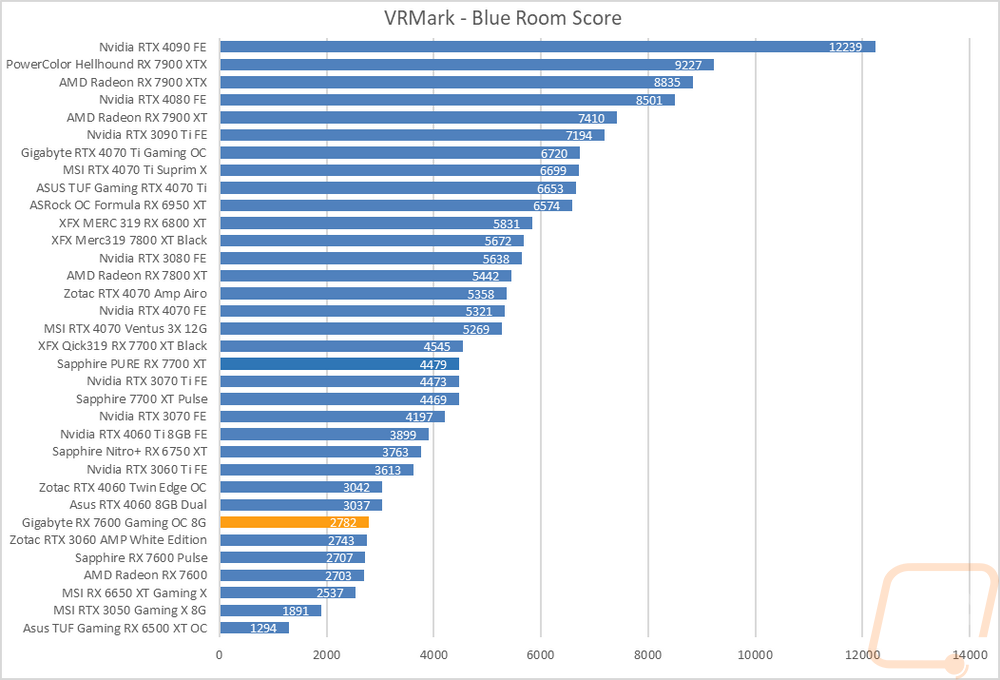
My second round of VR testing was in VRMark which has three tests that are similar to the VR tests in Superposition. I only focused on just the most demanding test called Blue Room which is looking more at future VR performance. The RX 7600 Gaming OC 8G scored a 2782 and was 2.7% above the reference RX 7600 but all three cards are behind the RTX 4060 here.
In-Game Benchmarks
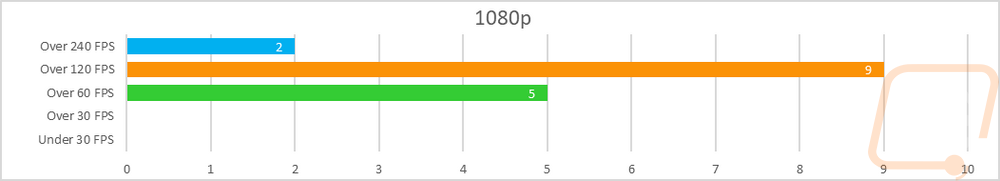
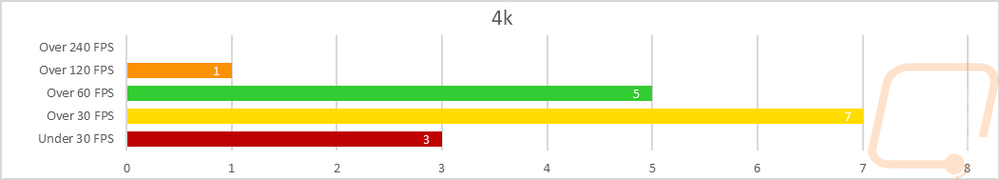
Now we finally get into the in game performance and that is the main reason people pick up a new video card. To test things out I ran through our new benchmark suite that tests 10 games at three different resolutions (1080p, 1440p, and 4k). Most of the games tested have been run at the highest detail setting and a mid-range detail setting to get a look at how turning things up hurts performance and to give an idea of if turning detail down from max will be beneficial for frame rates. In total, each video card is tested 48 times and that makes for a huge mess of results when you put them all together. To help with that I like to start with these overall playability graphs that take all of the results and give an easier-to-read result. I have one for each of the three resolutions and each is broken up into four FPS ranges. Under 30 FPS is considered unplayable, over 30 is playable but not ideal, over 60 is the sweet spot, and then over 120 FPS is for high refresh rate monitors.
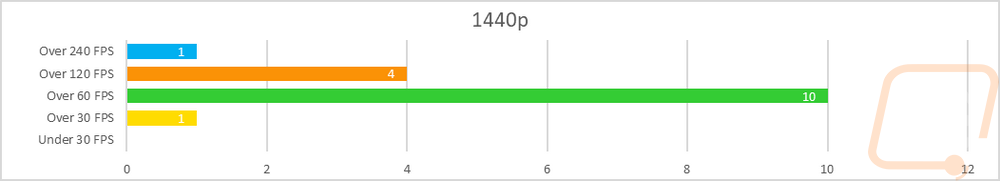
So how did the Gigabyte RX 7600 Gaming OC 8G do? Well at 1080p which is its targeted framerate none of the results were under 60 FPS. Two results reached over 240 FPS and a majority (nine) were over 120 FPS as well meaning in every situation the RX 7600 Gaming OC 8G will perform well at 1080p and in most situations it would get you framerates capable of matching up with a high-refresh display. At 1440p it still did better than you would expect. One result was in the 30-59 FPS range but other than that everything was over 60 FPS. Ten of the results were between 60-119 FPS and then 5 were at 120 or above with one also over 240 FPS. Of course at 4k things really fall apart. Three of the tests were unplayable and a majority were not smooth at all with 7 in the 30-59 FPS range. But a few were okay with six over 60 FPS and one of those over 120 FPS.
Of course, I have all of the actual in game results as well for anyone who wants to sort through the wall of graphs below. I also put together the averaged results for the RX 7600 Gaming OC 8G and a whole list of other cards around it including the two other RX 7600s that we have tested. These are averaged by resolution across all of the games tested other than CS:GO which its frame rates are so high it would mess up the numbers. The RX 7600 Gaming OC 8G averaged 143 FPS at 1080p, 2.2 FPS higher than stock and 1.3 FPS higher than the Pulse, which is similar to what I saw in the synthetic benchmarks. At 1440p the difference between the cards gets smaller and at 4k interestingly the RX 7600 Gaming OC 8G dropped behind slightly. All three of the RX 7600 come in behind the 3060 Ti but only slightly at 1080p for the RX 7600 Gaming OC 8G and ahead of the RTX 4060 by almost 8 FPS.
|
Average FPS (w/o CS:GO) |
1080p |
1440p |
4K |
|
RTX 3060 Ti |
144.8 |
105.4 |
59.2 |
|
Gigabyte RX 7600 Gaming OC 8G |
143.0 |
96.8 |
48.2 |
|
Sapphire RX 7600 Pulse |
141.7 |
96.6 |
50.6 |
|
Radeon RX 7600 |
140.8 |
96.7 |
50.4 |
|
MSI RX 6650 XT Gaming X |
138 |
93.9 |
42.9 |
|
Zotac RTX 4060 Twin Edge OC White Edition |
135.7 |
94.5 |
50.1 |
|
Asus RTX 4060 8GB Dual |
135.6 |
94.6 |
50.0 |
|
Zotac RTX 3060 AMP |
117.2 |
83.2 |
46.2 |
Compute Benchmarks
Now some people don’t need a video card for gaming, they need the processing power for rendering or 2D/3D production, or in some cases people who game also do work on the side. So it is also important to check out the compute performance on all of the video cards that come in. That includes doing a few different tests. My first test was a simple GPU Compute benchmark using PassMark's Performance Test 10 and the RX 7600 Gaming OC 8G did outperform both of the other RX 7600 by a good margin. It was enough to put it right up behind the RTX 4060 but not enough to pass either 4060 tested.
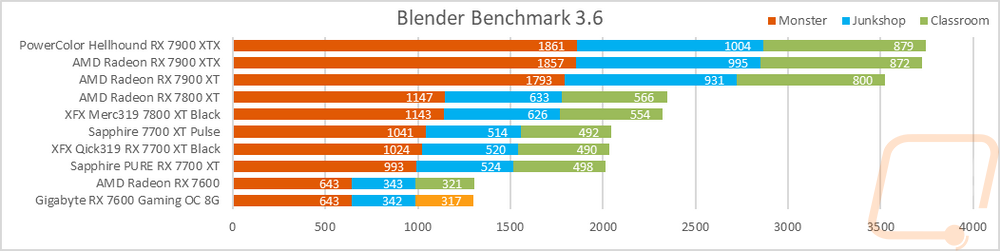
Blender is always my favorite compute benchmark because the open-source 3D rendering software is very popular and it isn’t a synthetic benchmark. With the latest version of Blender, they redid the benchmark so we now have a new test that runs three different renderings and gives each a score. I have all three stacked together so we can see the overall performance. The RX 7600 Gaming OC 8G, like with all of the AMD cards struggled here. The overclocked 7600 was right with the reference RX 7600 but for comparison with Nvidia’s card, all of the RX 7600 were well below even the older RTX 3050.
Cooling Noise and Power
For my last few tests, rather than focusing on in game performance, I like to check out other aspects of video card performance. These are also the most important ways to differentiate the performance between cards that have the same GPU. To start things off I took a look at power usage.
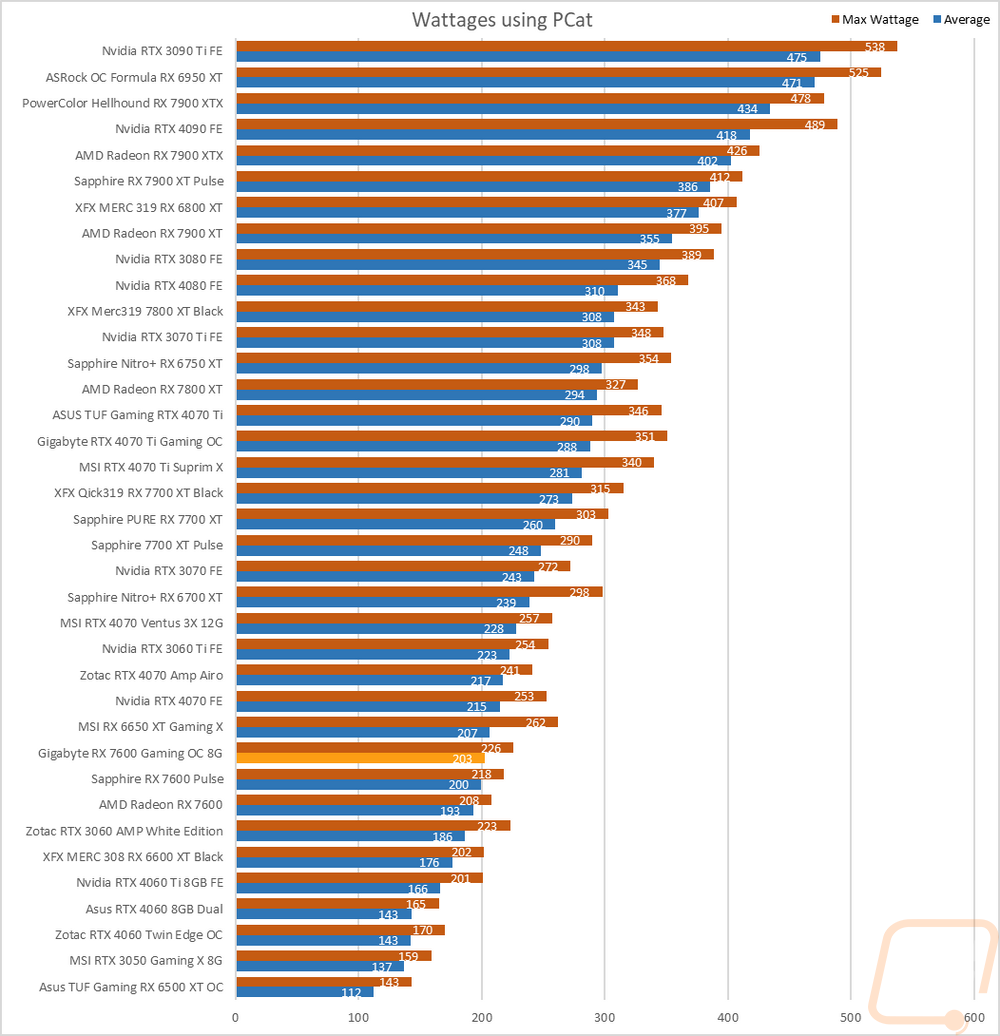
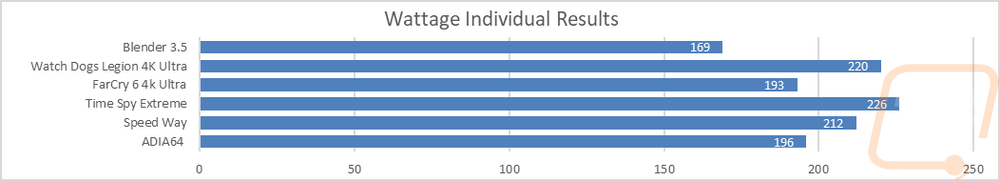
For this, our new test setup utilizes the Nvidia-designed PCat v2 along with cables to handle both traditional 6 or 8-pin connections as well as the new 12VHPWR. The PCat also utilizes a PCIe adapter to measure any power going to the card through the PCIe slot so we can measure the video card wattage exclusively, not the entire system as we have done in the past. I test with a mix of applications to get both in game, synthetic benchmarks, and other workloads like Blender and AIDA64. Then everything is averaged together for our result. I also have the individual results for this specific card and I document the peak wattage result as well which is almost always Time Spy Extreme. The RX 7600 Gaming OC 8G averaged 203 watts which was 3 watts over the Sapphire Pulse and 10 watts over the stock clocked reference card. The peak wattage was also higher at 226 watts, 8 watts over the Pulse, and 18 watts more than the reference card. For comparison, the RTX 4060 averaged just 143 watts and 165 watts at peak.
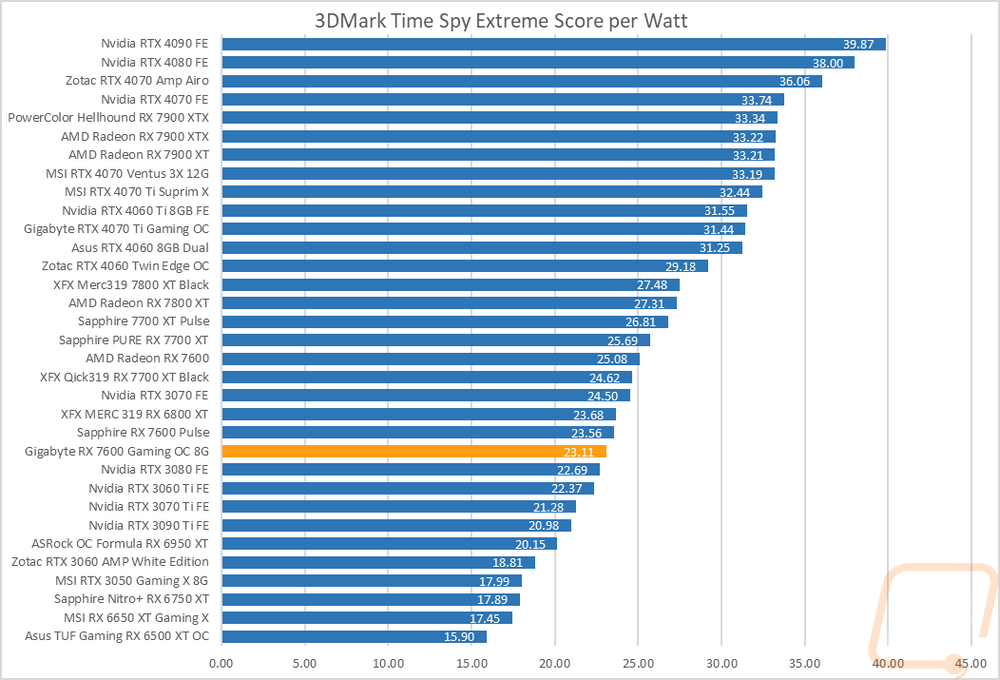
With having exact peak wattage numbers when running Time Spy Extreme I was also able to put together a graph showing the total score for each watt that a card draws which gives us an interesting look at overall power efficiency in the popular and demanding benchmark. The small performance improvements we saw from the overclock in the synthetic tests and across the board when combined with the higher wattage dropped the efficiency rating down for the RX 7600 Gaming OC 8G. It was at 23.11 with the Pulse higher at 23.56 and the reference card even higher at 25.08. This put it down in the mix with some of last generation's cards which are a lot less efficient than this generation.
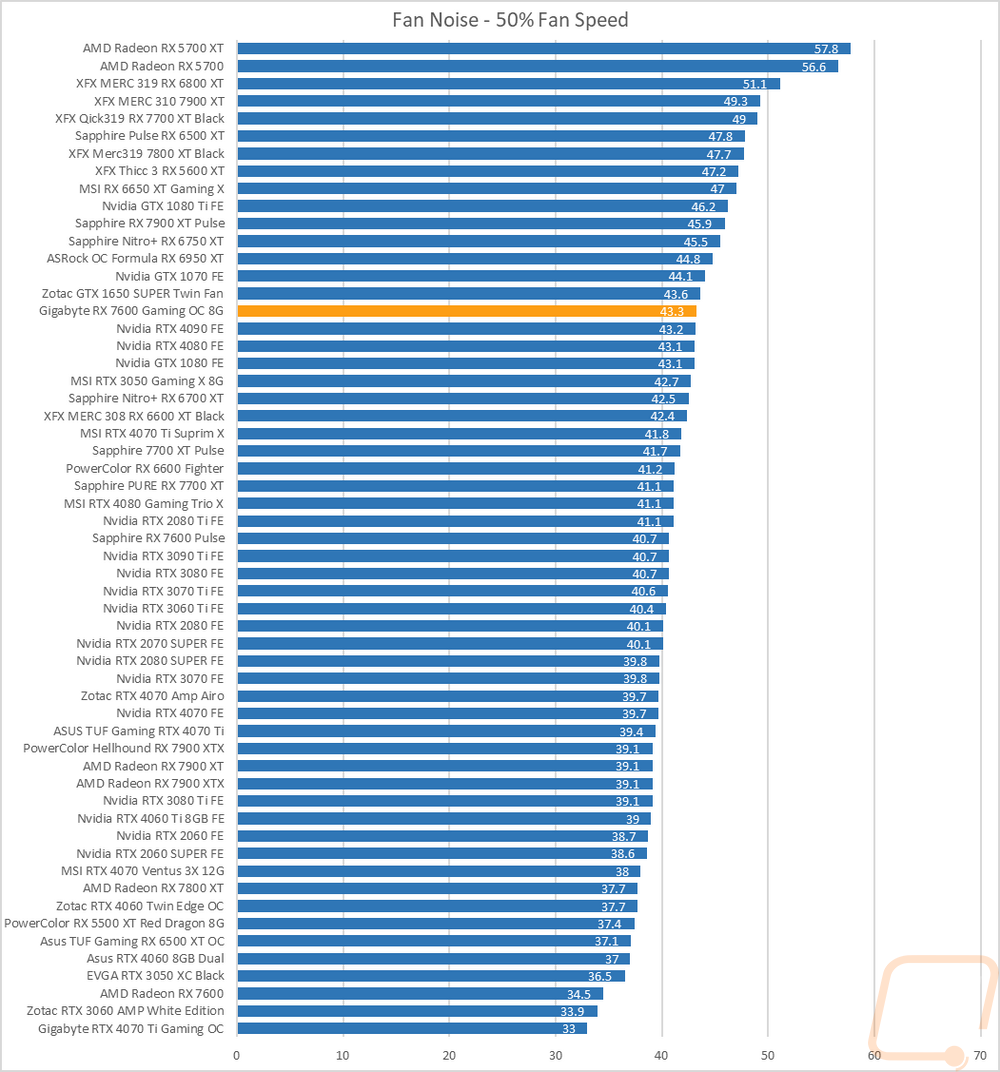
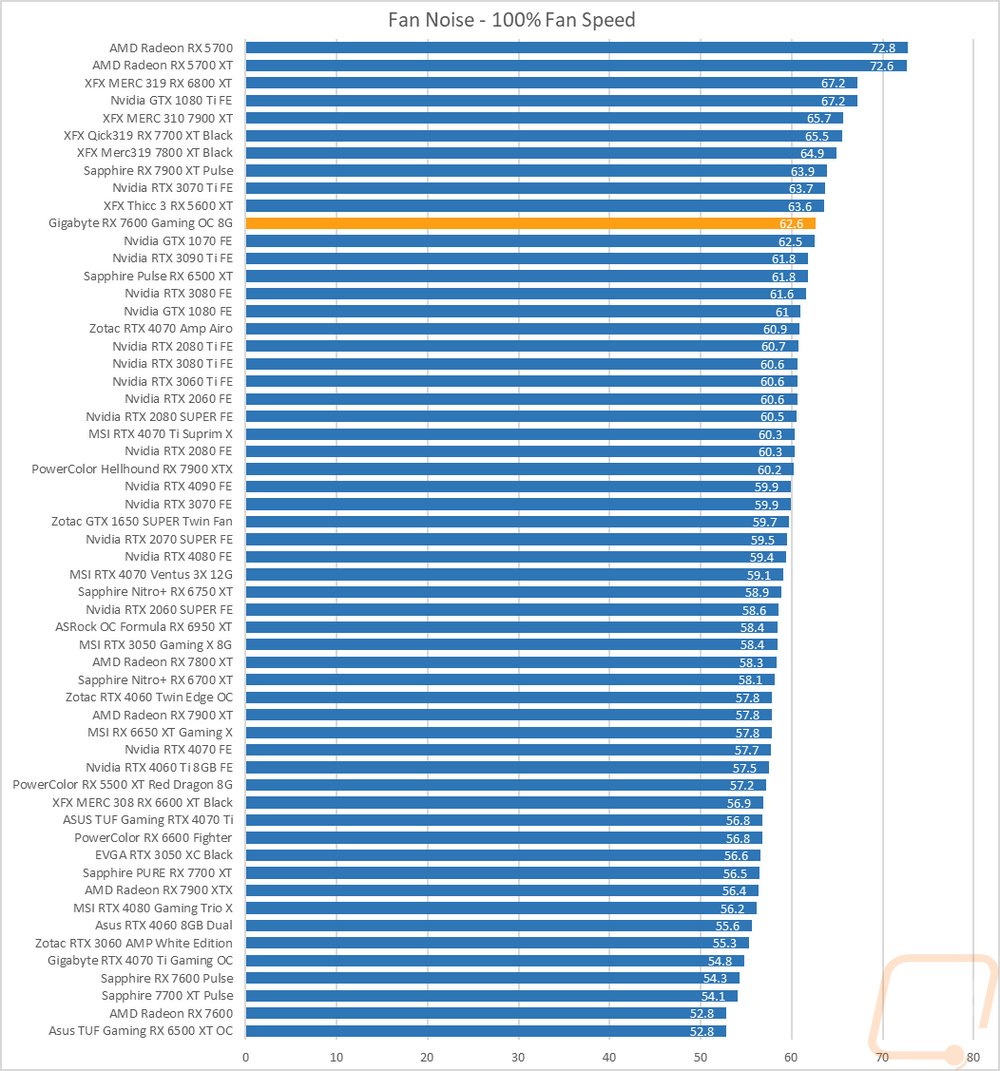
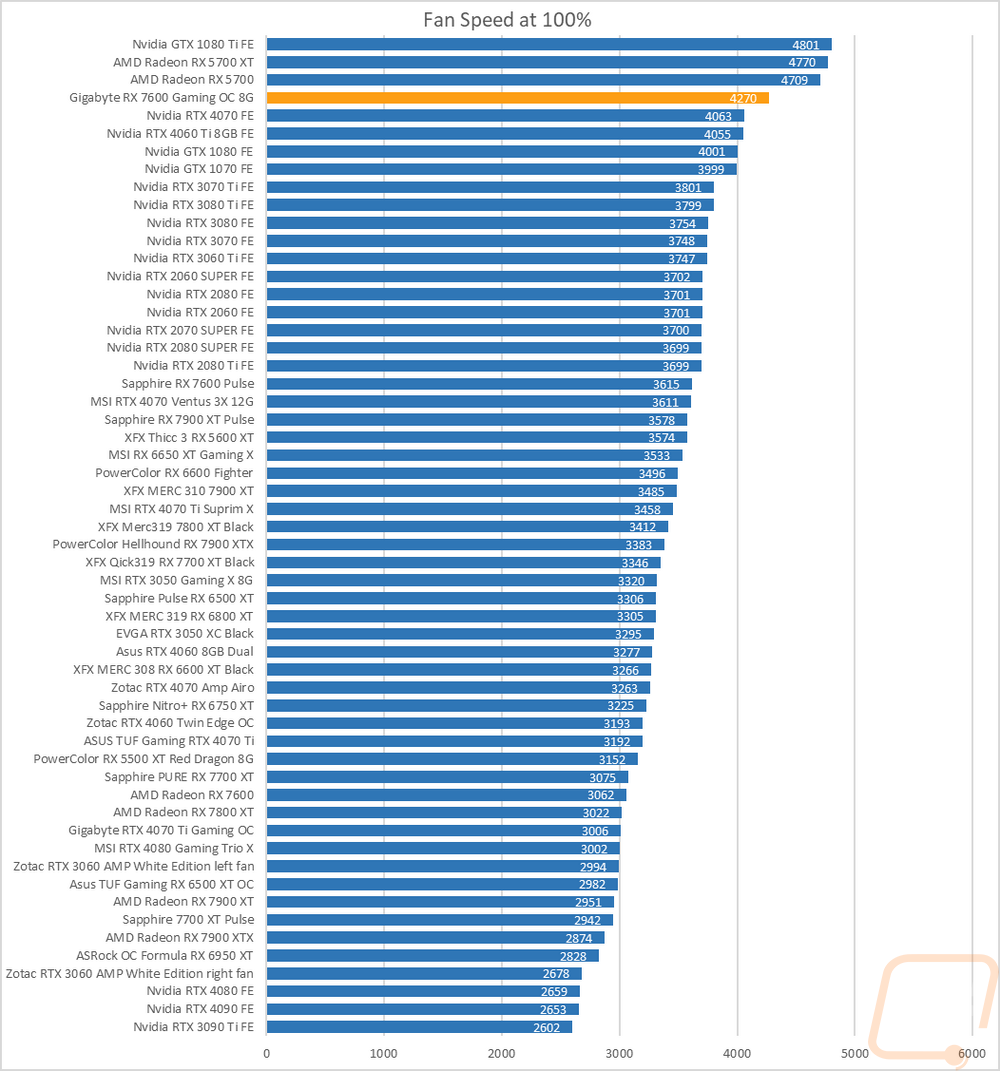
My next round of tests were looking at noise levels. These are especially important to me because I can’t stand to listen to my PC whirling. Especially when I’m not in game and other applications are using the GPU. For my testing, though I first tested with the fan cranked up to 100% to get an idea of how loud it can get, then again at 50% to get an idea of its range. The RX 7600 Gaming OC 8G came in at 43.3 decibels at 50% fan speed and 62.6 decibels at 100%, both put it up in the top 1/3 of the chart. This was in line with the fan speed though which was also right up in that same area, higher up in the graph in fact at 4270 RPM.
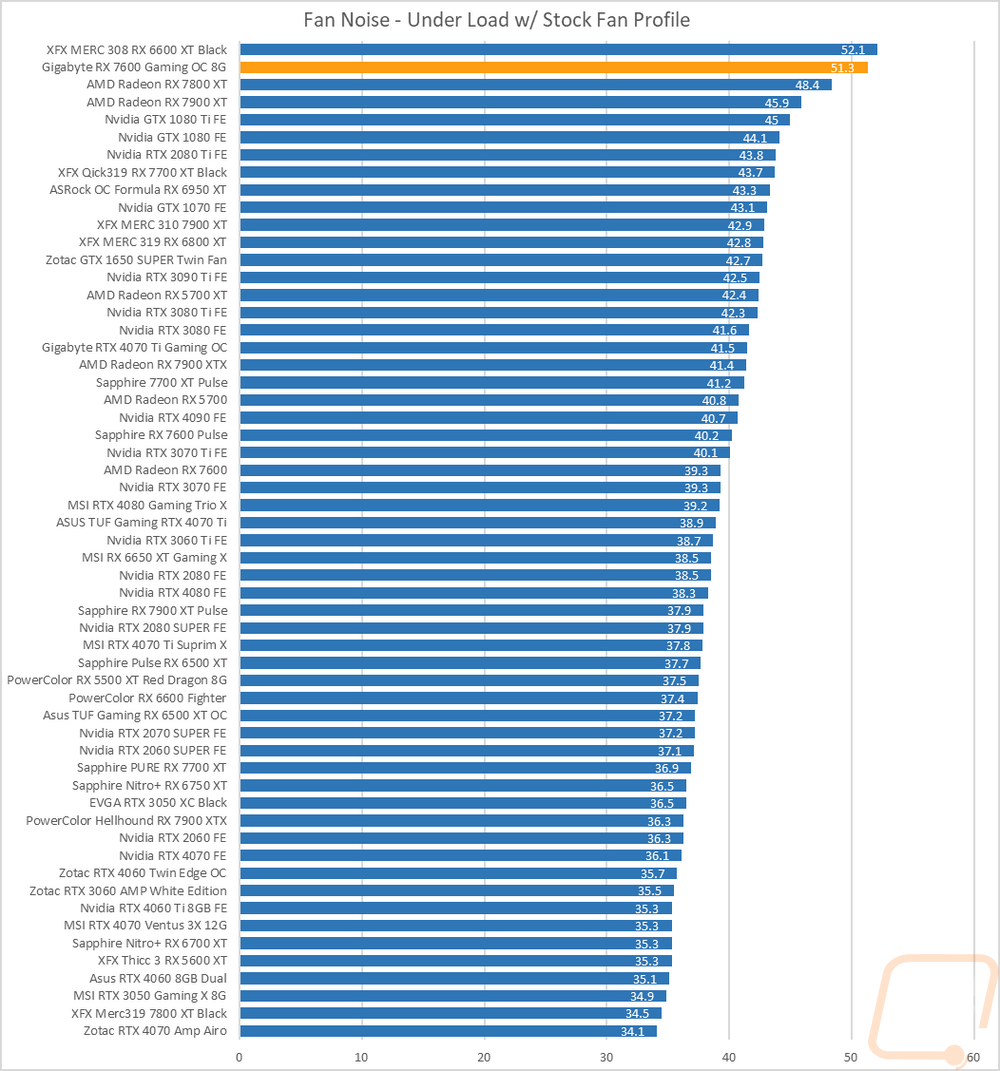
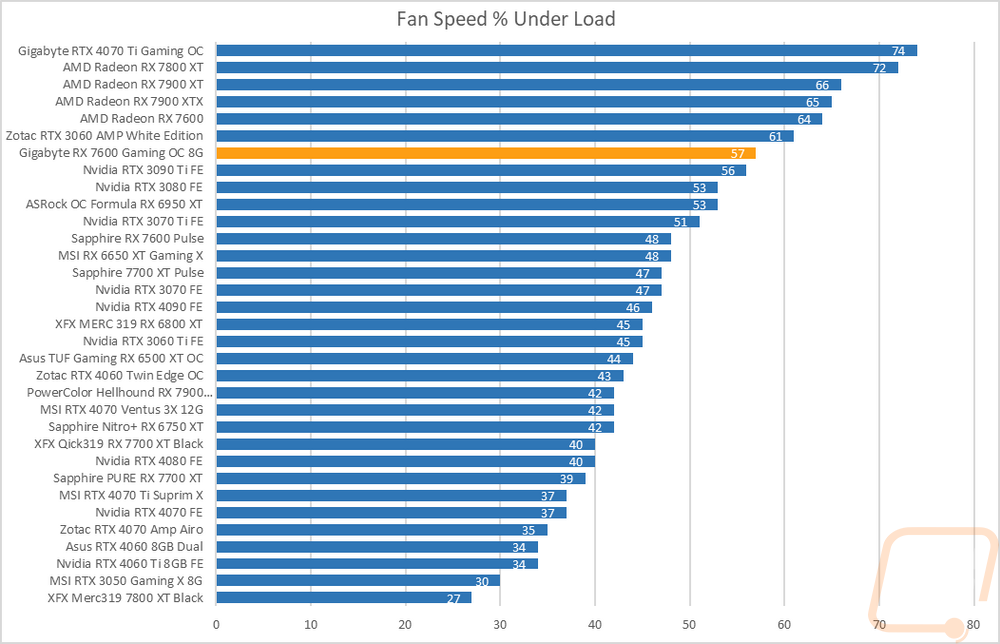
I also take a look at noise performance while under load. For that when running AIDA64’s stress test I wait until the temperature of the card has leveled off and then measure how loud things are when the card is at its worst-case scenario with the stock fan profile. Here the RX 7600 Gaming OC 8G was loud under load at 51.3 decibels making it the second loudest card tested. The fan profile and temps had it running at 57% fan speed when under load.
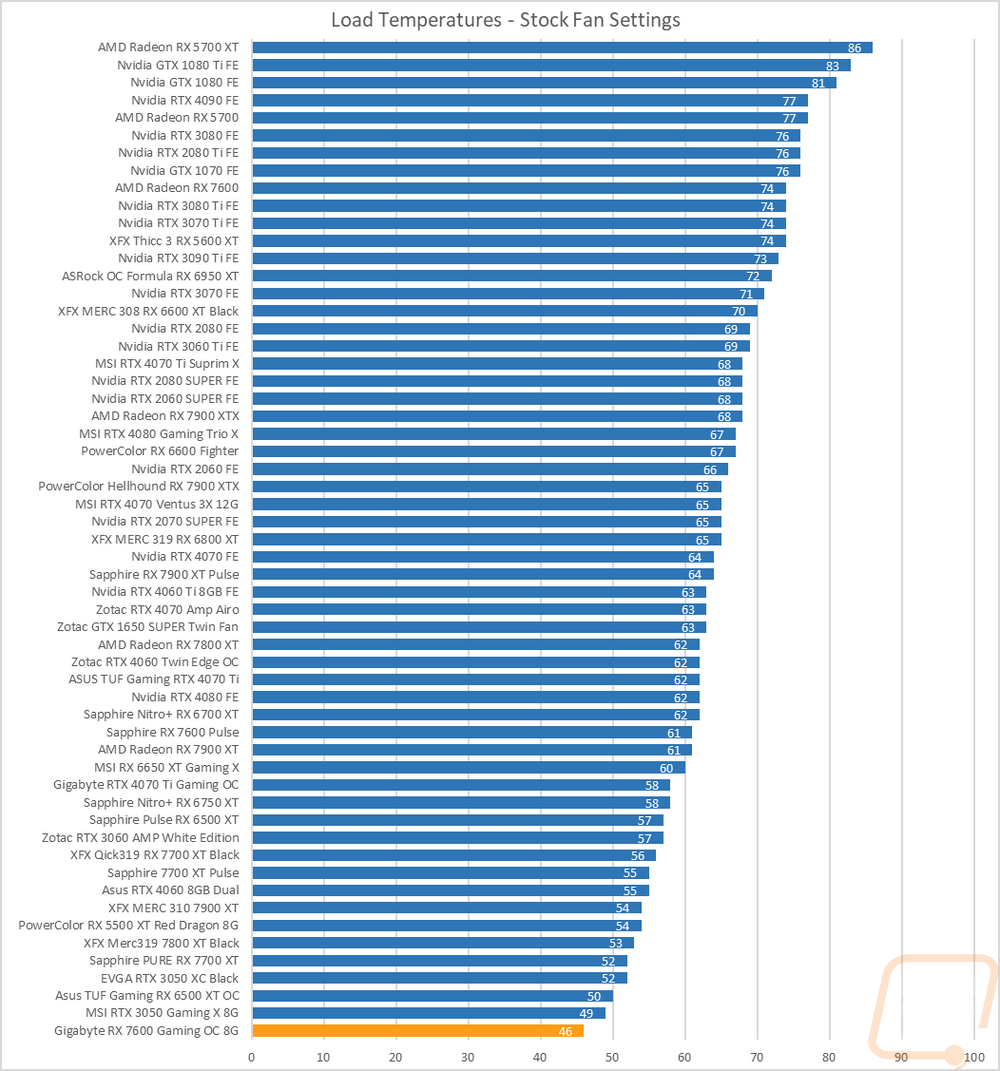
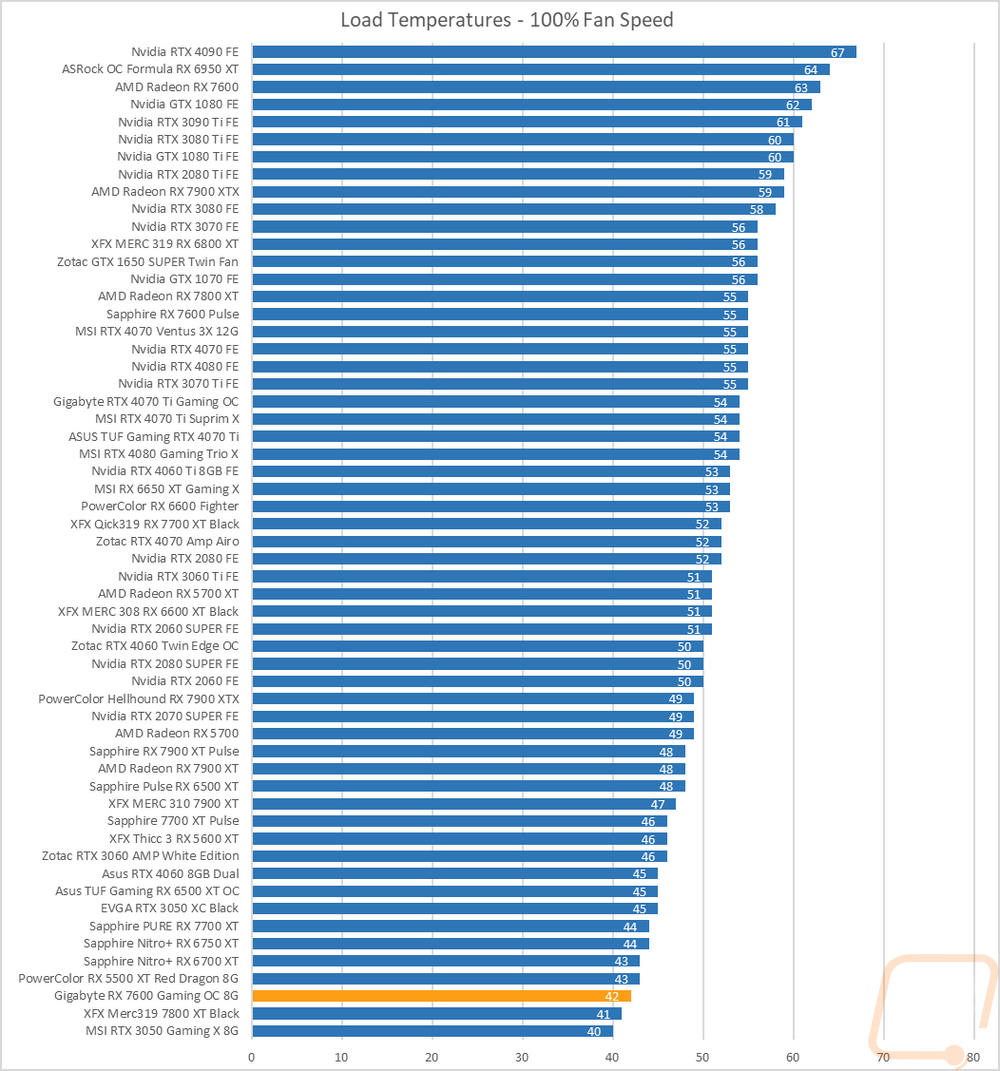
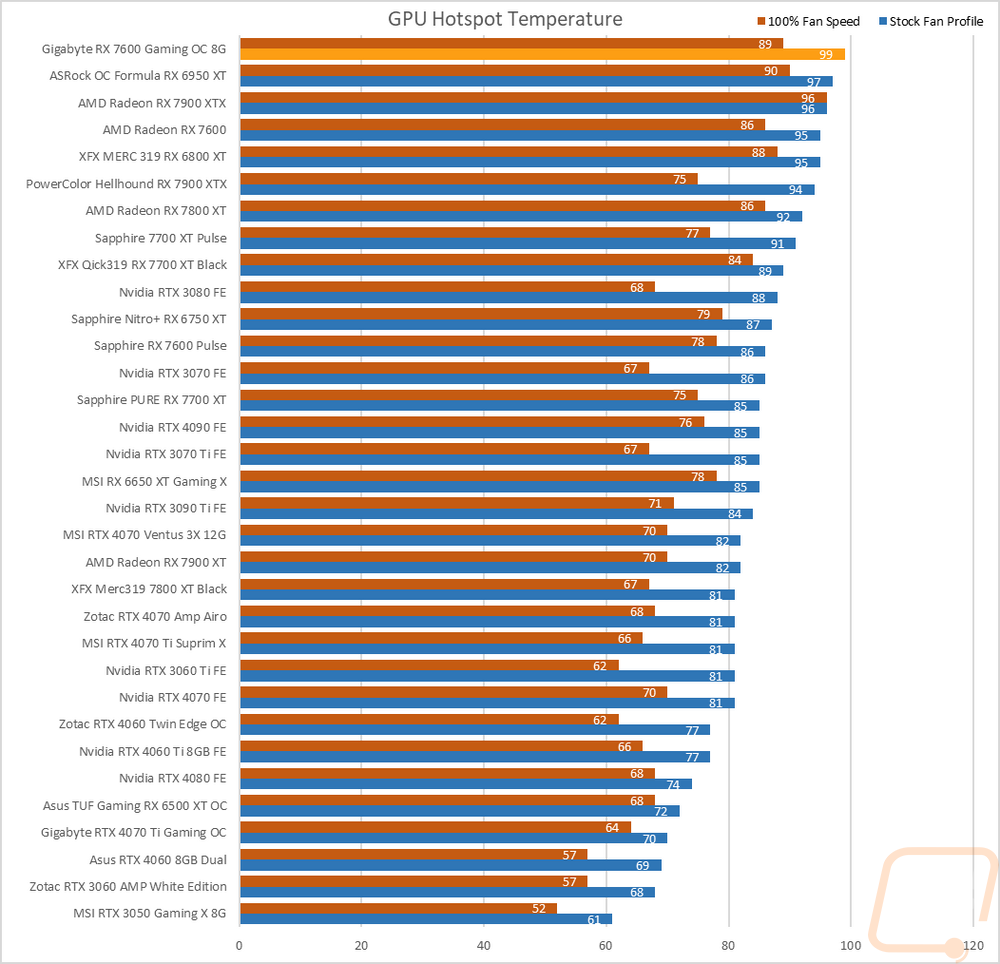
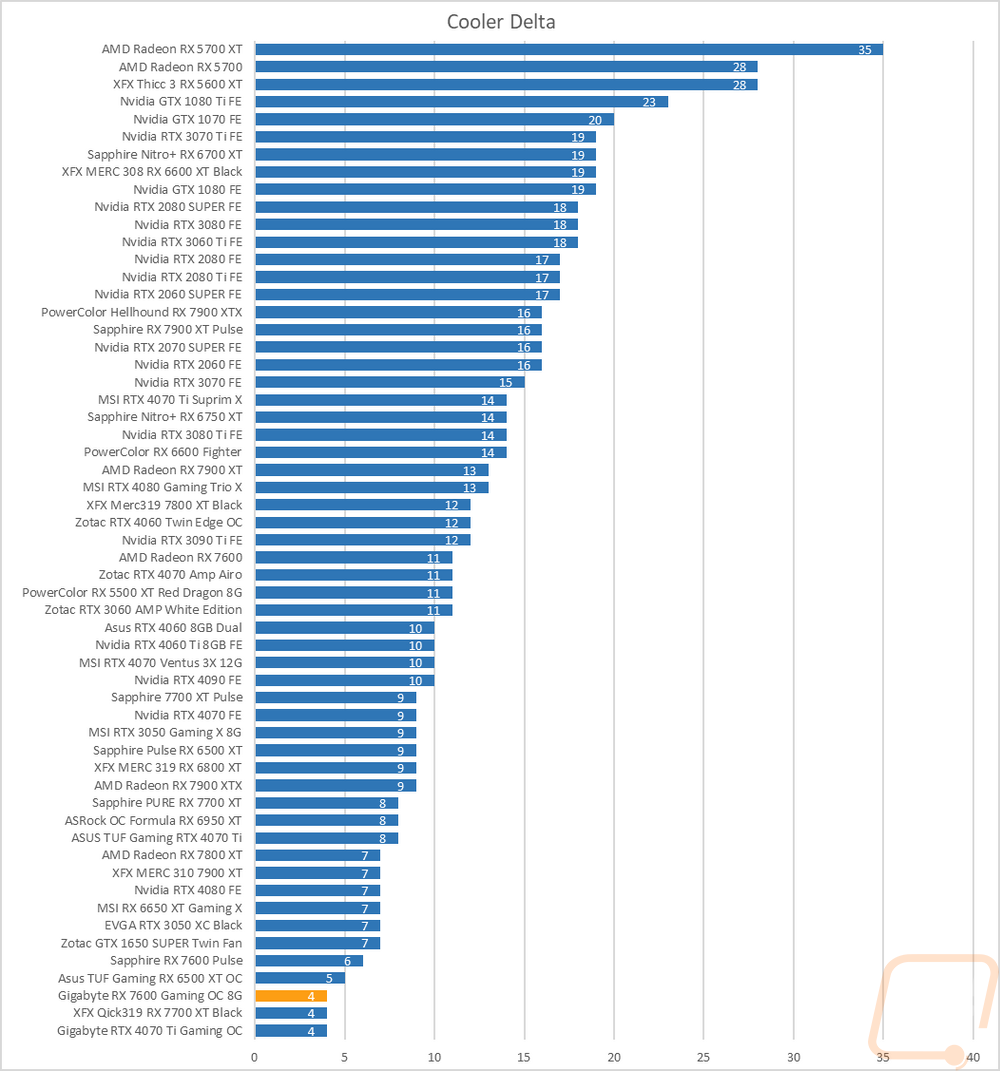
To finish up my testing I of course had to check out the cooling performance. To do this I ran two different tests. I used AIDA64’s Stress Test run for a half-hour each to warm things up. Then I documented what temperature the GPU leveled out at with the stock fan profile and then again with the fans cranked up to 100%. With the stock profile, the RX 7600 Gaming OC 8G was down at the bottom of our chart at 46c and 99c for its GPU hotspot. Cranking the triple fan cooler up to 100% kept it down near the bottom of the chart again at a cool 42c and the GPU hotspot dropped down to 89c which was still hot but an improvement. The delta between the stock profile and 100% fan speed results was just 4c which is very small. It’s really clear that the stock fan profile is extremely aggressive which could be tuned down and help the noise results we saw as well.
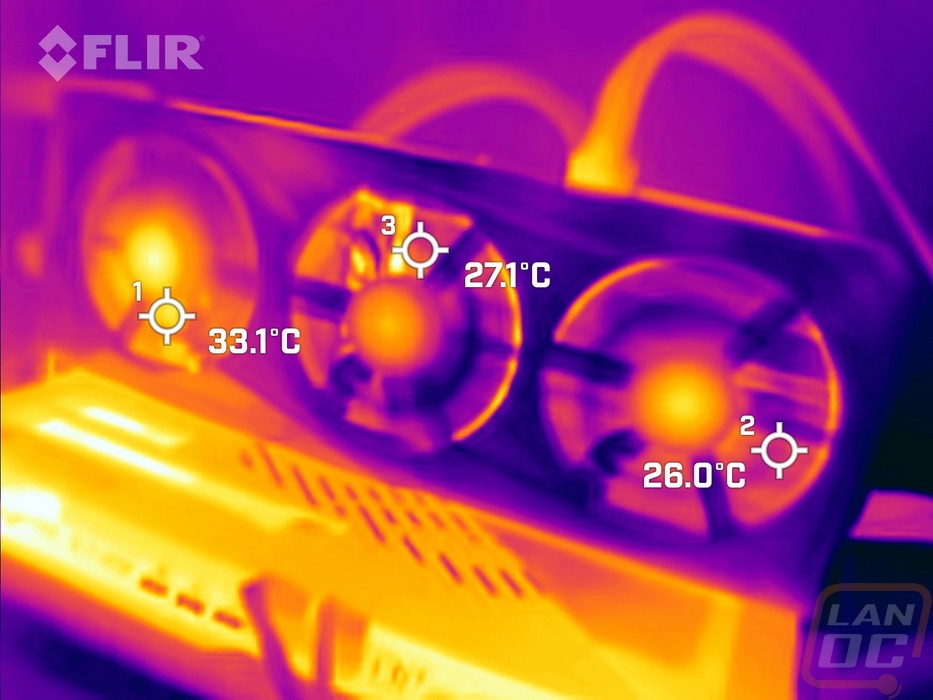
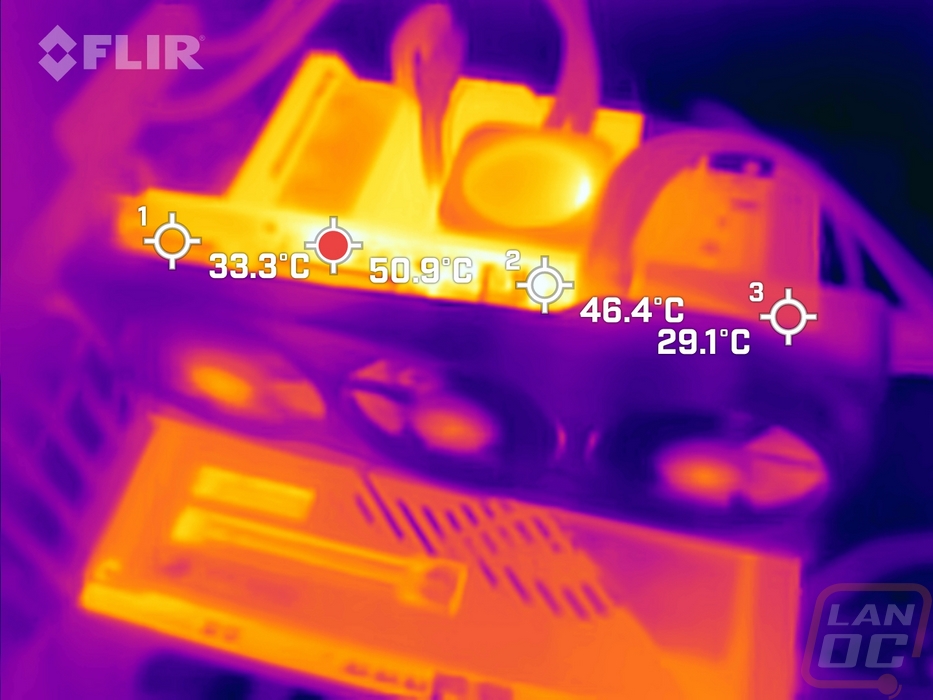
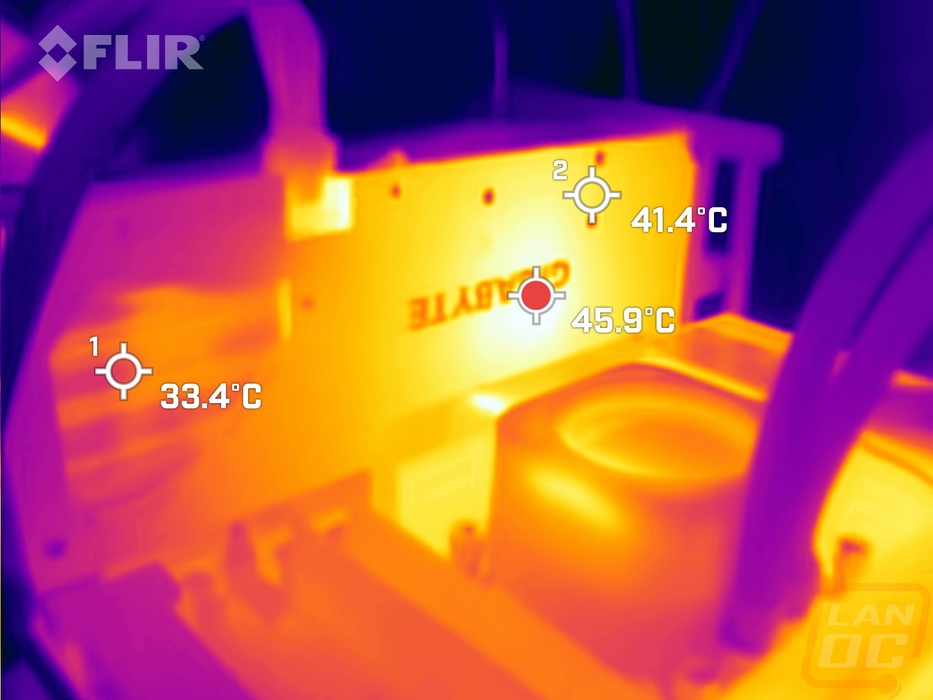
While running the stock fan profile testing I also took the time to get a few thermal images so we could see what is going on. The fan side of the RX 7600 Gaming OC 8G has the most heat all the way on the end toward the PCI bracket. The cooler design does have a much larger cooler on the other end so this end may have to deal with a little more heat but even at its hottest 33c isn’t too hot. The middle fan was cooler other than where we can see the heatpipes and the PCB then at the end the blow-through fan was the coolest of course. The top edge is a lot warmer with its hottest spot, some of the exposed PCB, at 50.9c but the exposed heatsinks aren’t as hot with 33.3c on one end and 29.1c on the other end. Then the metal backplate does show that it is spreading the heat out. The hottest spot is right behind the PCU but that spreads out across half of the card.
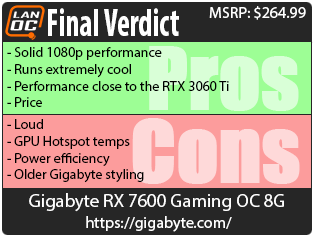
Overall and Final Verdict
The Gigabyte RX 7600 Gaming OC 8G is an interesting card, its cooler design has the styling from Gigabyte's previous generation of cards with its mix of grey and black and an older fan design. It does still have the backlit branding as its only lighting accents which I’m not a big fan of. That said the look isn’t out of style at all and it doesn’t affect performance at all. The RX 7600 Gaming OC 8G is overclocked and in nearly all of our tests performed between 1 and 2 percent better than the stock-clocked reference RX 7600 and was faster than the RX 7600 Pulse as well. That wasn’t enough to rearrange our charts though, all of the RX 7600 perform great at 1080p and at capable at 1440p in some situations as well. The RX 7600 Gaming OC 8G came in surprisingly close to the RTX 3060 Ti and outperformed the RTX 4060 that Nvidia just recently launched. It did still have the same lower performance in Blender that all of the RX 7600 have had, but that wasn’t a surprise at all.
The RX 7600 Gaming OC 8G with its triple fan cooler is a long card, longer than AMD's reference design and the Pulse that I previously took a look at. That larger cooler did have it running extremely cool in our testing but it is also loud partially because the fans are capable of higher RPM than most cards. Gigabyte’s stock fan profile is also really aggressive and could be toned down without affecting cooling performance much but it would make a big difference in the noise levels when under load. That said the GPU Hotspots were still high. The overclock did make a big difference in our power efficiency tests compared to the other RX 7600s.
For pricing the RX 7600 Gaming OC 8G has an MSRP of $264.99 which is $5 less than the Sapphire RX 7600 Pulse. All of the RX 7600 are a good deal when you start comparing them to where Nvidia is right now with the RTX 4060. Its biggest competition comes from the 6000 Series cards from AMD that have been discounted to clear out stock. If you are looking to game at 1080p you aren’t going to find a better value from the current generation.

Live Pricing: HERE


