In-Game Benchmarks
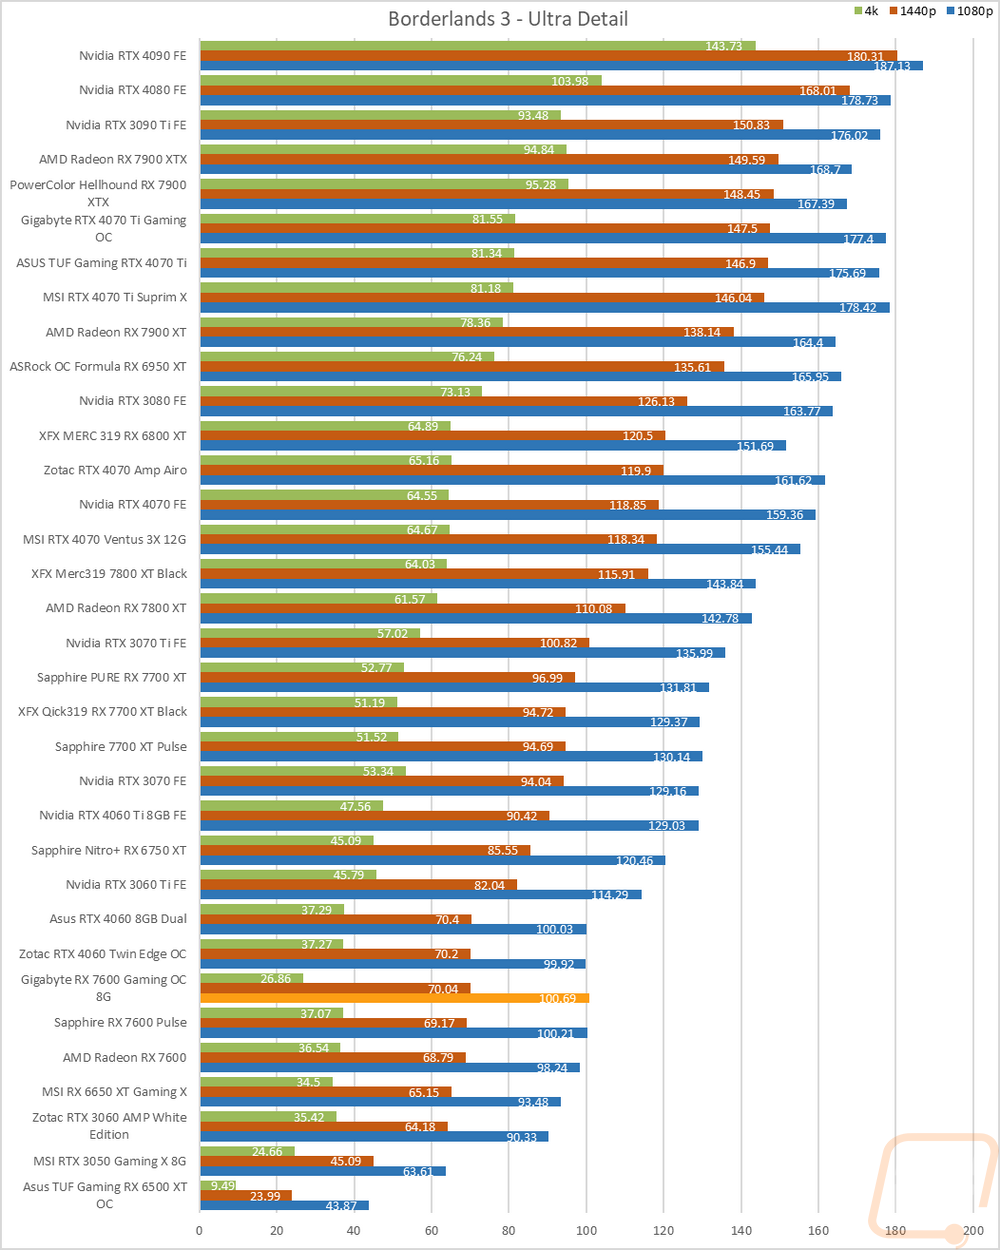
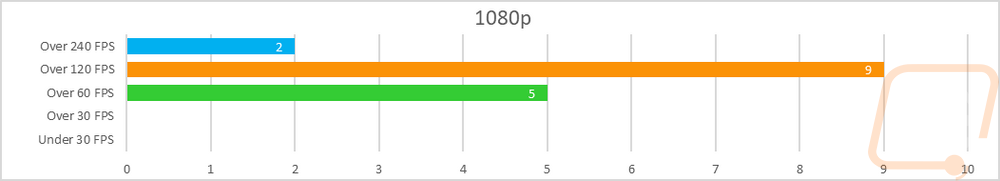
Now we finally get into the in game performance and that is the main reason people pick up a new video card. To test things out I ran through our new benchmark suite that tests 10 games at three different resolutions (1080p, 1440p, and 4k). Most of the games tested have been run at the highest detail setting and a mid-range detail setting to get a look at how turning things up hurts performance and to give an idea of if turning detail down from max will be beneficial for frame rates. In total, each video card is tested 48 times and that makes for a huge mess of results when you put them all together. To help with that I like to start with these overall playability graphs that take all of the results and give an easier-to-read result. I have one for each of the three resolutions and each is broken up into four FPS ranges. Under 30 FPS is considered unplayable, over 30 is playable but not ideal, over 60 is the sweet spot, and then over 120 FPS is for high refresh rate monitors.
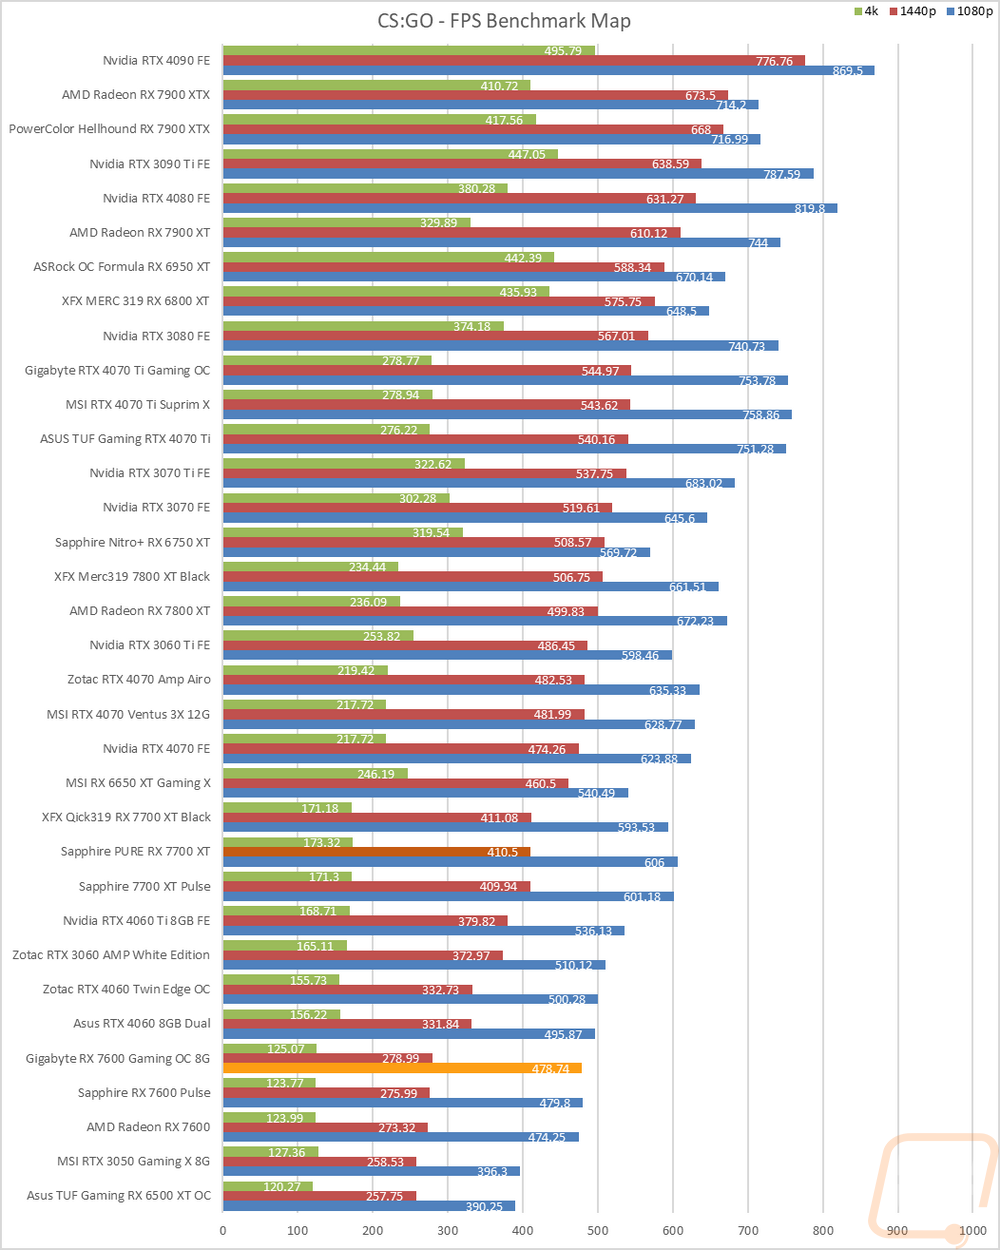
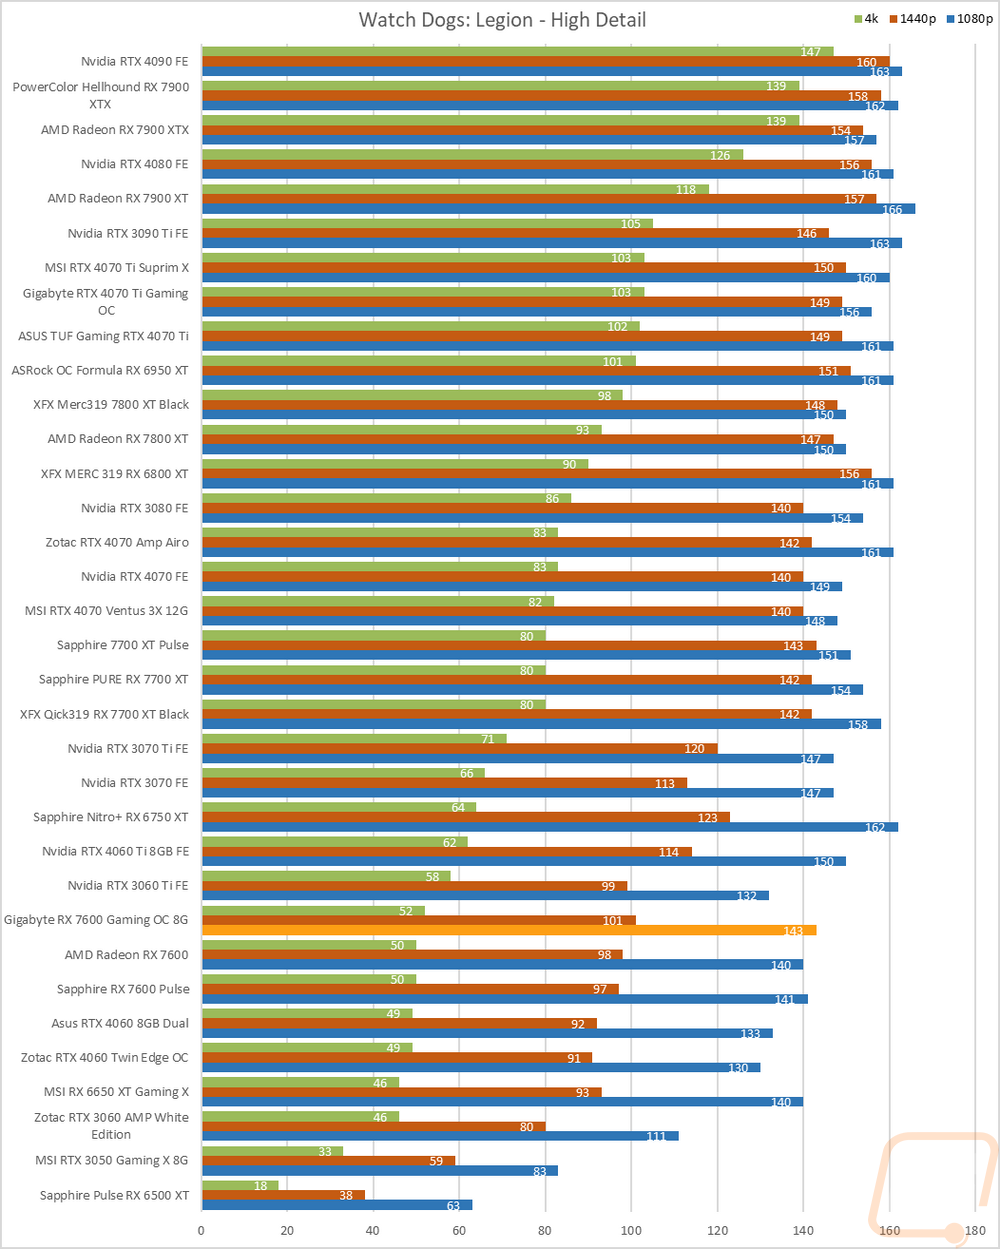
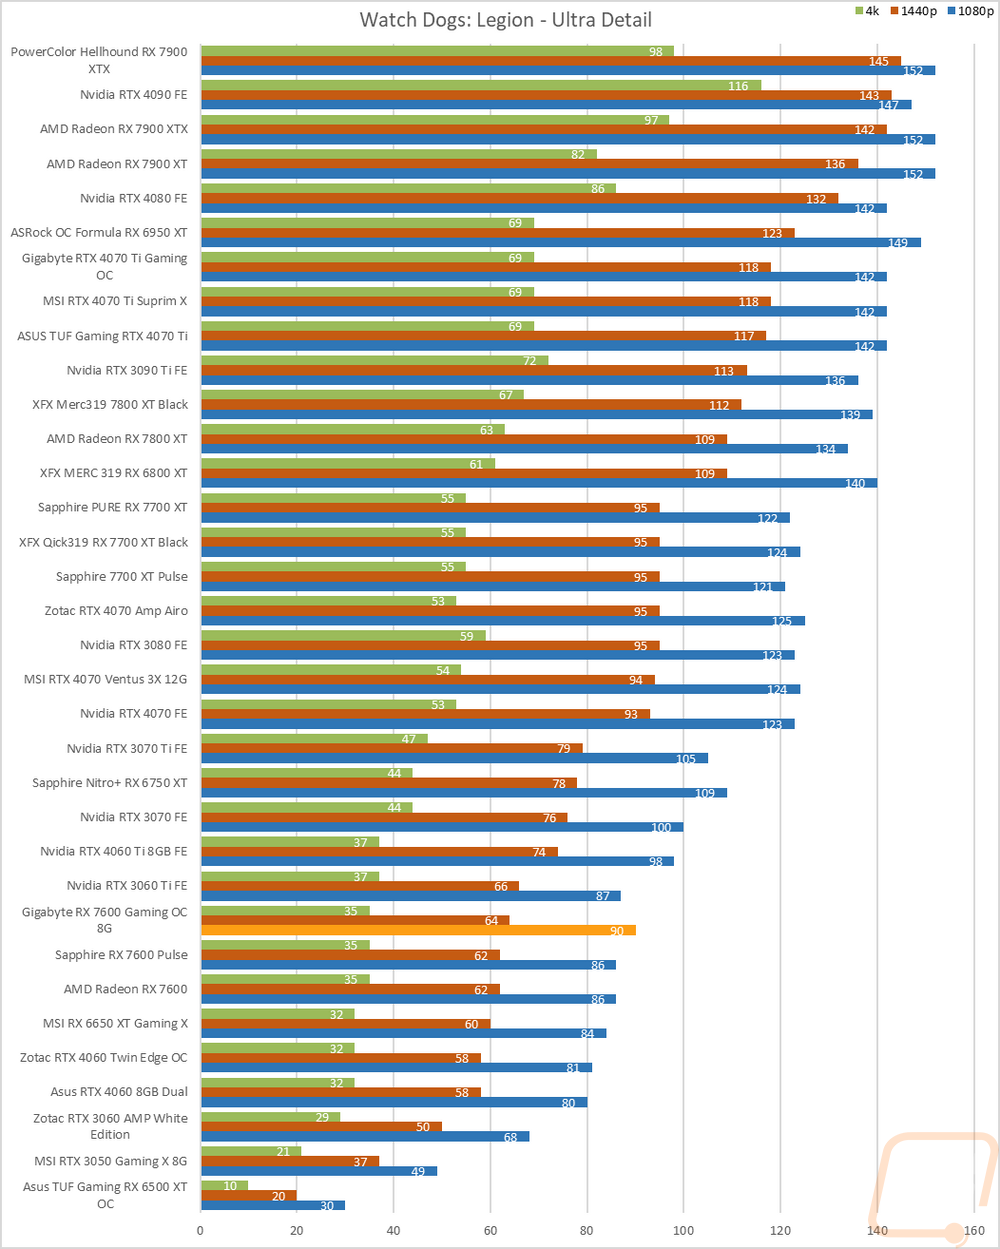
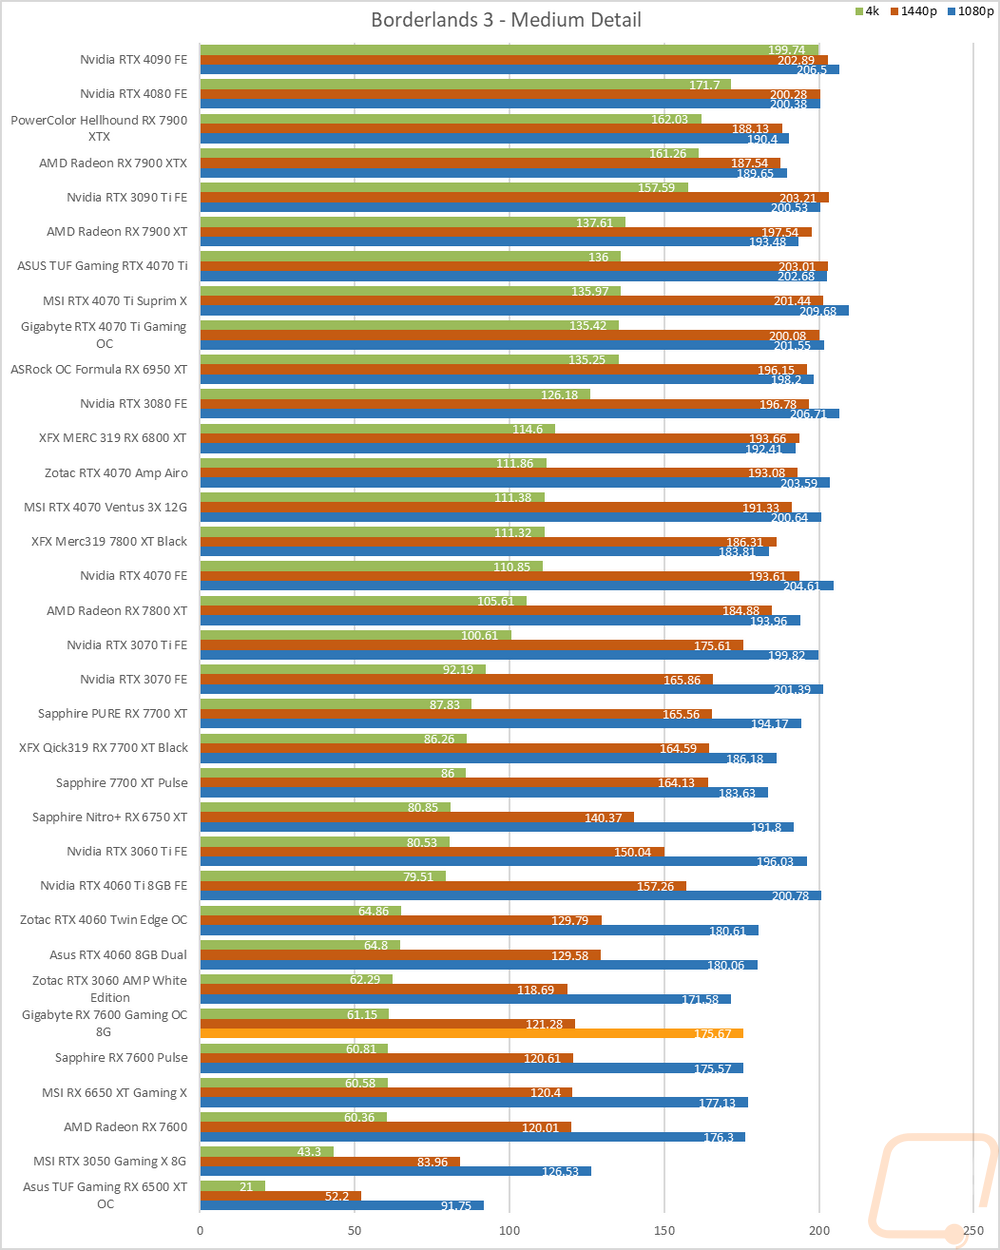
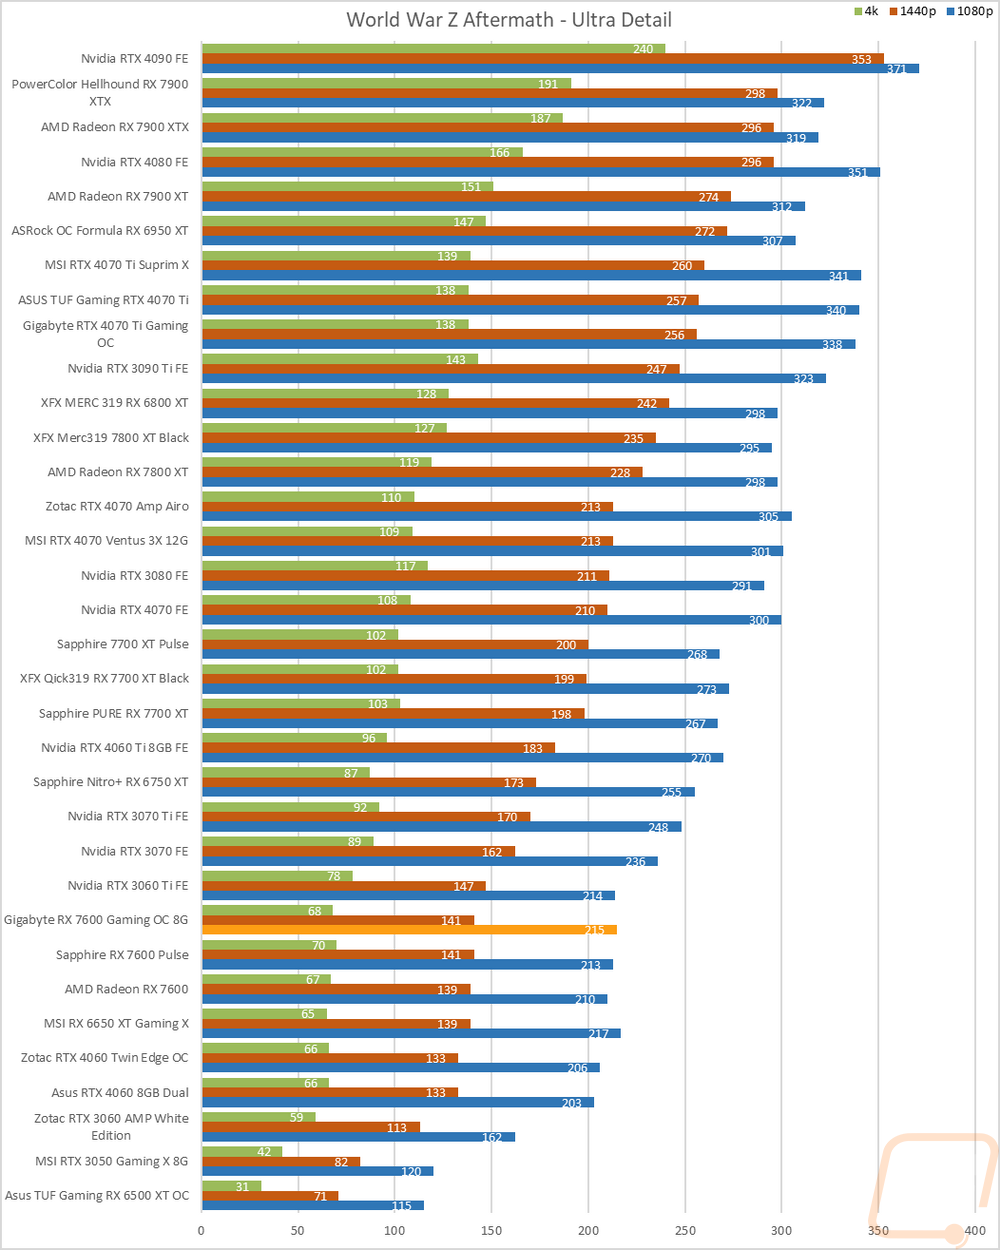
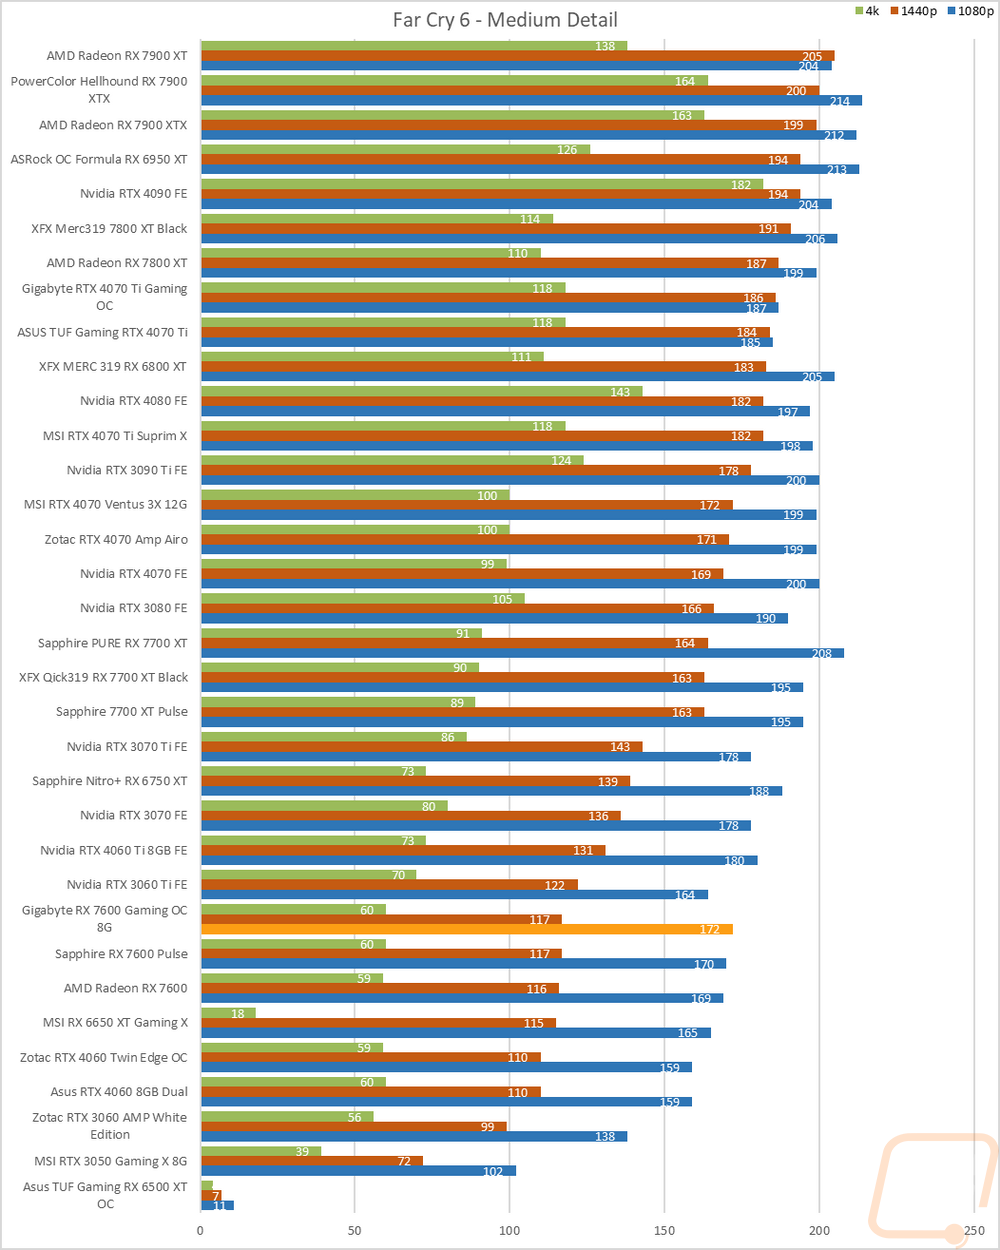
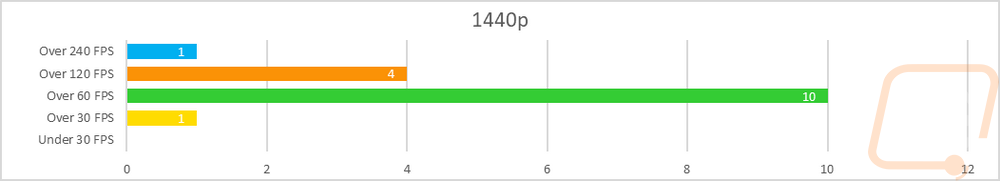
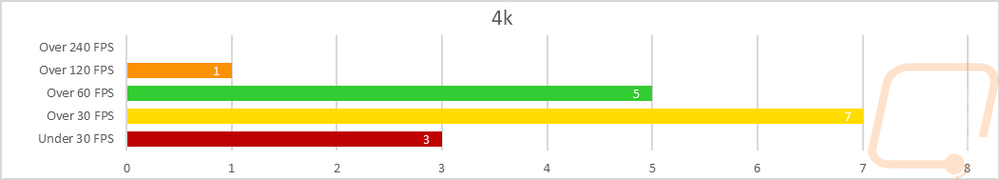
So how did the Gigabyte RX 7600 Gaming OC 8G do? Well at 1080p which is its targeted framerate none of the results were under 60 FPS. Two results reached over 240 FPS and a majority (nine) were over 120 FPS as well meaning in every situation the RX 7600 Gaming OC 8G will perform well at 1080p and in most situations it would get you framerates capable of matching up with a high-refresh display. At 1440p it still did better than you would expect. One result was in the 30-59 FPS range but other than that everything was over 60 FPS. Ten of the results were between 60-119 FPS and then 5 were at 120 or above with one also over 240 FPS. Of course at 4k things really fall apart. Three of the tests were unplayable and a majority were not smooth at all with 7 in the 30-59 FPS range. But a few were okay with six over 60 FPS and one of those over 120 FPS.
Of course, I have all of the actual in game results as well for anyone who wants to sort through the wall of graphs below. I also put together the averaged results for the RX 7600 Gaming OC 8G and a whole list of other cards around it including the two other RX 7600s that we have tested. These are averaged by resolution across all of the games tested other than CS:GO which its frame rates are so high it would mess up the numbers. The RX 7600 Gaming OC 8G averaged 143 FPS at 1080p, 2.2 FPS higher than stock and 1.3 FPS higher than the Pulse, which is similar to what I saw in the synthetic benchmarks. At 1440p the difference between the cards gets smaller and at 4k interestingly the RX 7600 Gaming OC 8G dropped behind slightly. All three of the RX 7600 come in behind the 3060 Ti but only slightly at 1080p for the RX 7600 Gaming OC 8G and ahead of the RTX 4060 by almost 8 FPS.
|
Average FPS (w/o CS:GO) |
1080p |
1440p |
4K |
|
RTX 3060 Ti |
144.8 |
105.4 |
59.2 |
|
Gigabyte RX 7600 Gaming OC 8G |
143.0 |
96.8 |
48.2 |
|
Sapphire RX 7600 Pulse |
141.7 |
96.6 |
50.6 |
|
Radeon RX 7600 |
140.8 |
96.7 |
50.4 |
|
MSI RX 6650 XT Gaming X |
138 |
93.9 |
42.9 |
|
Zotac RTX 4060 Twin Edge OC White Edition |
135.7 |
94.5 |
50.1 |
|
Asus RTX 4060 8GB Dual |
135.6 |
94.6 |
50.0 |
|
Zotac RTX 3060 AMP |
117.2 |
83.2 |
46.2 |