Cooling Noise and Power
For my last few tests, rather than focusing on in game performance, I like to check out other aspects of video card performance. These are also the most important ways to differentiate the performance between cards that have the same GPU. To start things off I took a look at power usage.
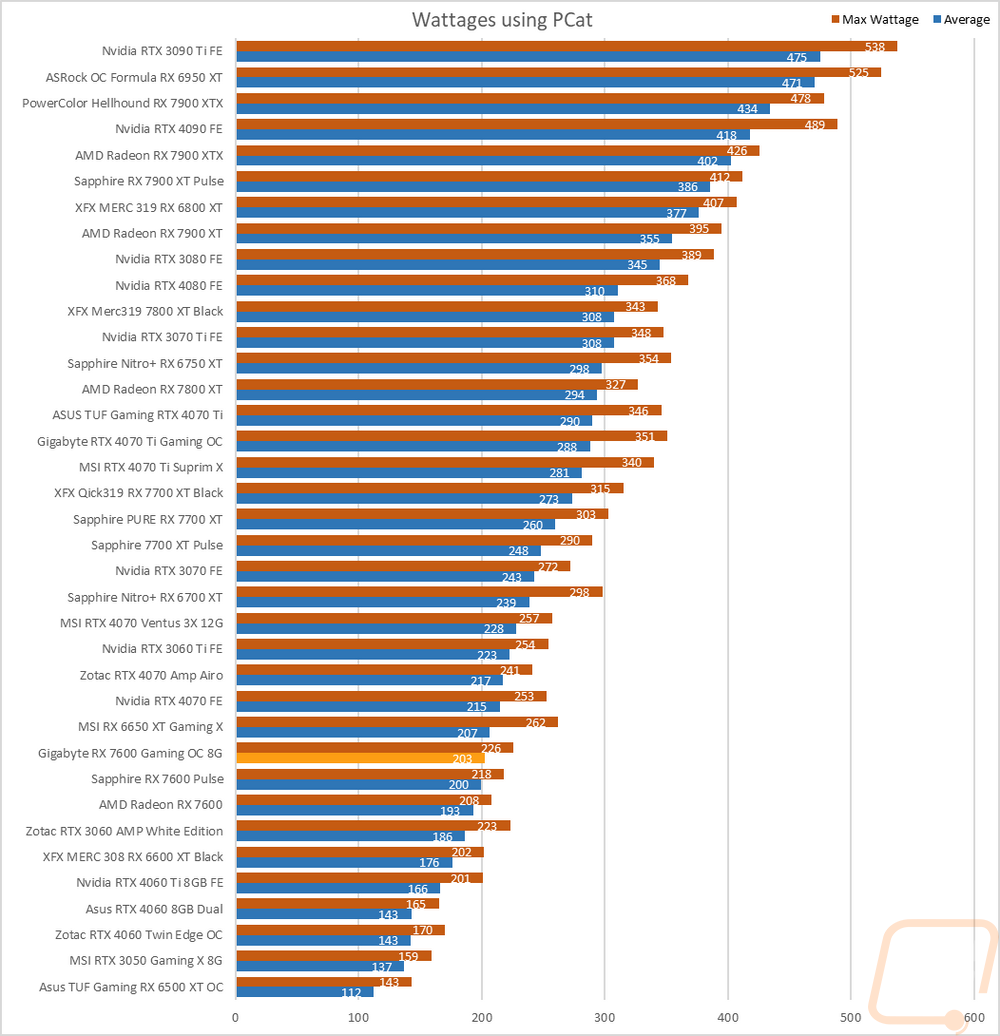
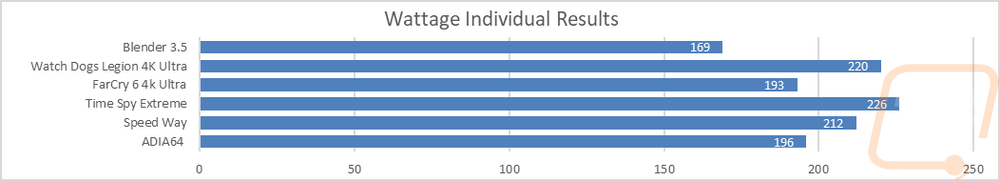
For this, our new test setup utilizes the Nvidia-designed PCat v2 along with cables to handle both traditional 6 or 8-pin connections as well as the new 12VHPWR. The PCat also utilizes a PCIe adapter to measure any power going to the card through the PCIe slot so we can measure the video card wattage exclusively, not the entire system as we have done in the past. I test with a mix of applications to get both in game, synthetic benchmarks, and other workloads like Blender and AIDA64. Then everything is averaged together for our result. I also have the individual results for this specific card and I document the peak wattage result as well which is almost always Time Spy Extreme. The RX 7600 Gaming OC 8G averaged 203 watts which was 3 watts over the Sapphire Pulse and 10 watts over the stock clocked reference card. The peak wattage was also higher at 226 watts, 8 watts over the Pulse, and 18 watts more than the reference card. For comparison, the RTX 4060 averaged just 143 watts and 165 watts at peak.
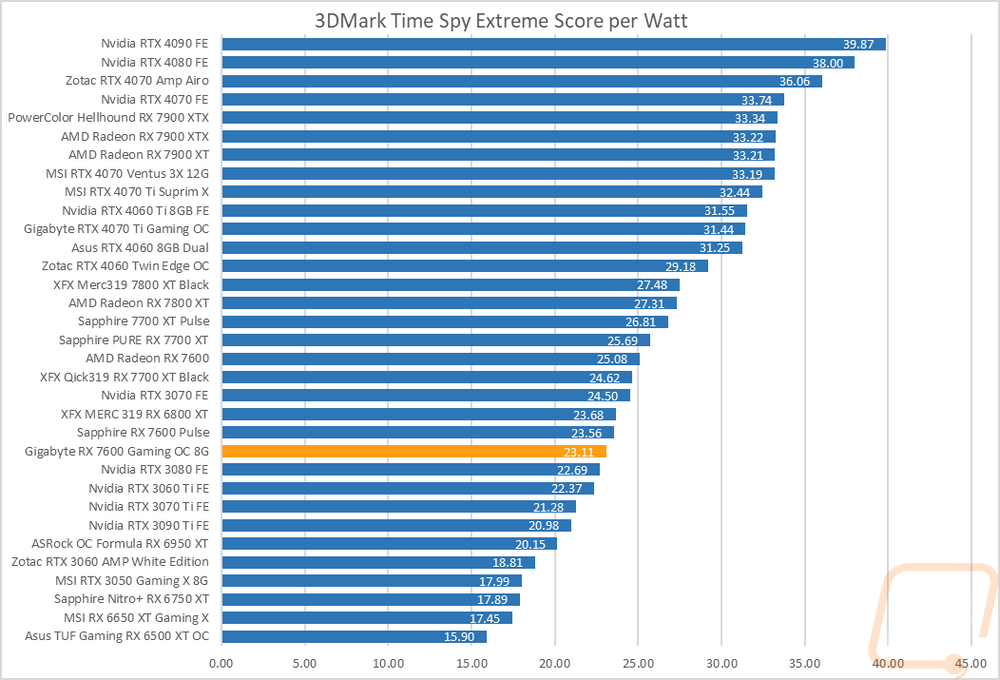
With having exact peak wattage numbers when running Time Spy Extreme I was also able to put together a graph showing the total score for each watt that a card draws which gives us an interesting look at overall power efficiency in the popular and demanding benchmark. The small performance improvements we saw from the overclock in the synthetic tests and across the board when combined with the higher wattage dropped the efficiency rating down for the RX 7600 Gaming OC 8G. It was at 23.11 with the Pulse higher at 23.56 and the reference card even higher at 25.08. This put it down in the mix with some of last generation's cards which are a lot less efficient than this generation.
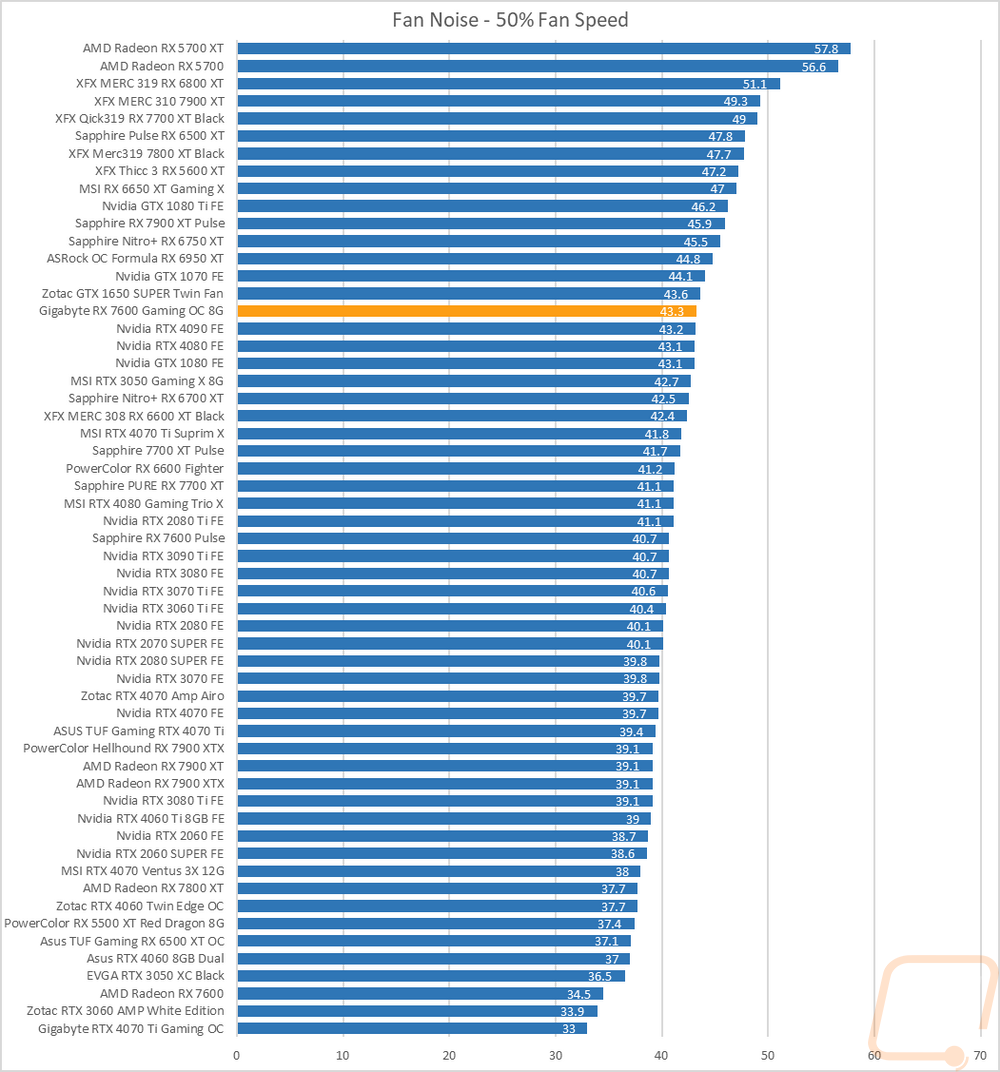
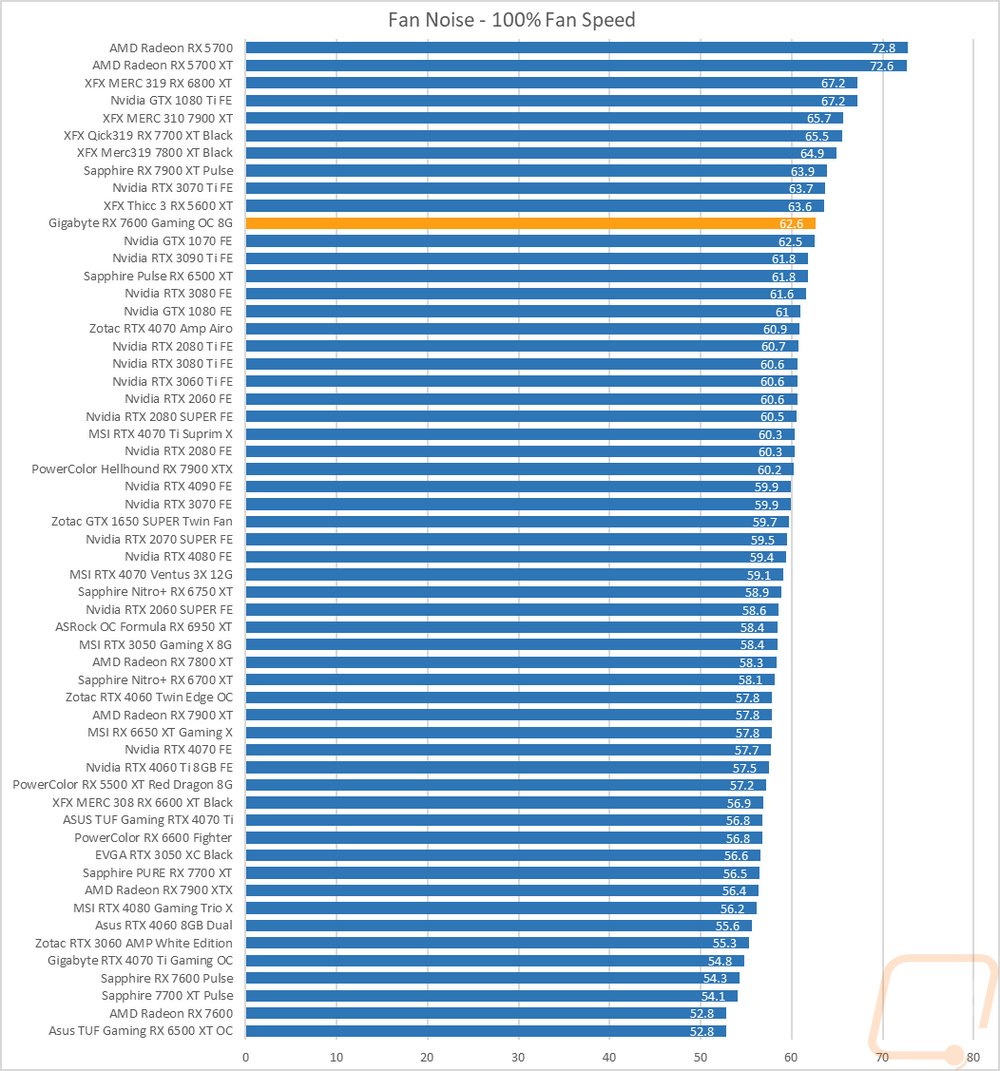
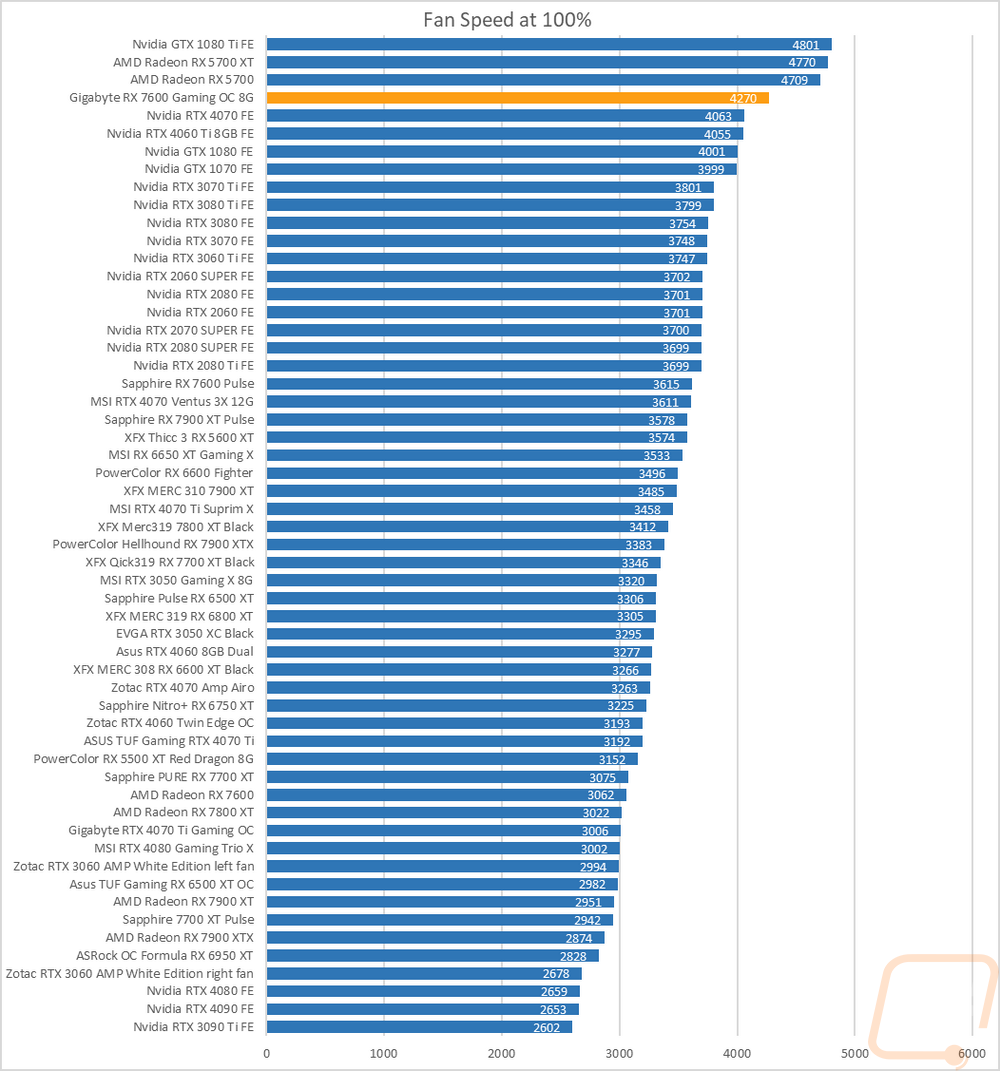
My next round of tests were looking at noise levels. These are especially important to me because I can’t stand to listen to my PC whirling. Especially when I’m not in game and other applications are using the GPU. For my testing, though I first tested with the fan cranked up to 100% to get an idea of how loud it can get, then again at 50% to get an idea of its range. The RX 7600 Gaming OC 8G came in at 43.3 decibels at 50% fan speed and 62.6 decibels at 100%, both put it up in the top 1/3 of the chart. This was in line with the fan speed though which was also right up in that same area, higher up in the graph in fact at 4270 RPM.
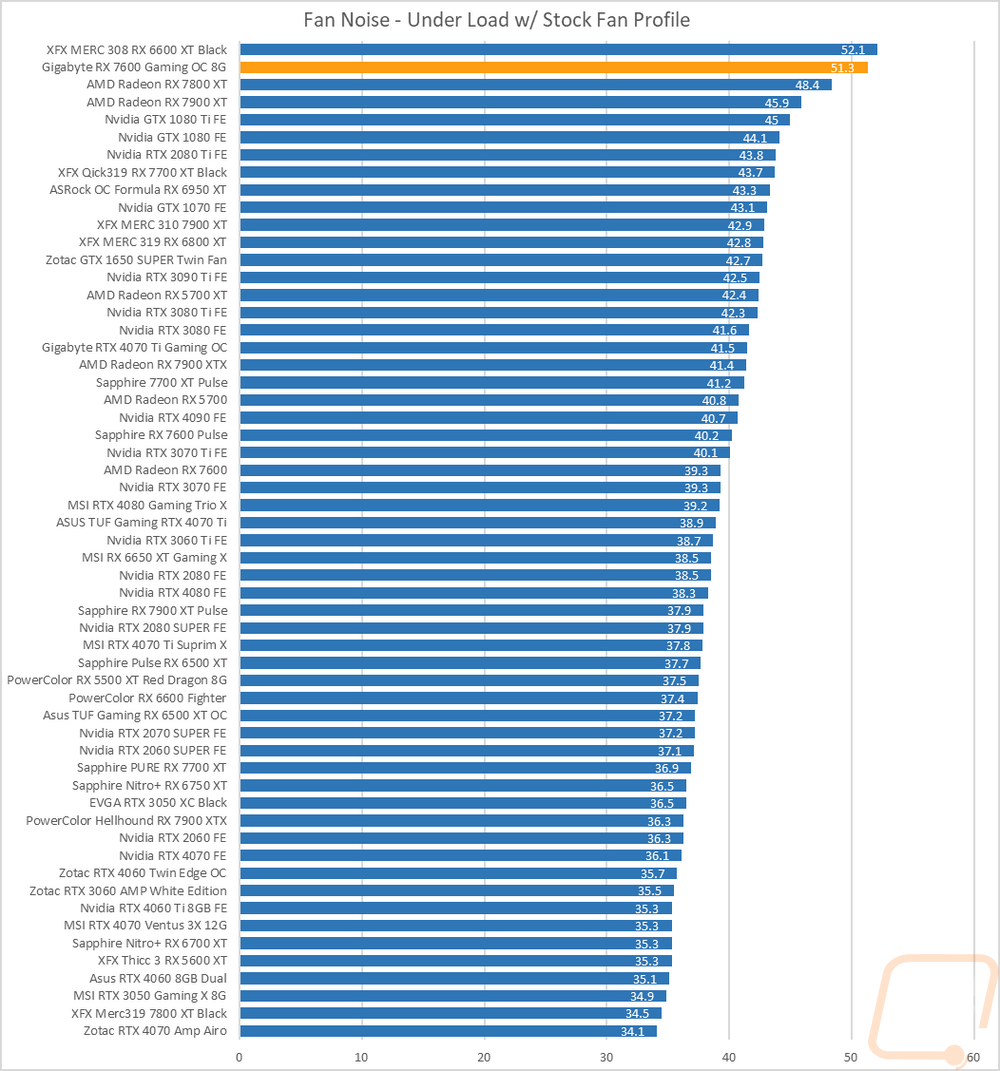
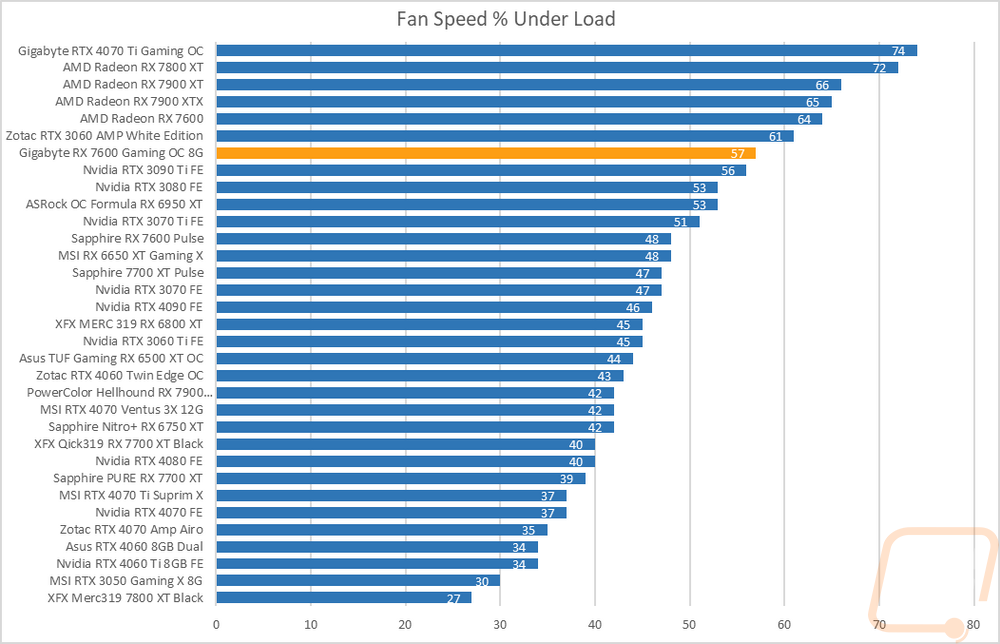
I also take a look at noise performance while under load. For that when running AIDA64’s stress test I wait until the temperature of the card has leveled off and then measure how loud things are when the card is at its worst-case scenario with the stock fan profile. Here the RX 7600 Gaming OC 8G was loud under load at 51.3 decibels making it the second loudest card tested. The fan profile and temps had it running at 57% fan speed when under load.
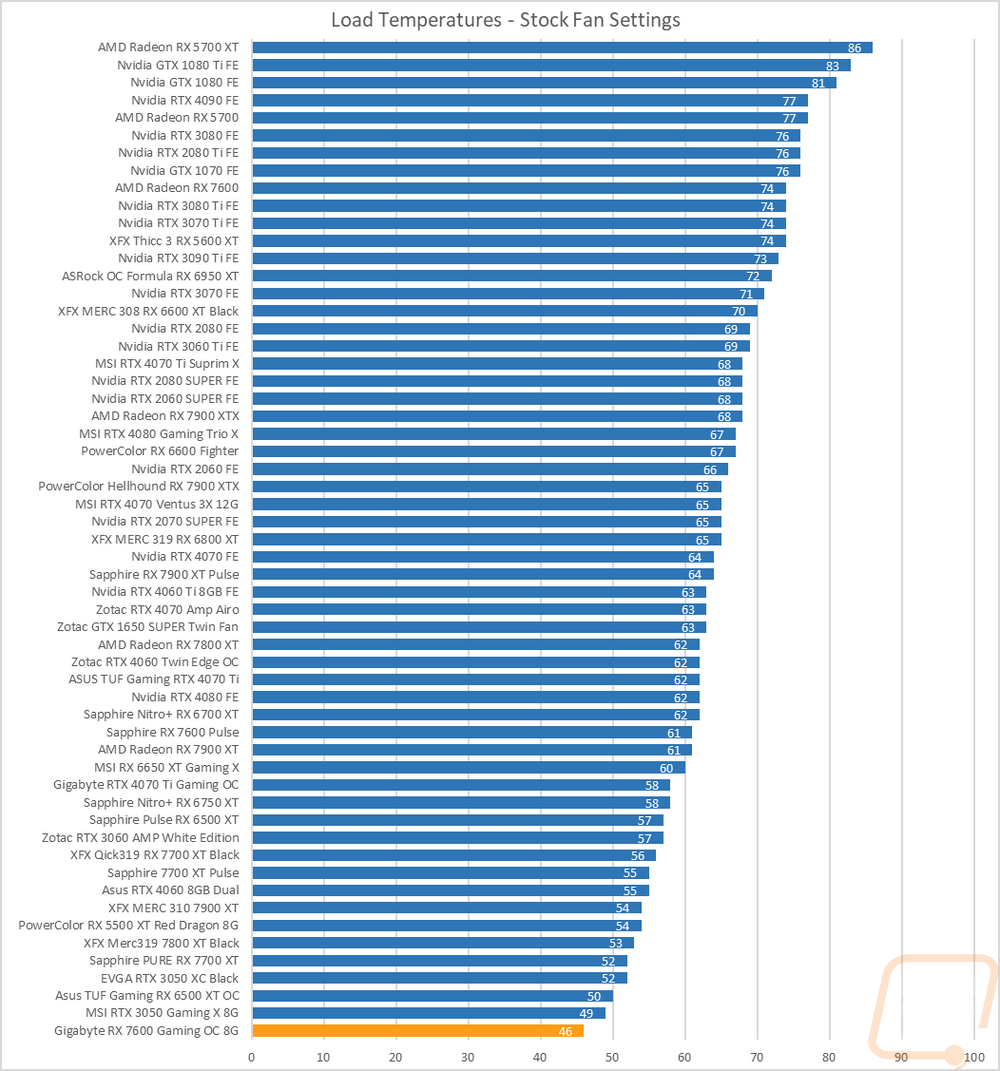
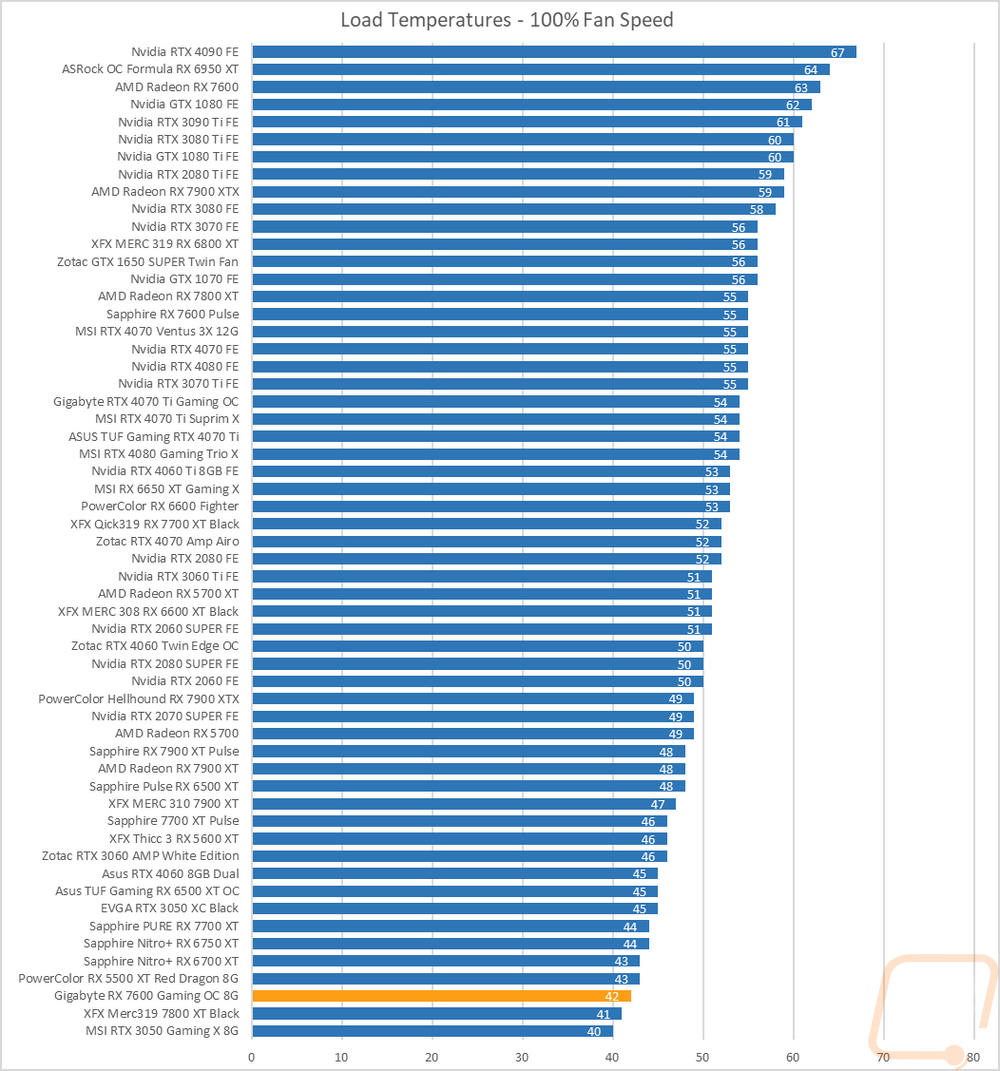
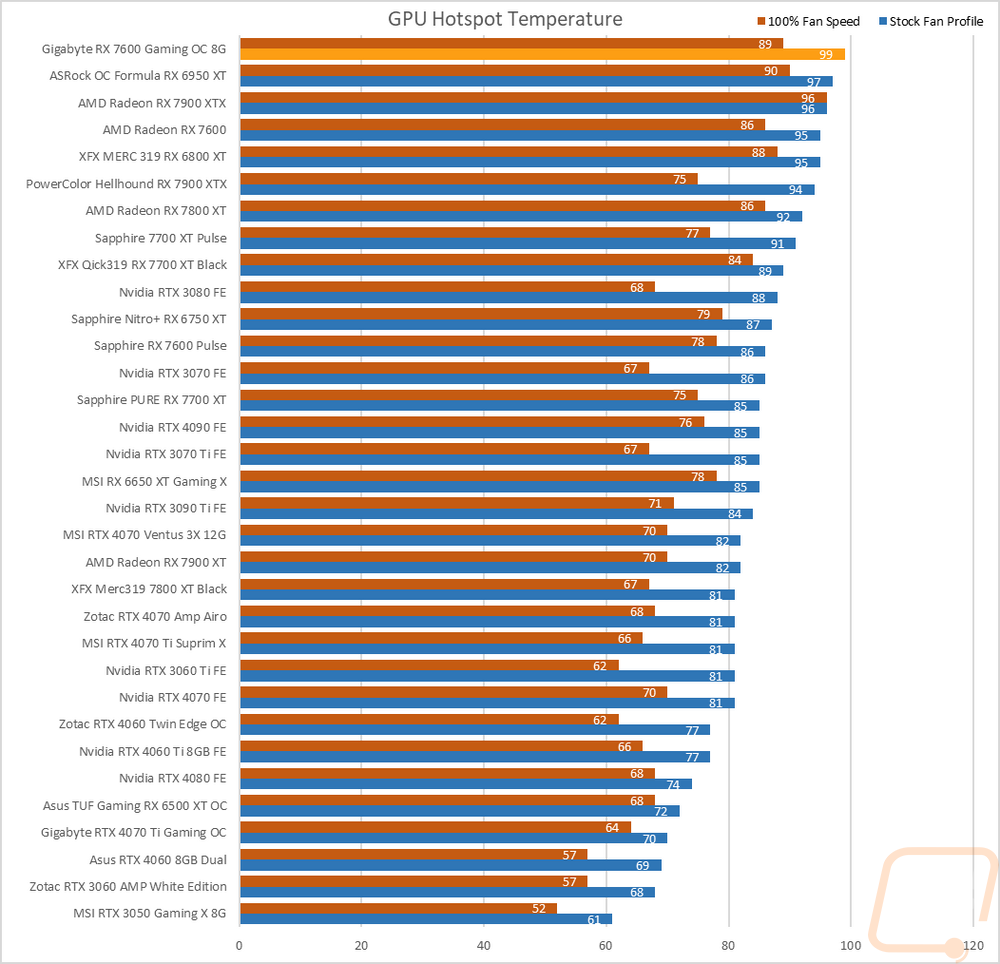
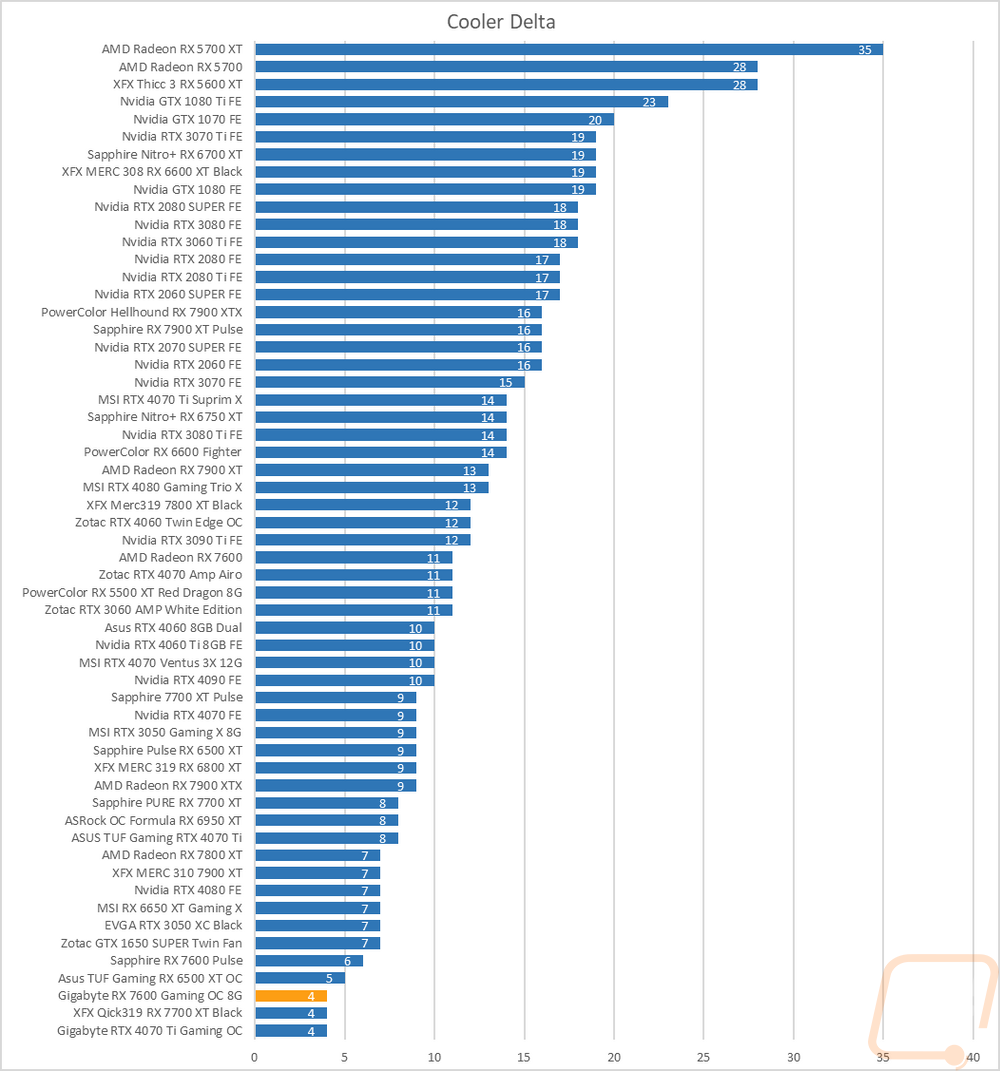
To finish up my testing I of course had to check out the cooling performance. To do this I ran two different tests. I used AIDA64’s Stress Test run for a half-hour each to warm things up. Then I documented what temperature the GPU leveled out at with the stock fan profile and then again with the fans cranked up to 100%. With the stock profile, the RX 7600 Gaming OC 8G was down at the bottom of our chart at 46c and 99c for its GPU hotspot. Cranking the triple fan cooler up to 100% kept it down near the bottom of the chart again at a cool 42c and the GPU hotspot dropped down to 89c which was still hot but an improvement. The delta between the stock profile and 100% fan speed results was just 4c which is very small. It’s really clear that the stock fan profile is extremely aggressive which could be tuned down and help the noise results we saw as well.
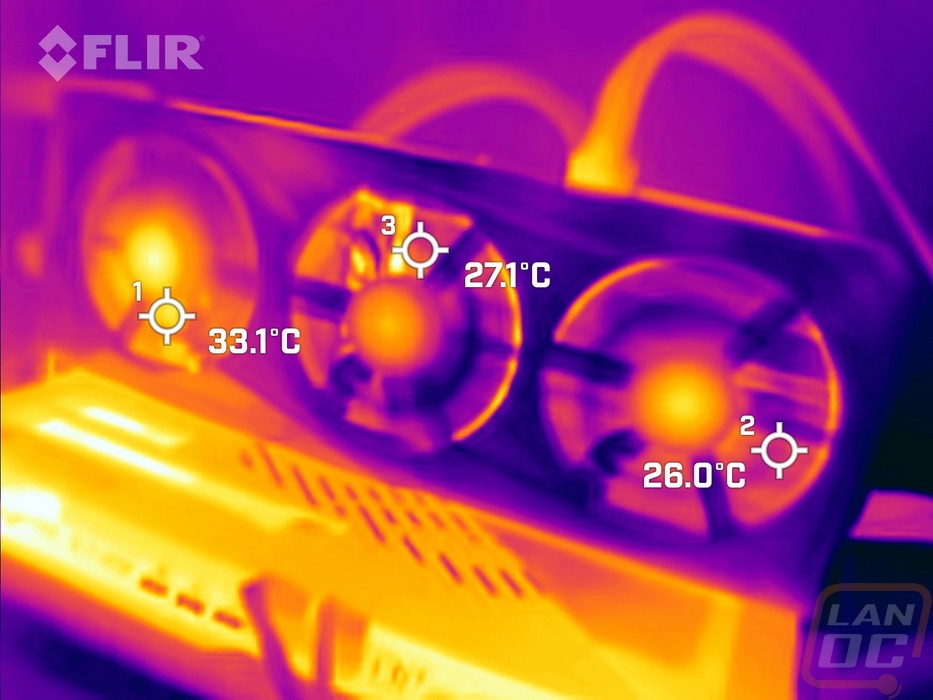
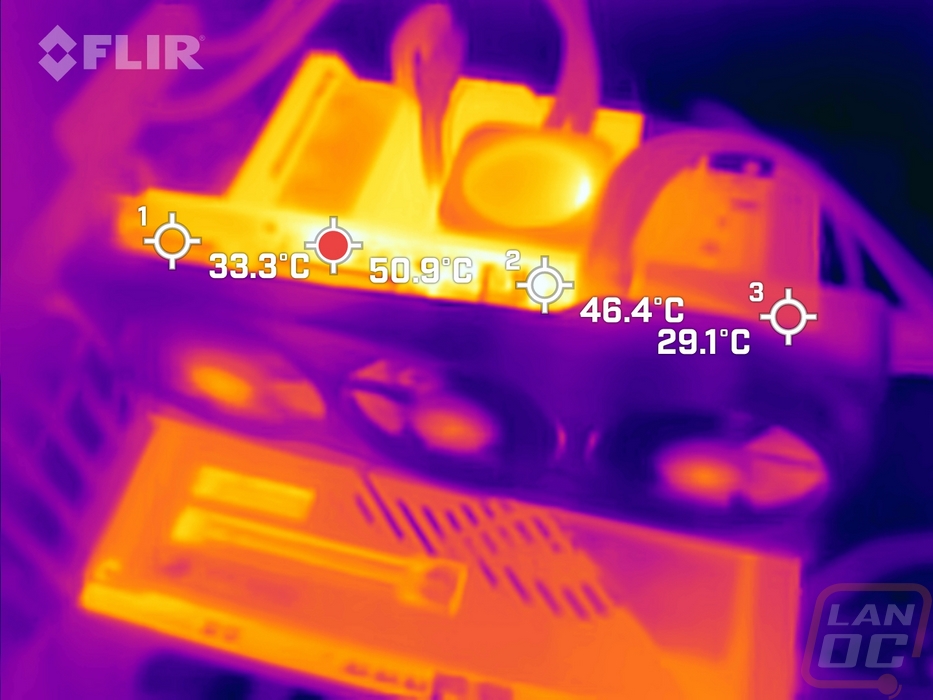
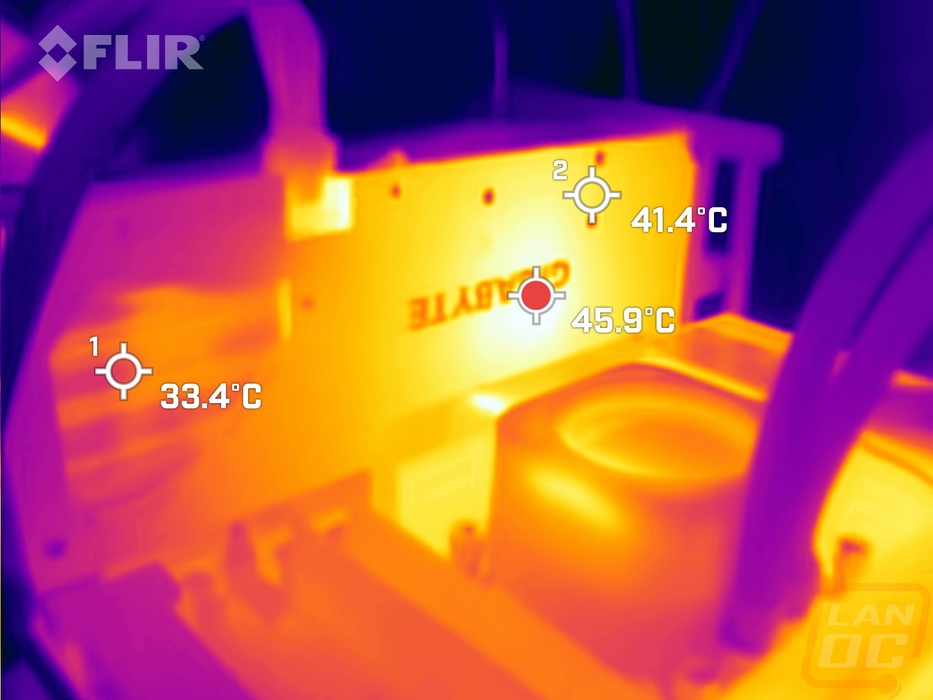
While running the stock fan profile testing I also took the time to get a few thermal images so we could see what is going on. The fan side of the RX 7600 Gaming OC 8G has the most heat all the way on the end toward the PCI bracket. The cooler design does have a much larger cooler on the other end so this end may have to deal with a little more heat but even at its hottest 33c isn’t too hot. The middle fan was cooler other than where we can see the heatpipes and the PCB then at the end the blow-through fan was the coolest of course. The top edge is a lot warmer with its hottest spot, some of the exposed PCB, at 50.9c but the exposed heatsinks aren’t as hot with 33.3c on one end and 29.1c on the other end. Then the metal backplate does show that it is spreading the heat out. The hottest spot is right behind the PCU but that spreads out across half of the card.