Synthetic Benchmarks
As always I like to start my testing with a few synthetic benchmarks. 3DMark especially is one of my favorites because it is very optimized in both Nvidia and AMD drivers. It's nice to not have to worry about it being favored too much either way and the repeatability of the results makes it a nice chance to compare from card to card, especially when comparing with the same GPU. For the Gigabyte RX 7600 Gaming OC 8G, I have previously taken a look at the AMD reference RX 7600 as well as the Sapphire Pulse RX 7600. The Pulse had a boost clock speed of 2751 MHz and the reference card had a boost clock of 2655 MHz. The RX 7600 Gaming OC 8G is a little higher than both reaching up to 2755 MHz. For the base clock speed, the Pulse ran at 2356 Mhz which is over the 2250 MHz of the reference card. The RX 7600 Gaming OC 8G is right in line with that, 1 MHz lower than the Pulse at 2355 MHz. It will be interesting to see how that affects performance.
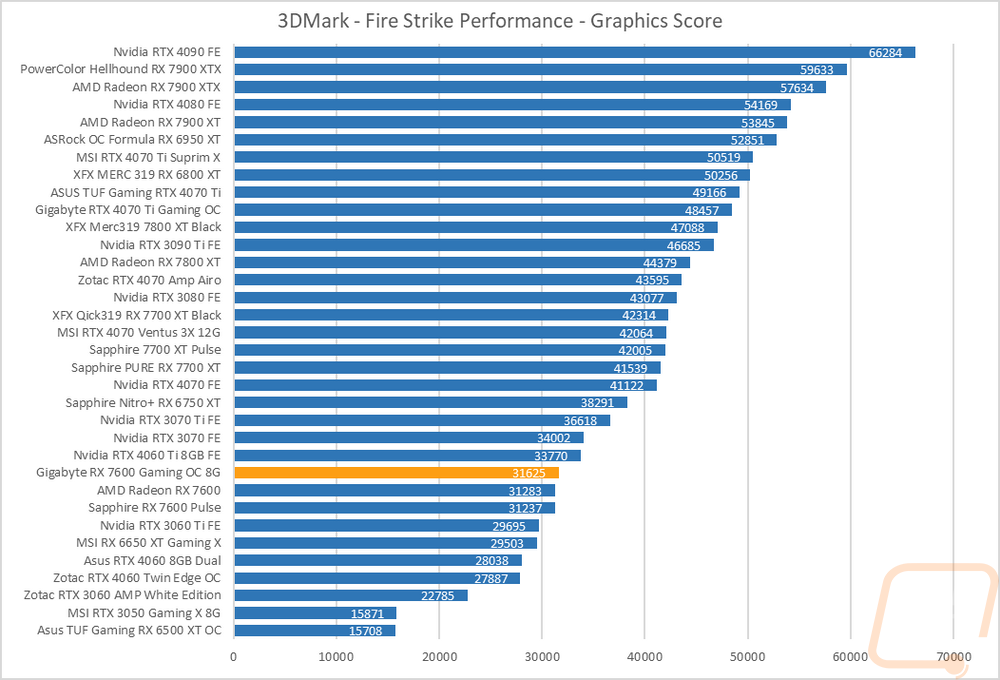
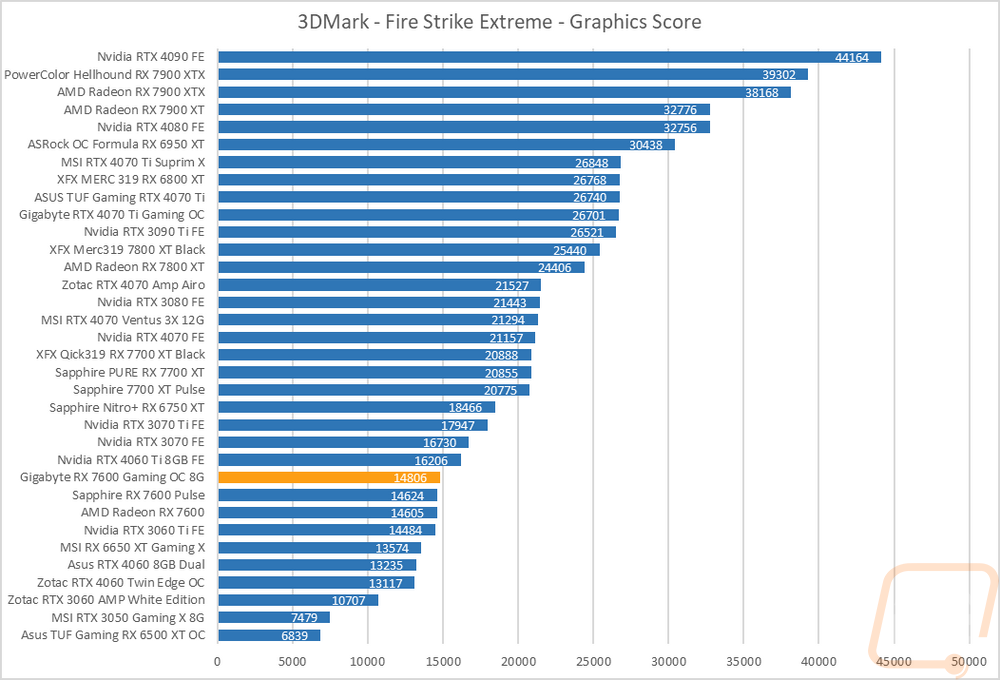
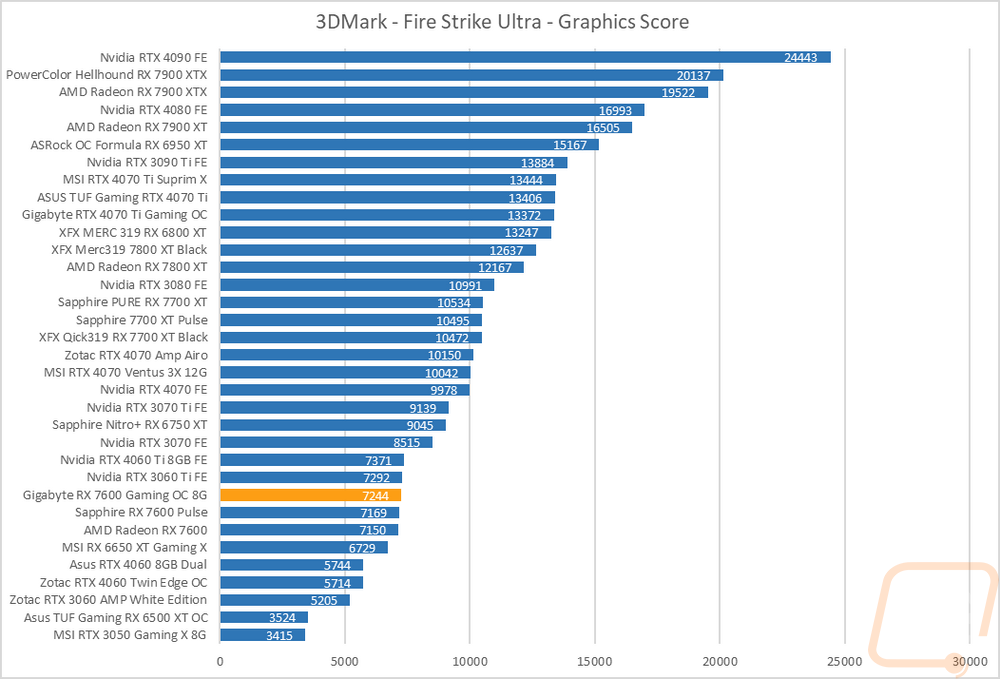
The first round of tests were done in the older Fire Strike benchmark which is a DX11 test. There are three detail levels, performance, extreme, and ultra. The RX 7600 Gaming OC 8G was out ahead of the stock 7600 and Pulse by 1% on the base Fire Strike test, 1.3% in Fire Strike Extreme, and 1.3% on Fire Strike Ulta.
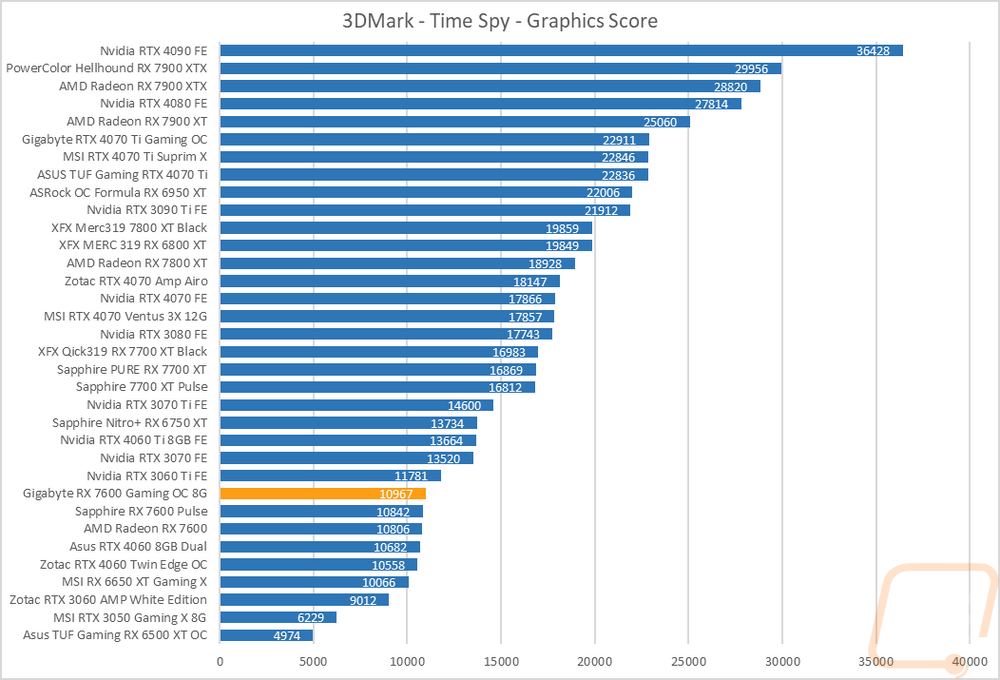
The next two were both based on the Time Spy benchmark. One is the standard test and then there is the extreme detail level. This is a DX12 test which is more relevant to today's games. The RX 7600 Gaming OC 8G scored a 10967 on the base Time Spy which put it 1.5% ahead of the stock RX 7600 and nearly the same for the Sapphire Pulse. It reached 2% in the Time Spy Extreme test as well, again in front of the Pulse as well. This wasn’t enough to change where it landed compared to everything else though with the RTX 3060 Ti in front of it and the RTX 4060 just barely behind it.

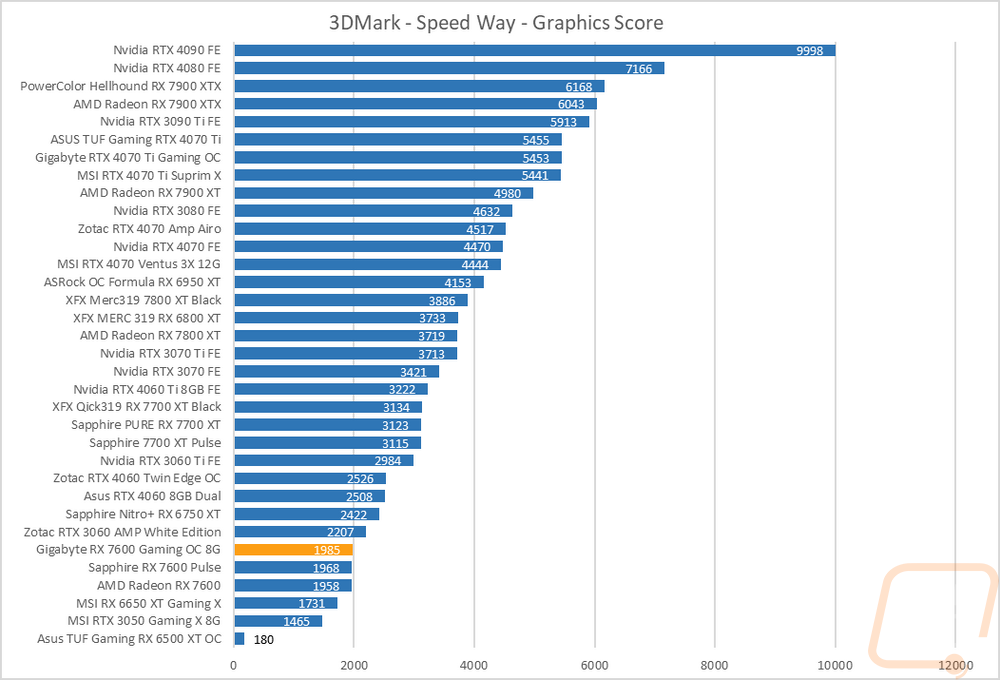
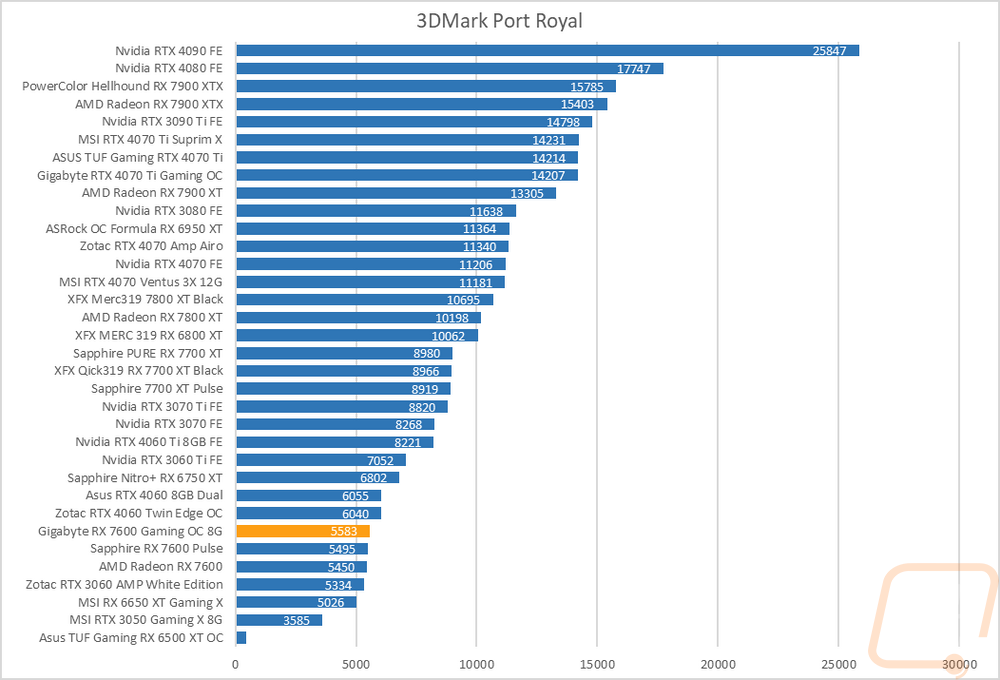
For ray tracing performance, I ran both the 3DMark Port Royal test which is ray tracing focused as well as the new 3DMark Speed Way test which tests all future-looking features including ray tracing. In Speed Way, the RX 7600 Gaming OC 8G scored a 1985 which does put it out ahead of both of the other RX 7600s but down below the RTX 3060 when compared to Nvidia’s cards, AMD as a whole is struggling here. The same goes for Port Royal where the RX 7600 Gaming OC 8G is behind the RTX 4060 but 2.4% ahead of the stock clocked RX 7600.
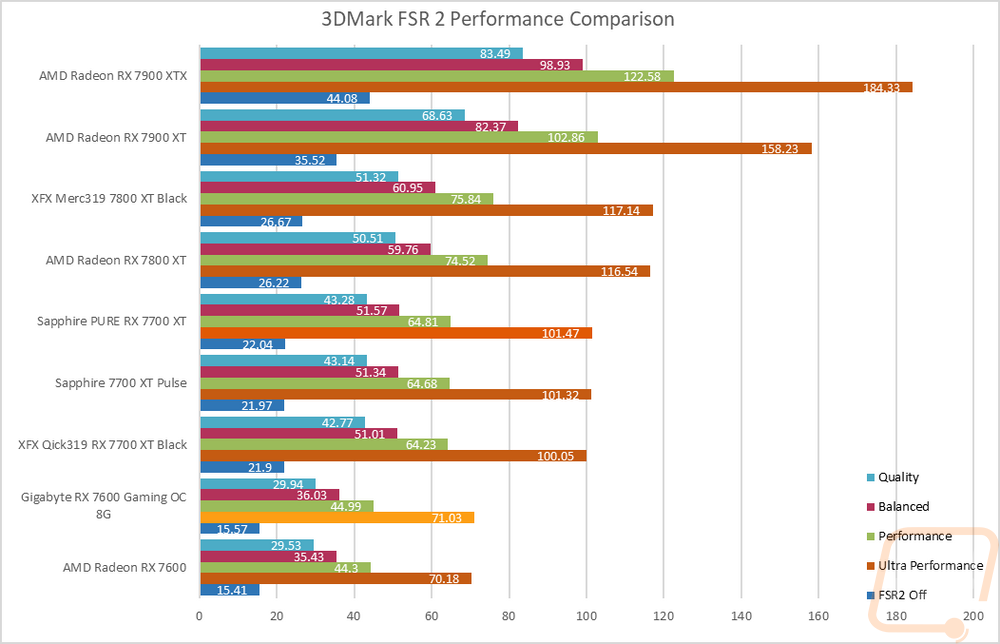
I added in one more test while in 3Dmark, this time testing the FSR 2 performance across all of the detail settings. The RX 7600 Gaming OC 8G isn’t really that far ahead of the stock 7600, but this does give a great example of how FSP 2 can improve performance at times. The RX 7600 Gaming OC 8G went from 15FPS and doubled it for the highest detail. That went up to 36 and then 44 FPS on the balanced and performance settings then an impressive 71 FPS with ultra performance.
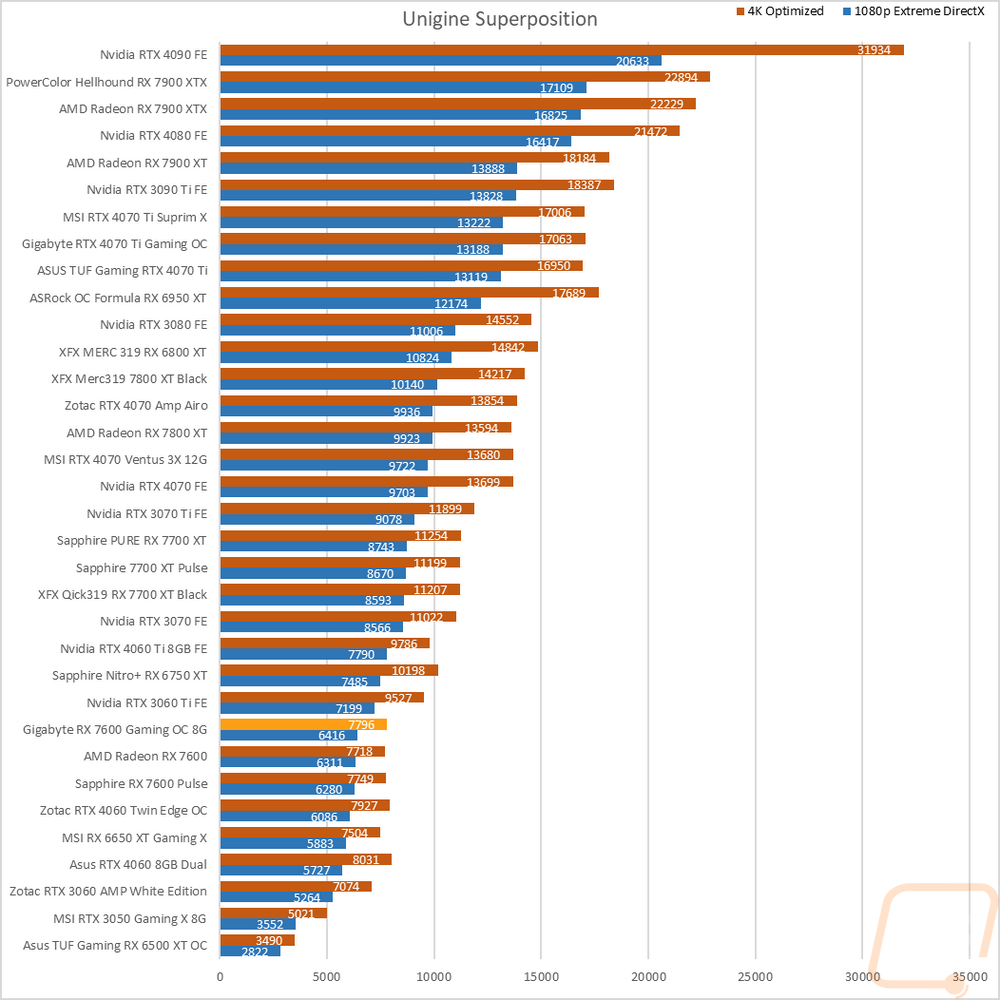
The last test was using the Unigine-based Superposition benchmark and I tested at 1080p with the extreme detail setting as well as the 4K optimized setting. In the extreme detail setting all three of the RX 7600 are still clumped together but the RX 7600 Gaming OC 8G was out in front in both the 4K and 1080P Extreme tests. The RTX 4060 was behind them in the 1080p results but ahead in the 4K test just slightly.