In-Game Benchmarks
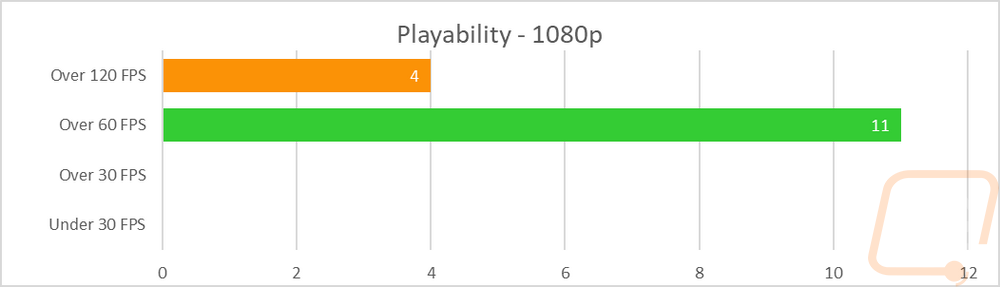
Now we finally get into the in game performance and that is the main reason people pick up a new video card. To test things out I ran through our new benchmark suite that tests 9 games at three different resolutions (1080p, 1440p, and 4k). Most of the games tested have been run at the highest detail setting and a mid-range detail setting to get a look at how turning things up hurts performance and to give an idea of if turning detail down from max will be beneficial for frame rates. In total, each video card is tested 48 times and that makes for a huge mess of results when you put them all together. To help with that I like to start with these overall playability graphs that take all of the results and give an easier to read result. I have one for each of the three resolutions and each is broken up into four FPS ranges. Under 30 FPS is considered unplayable, over 30 is playable but not ideal, over 60 is the sweet spot, and then over 120 FPS is for high refresh rate monitors.
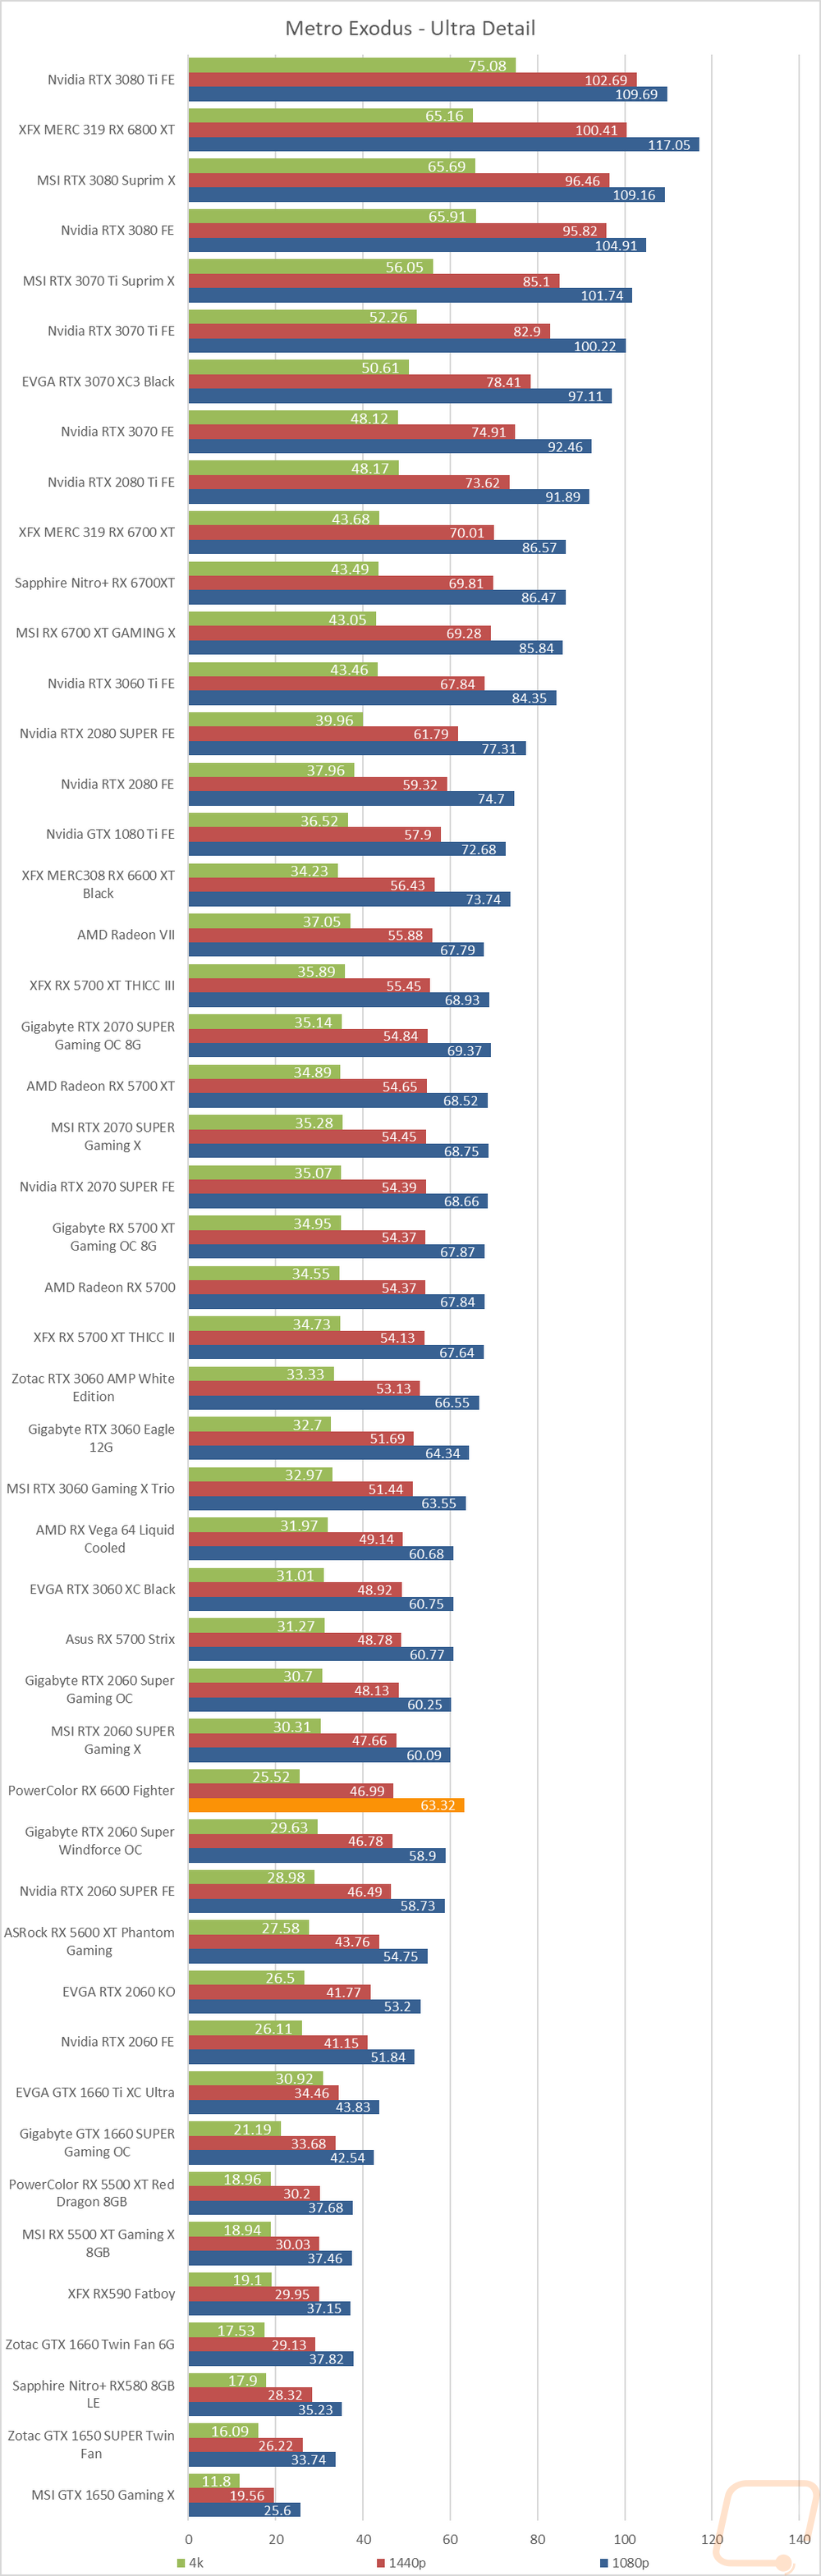
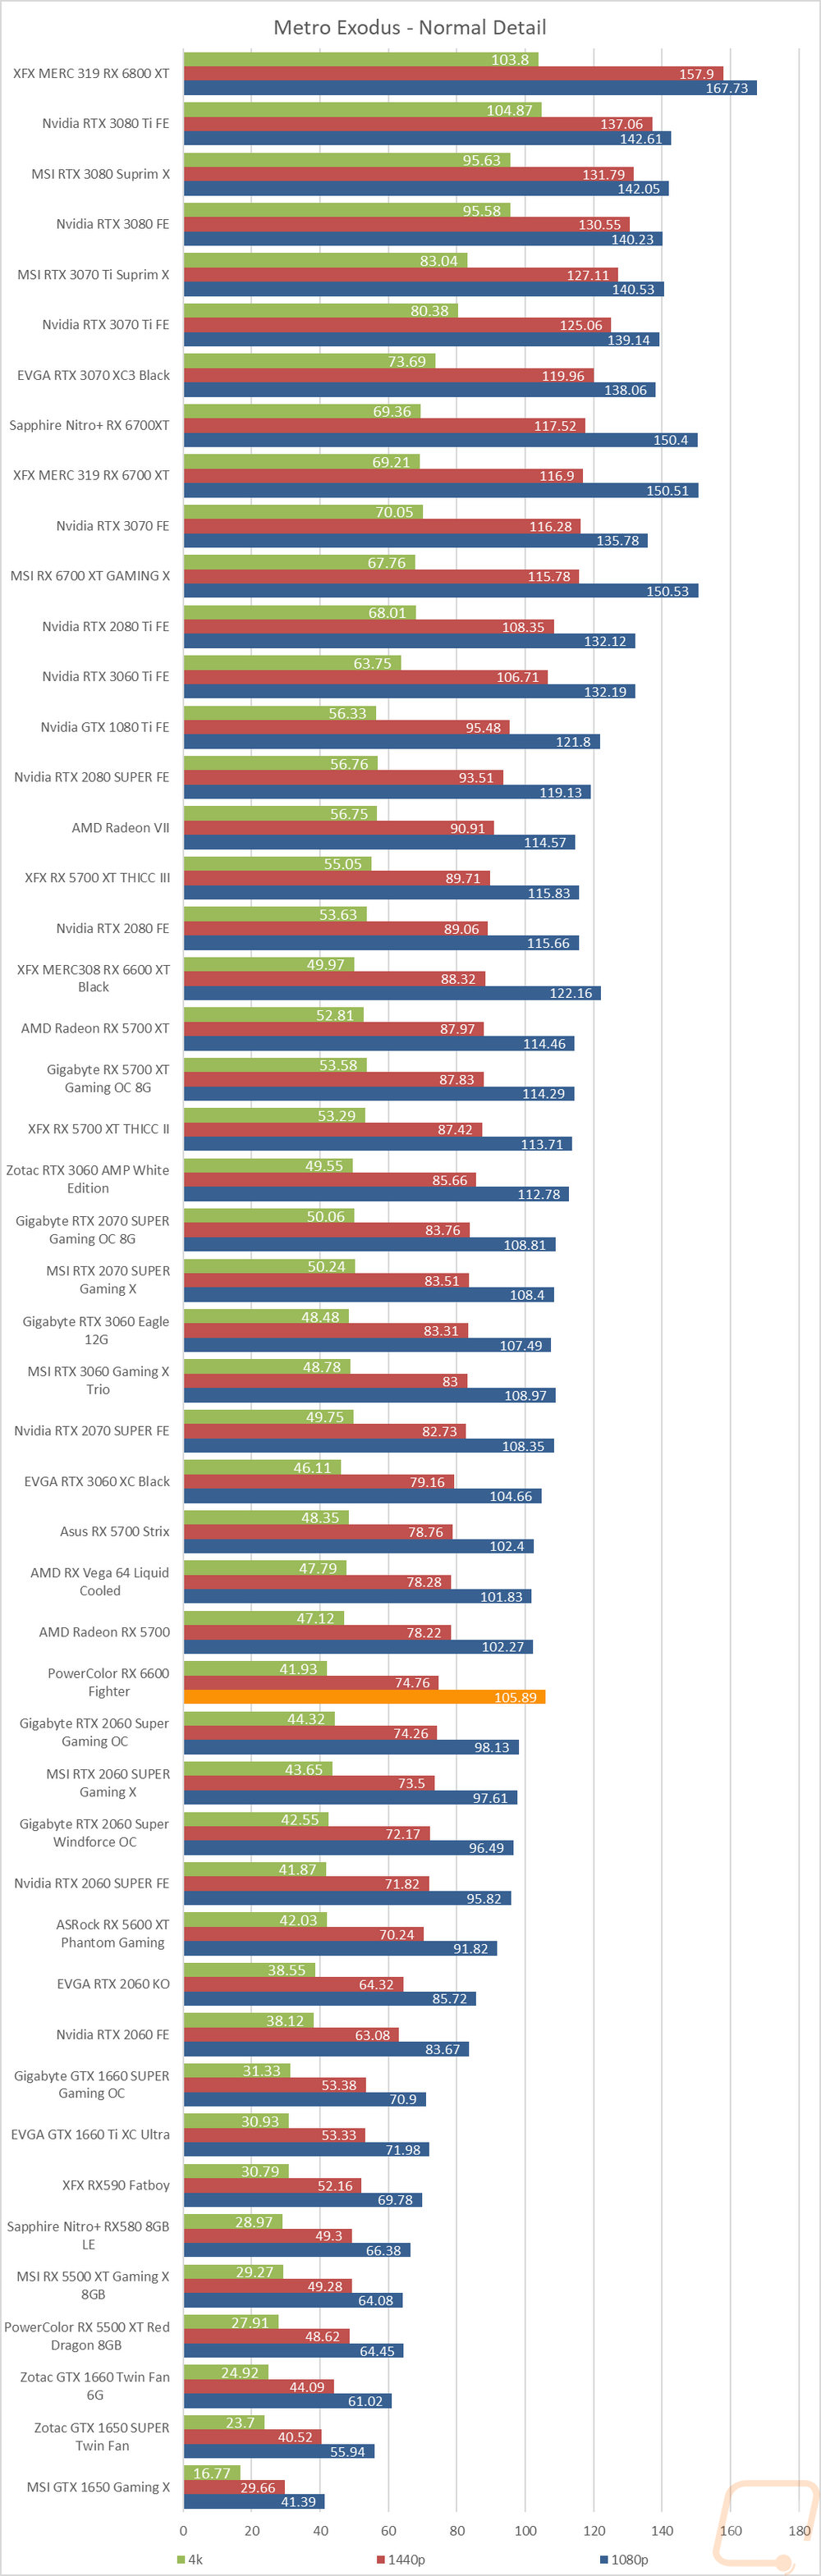
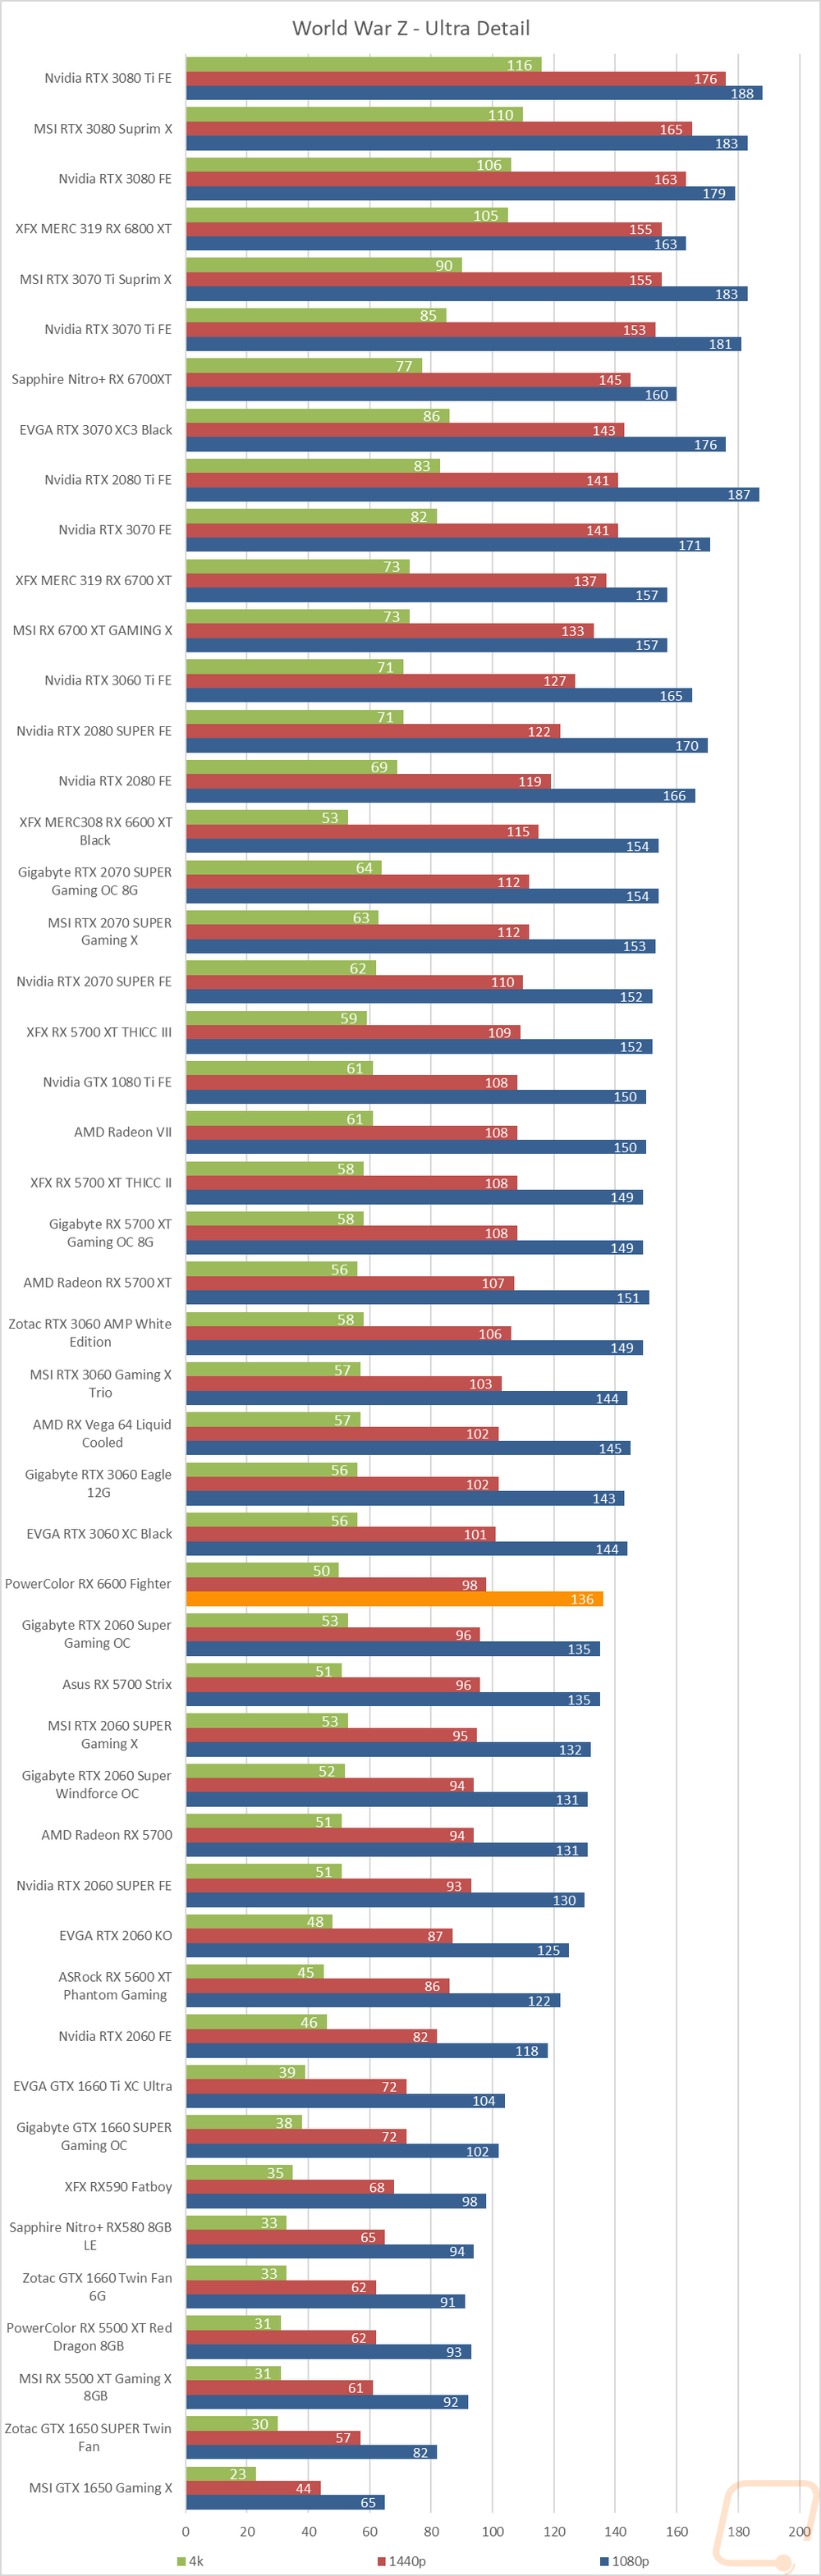
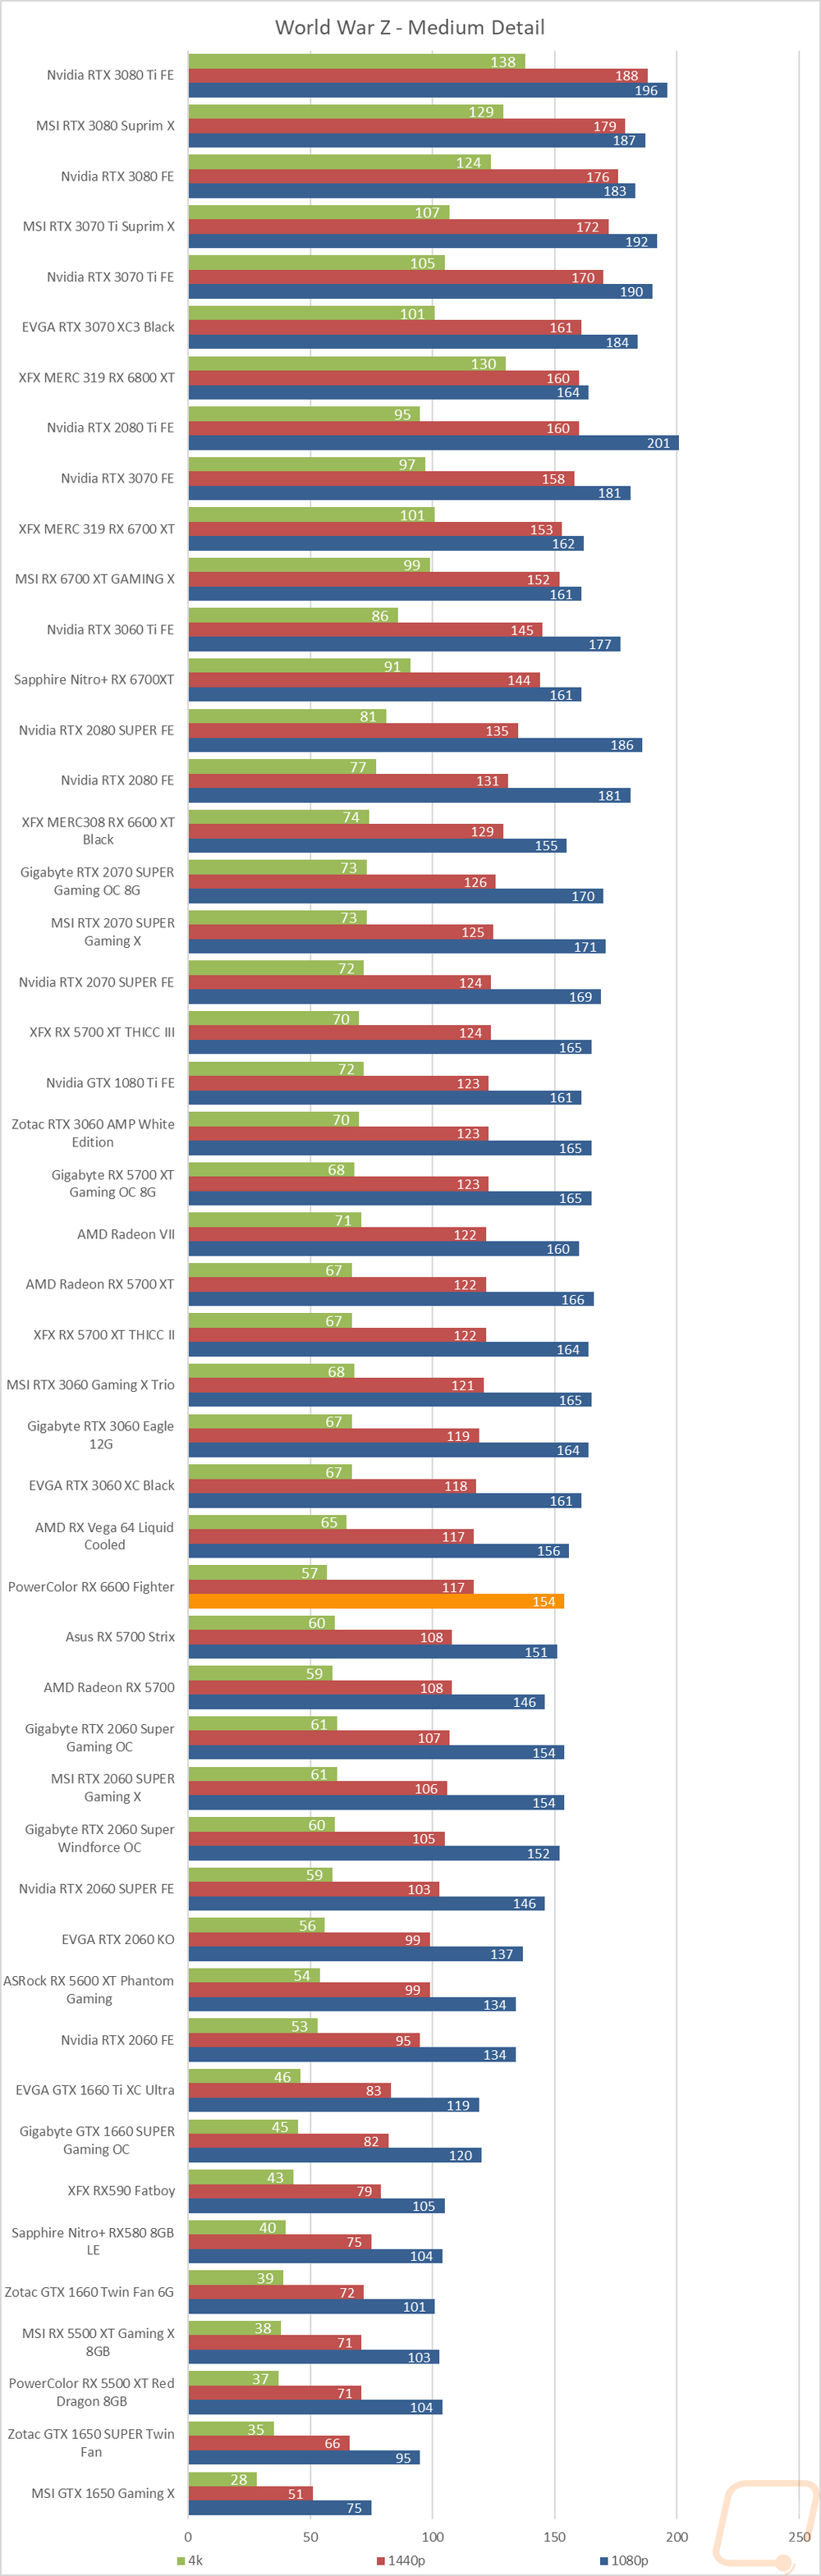
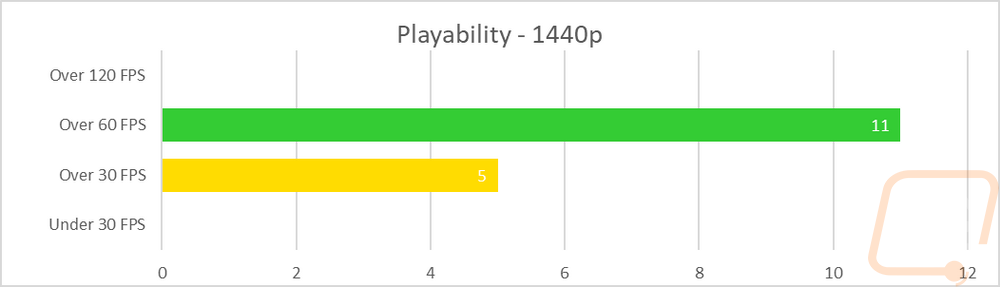
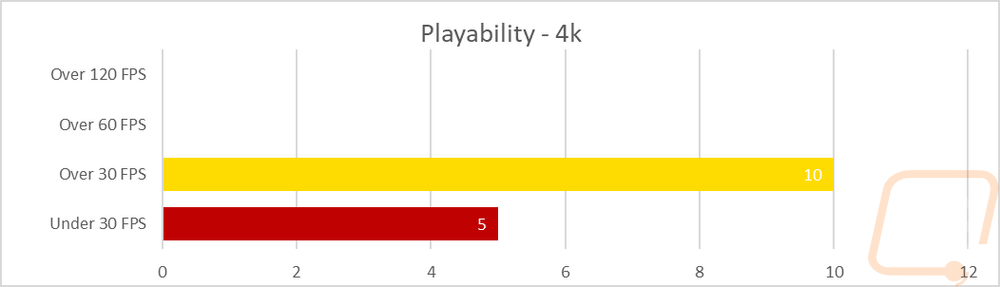
So how did the PowerColor RX 6600 Fighter do? Well AMD has the 6600 targeted right at 1080p gaming and it did well there. At 1080p four of the results were up over 120 FPS and all were at or above 60 FPS. 1440p is possible as well with none of the results being unplayable, but there were 5 that were lower than I would suggest playing. That still leaves a majority of the results up over the 60 FPS benchmark. But when things get turned up to 4k the 8GB frame buffer and the small 128-bit memory interface choke things down to a crawl with none of the tests reaching 60 FPS and 2/3 of those were unplayable at under 30 FPS.
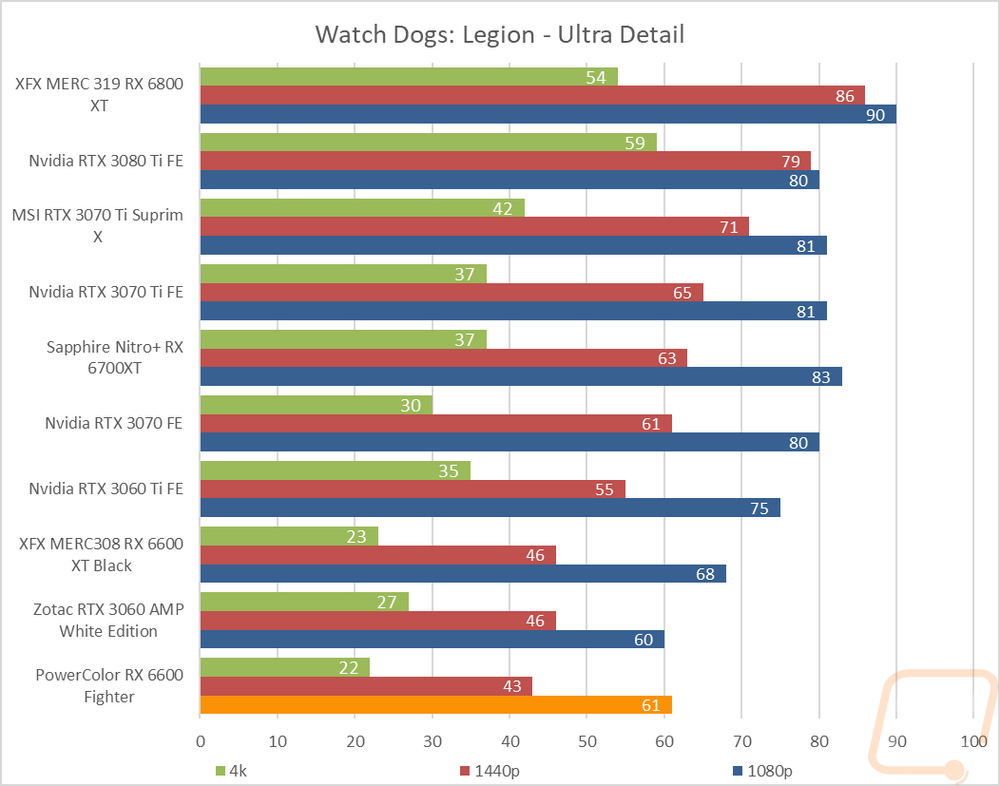
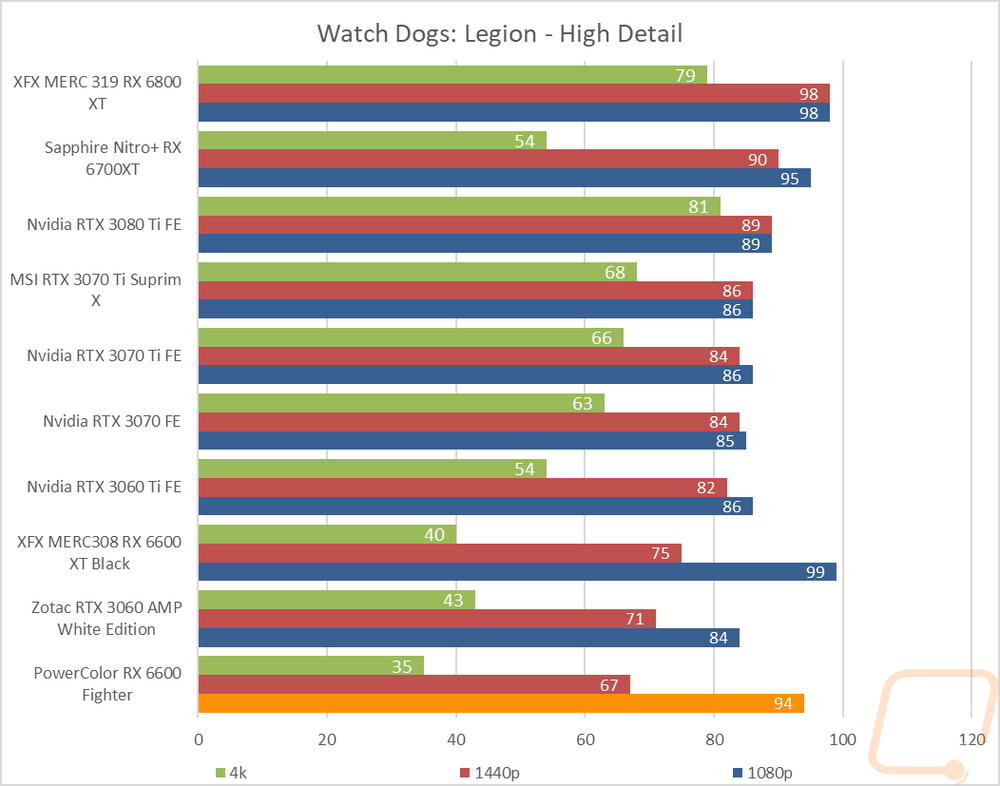
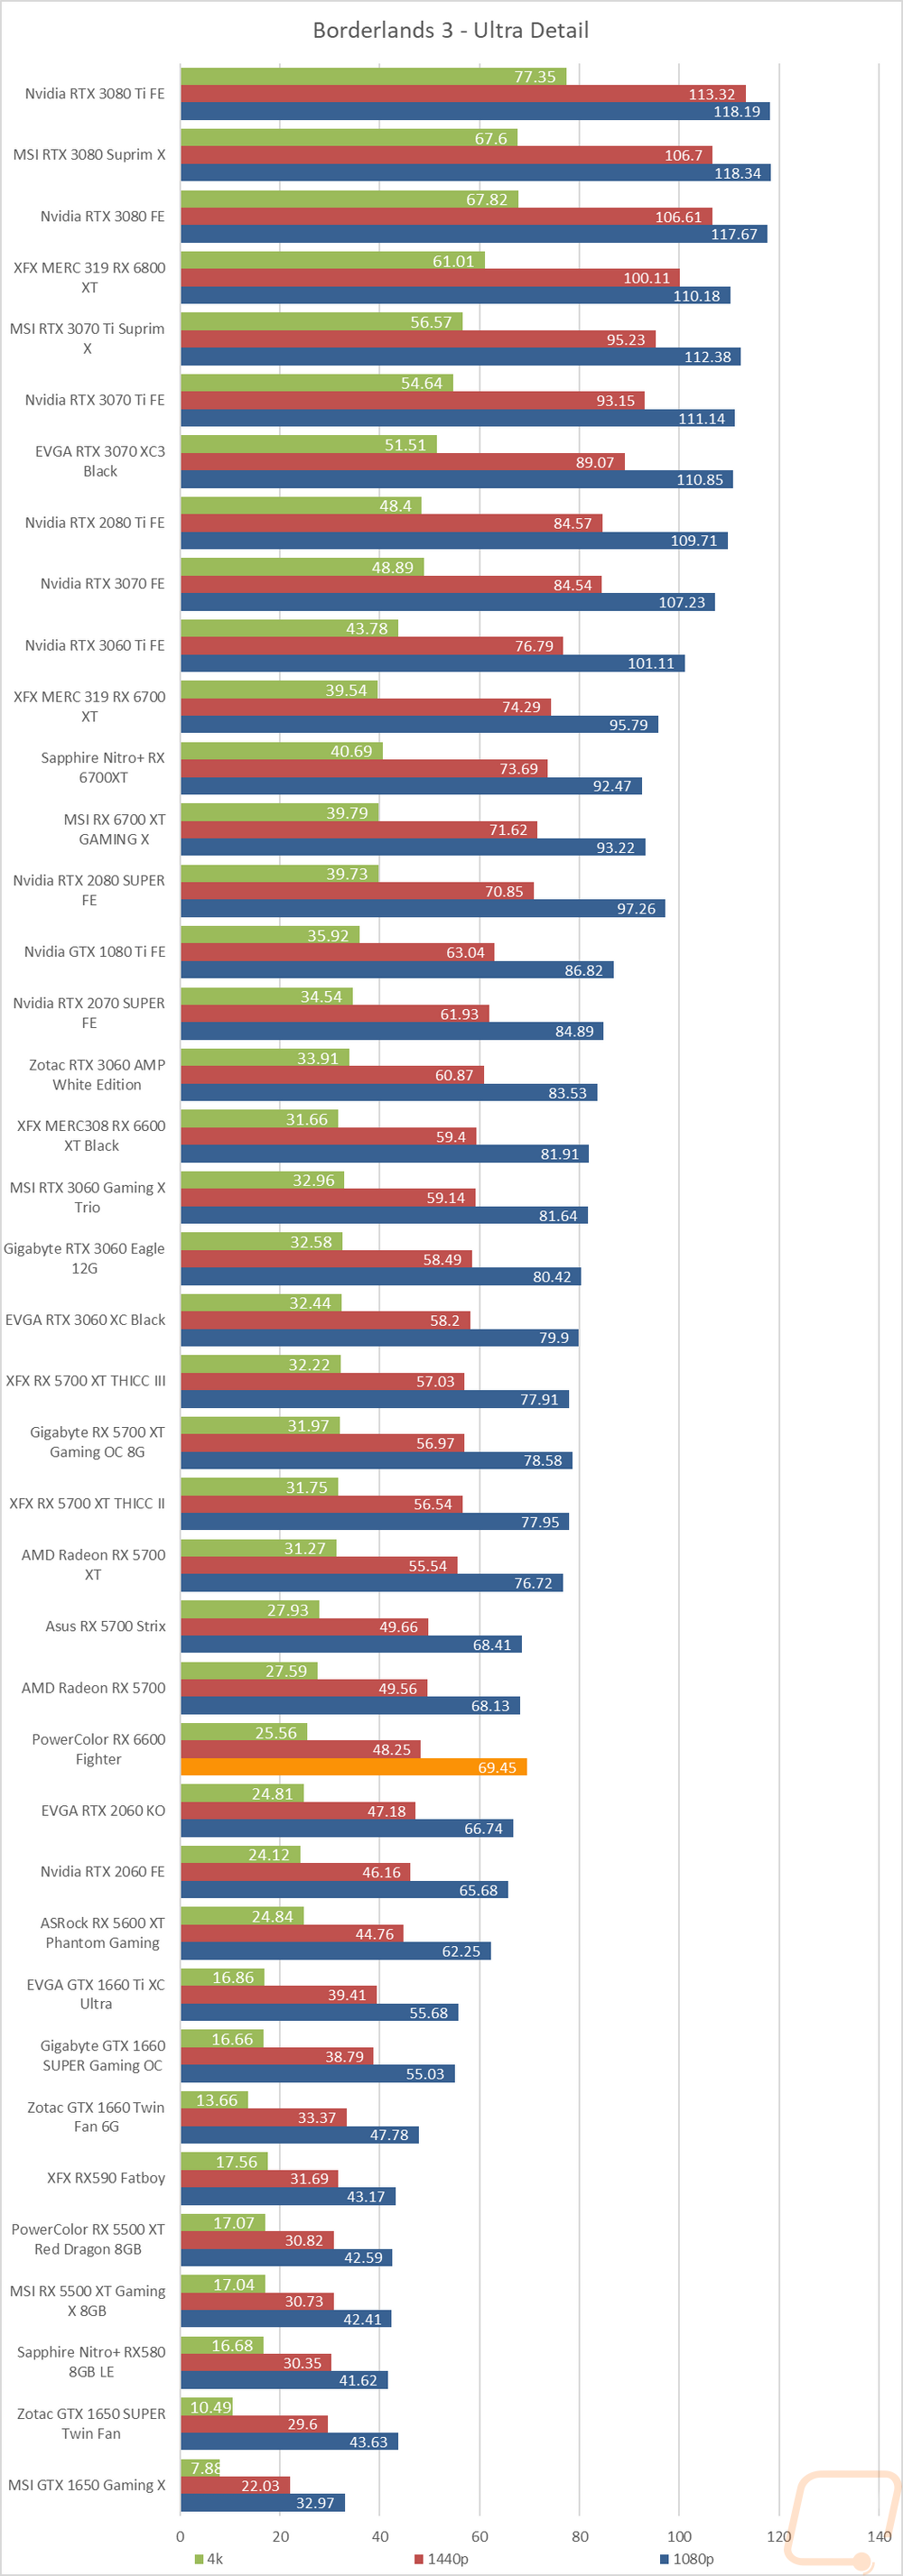
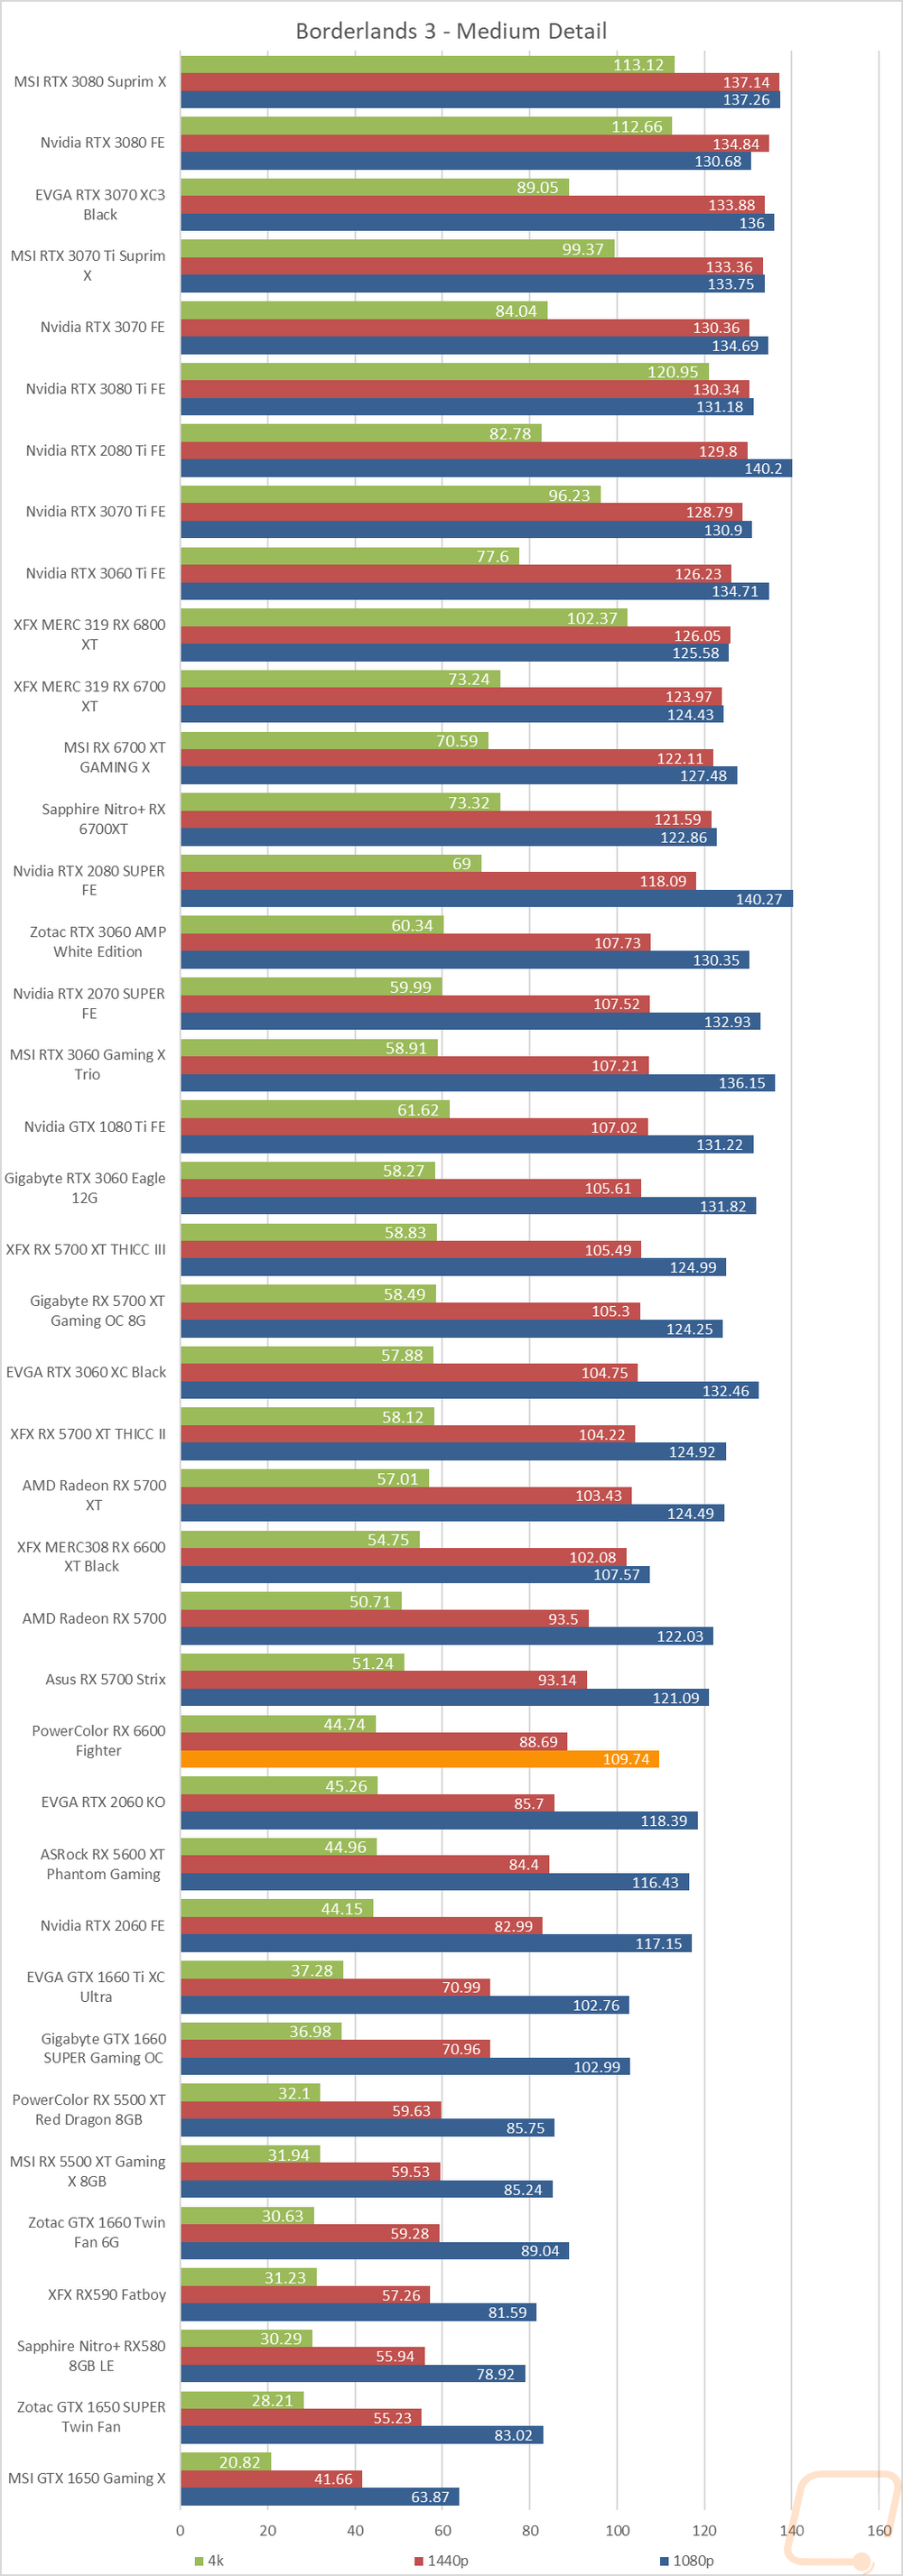
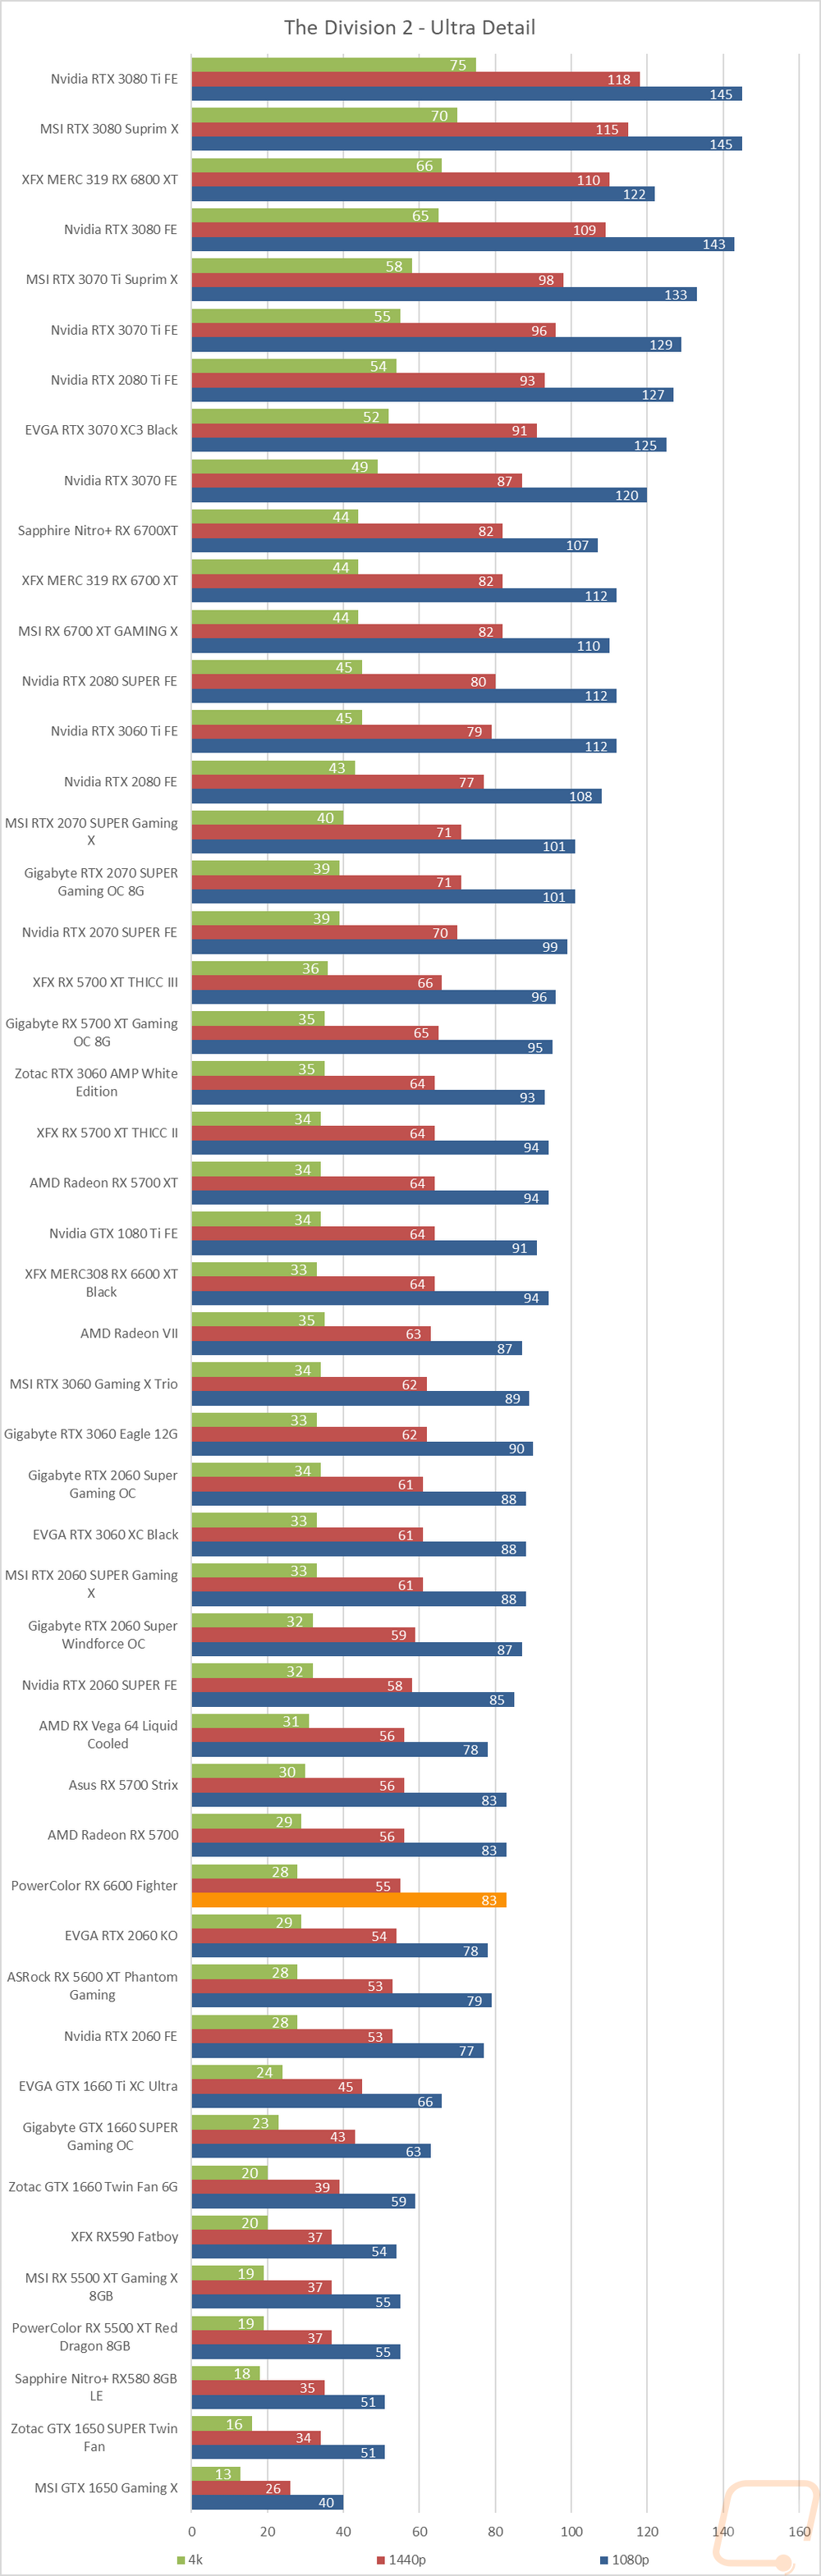
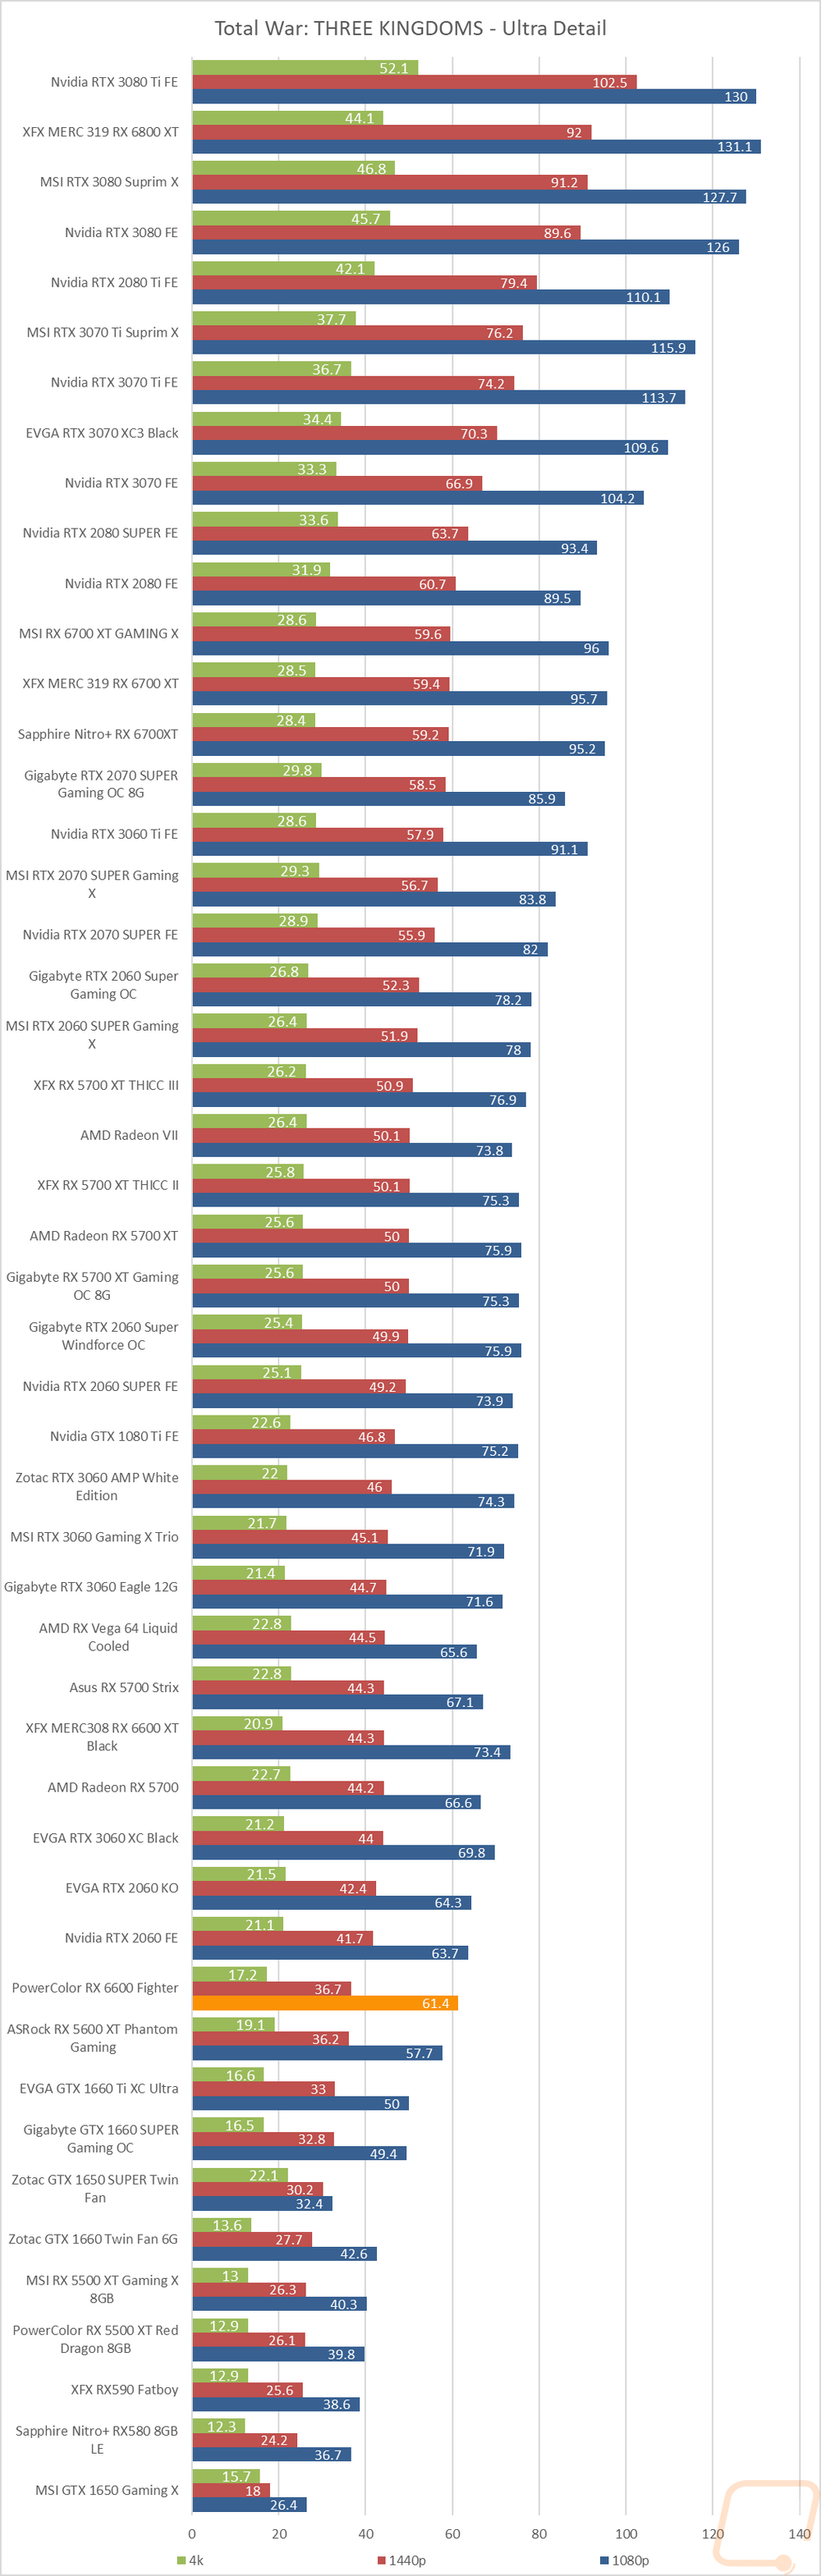
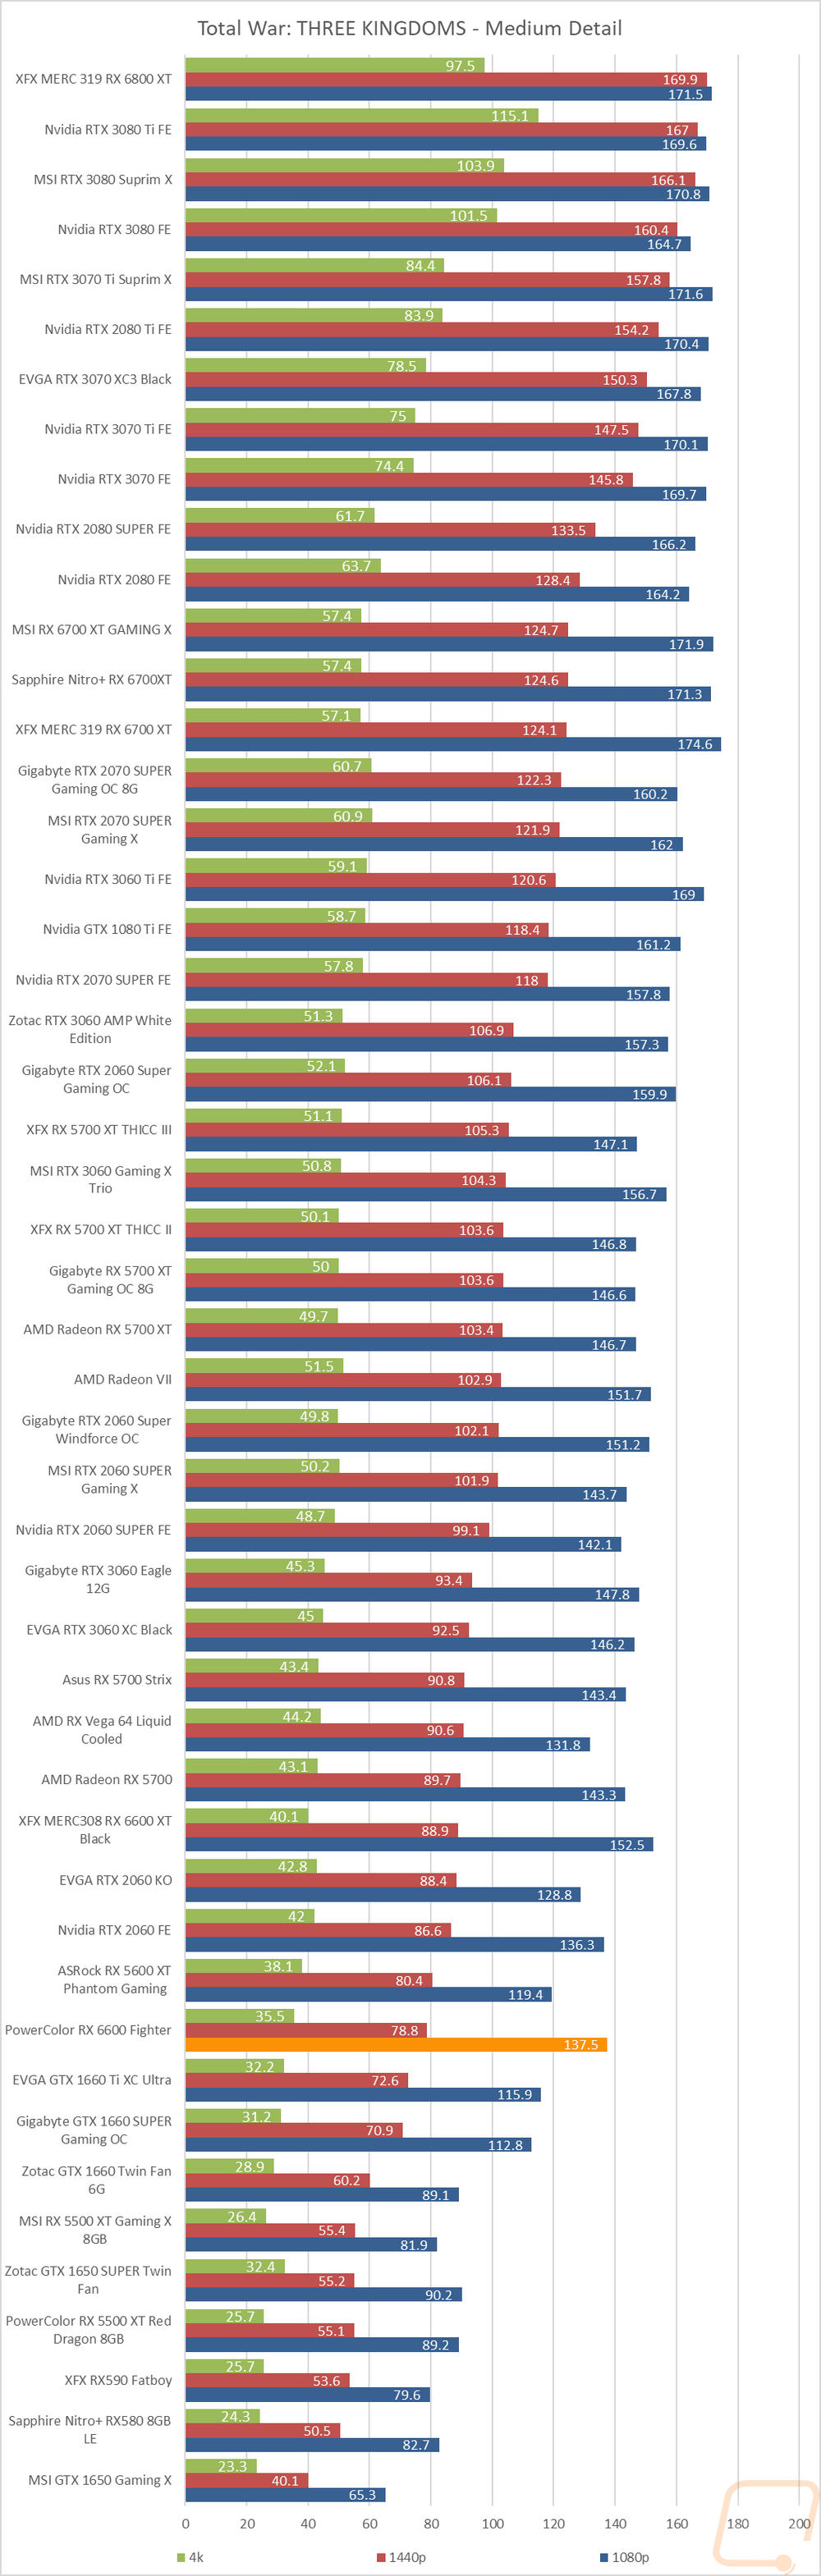
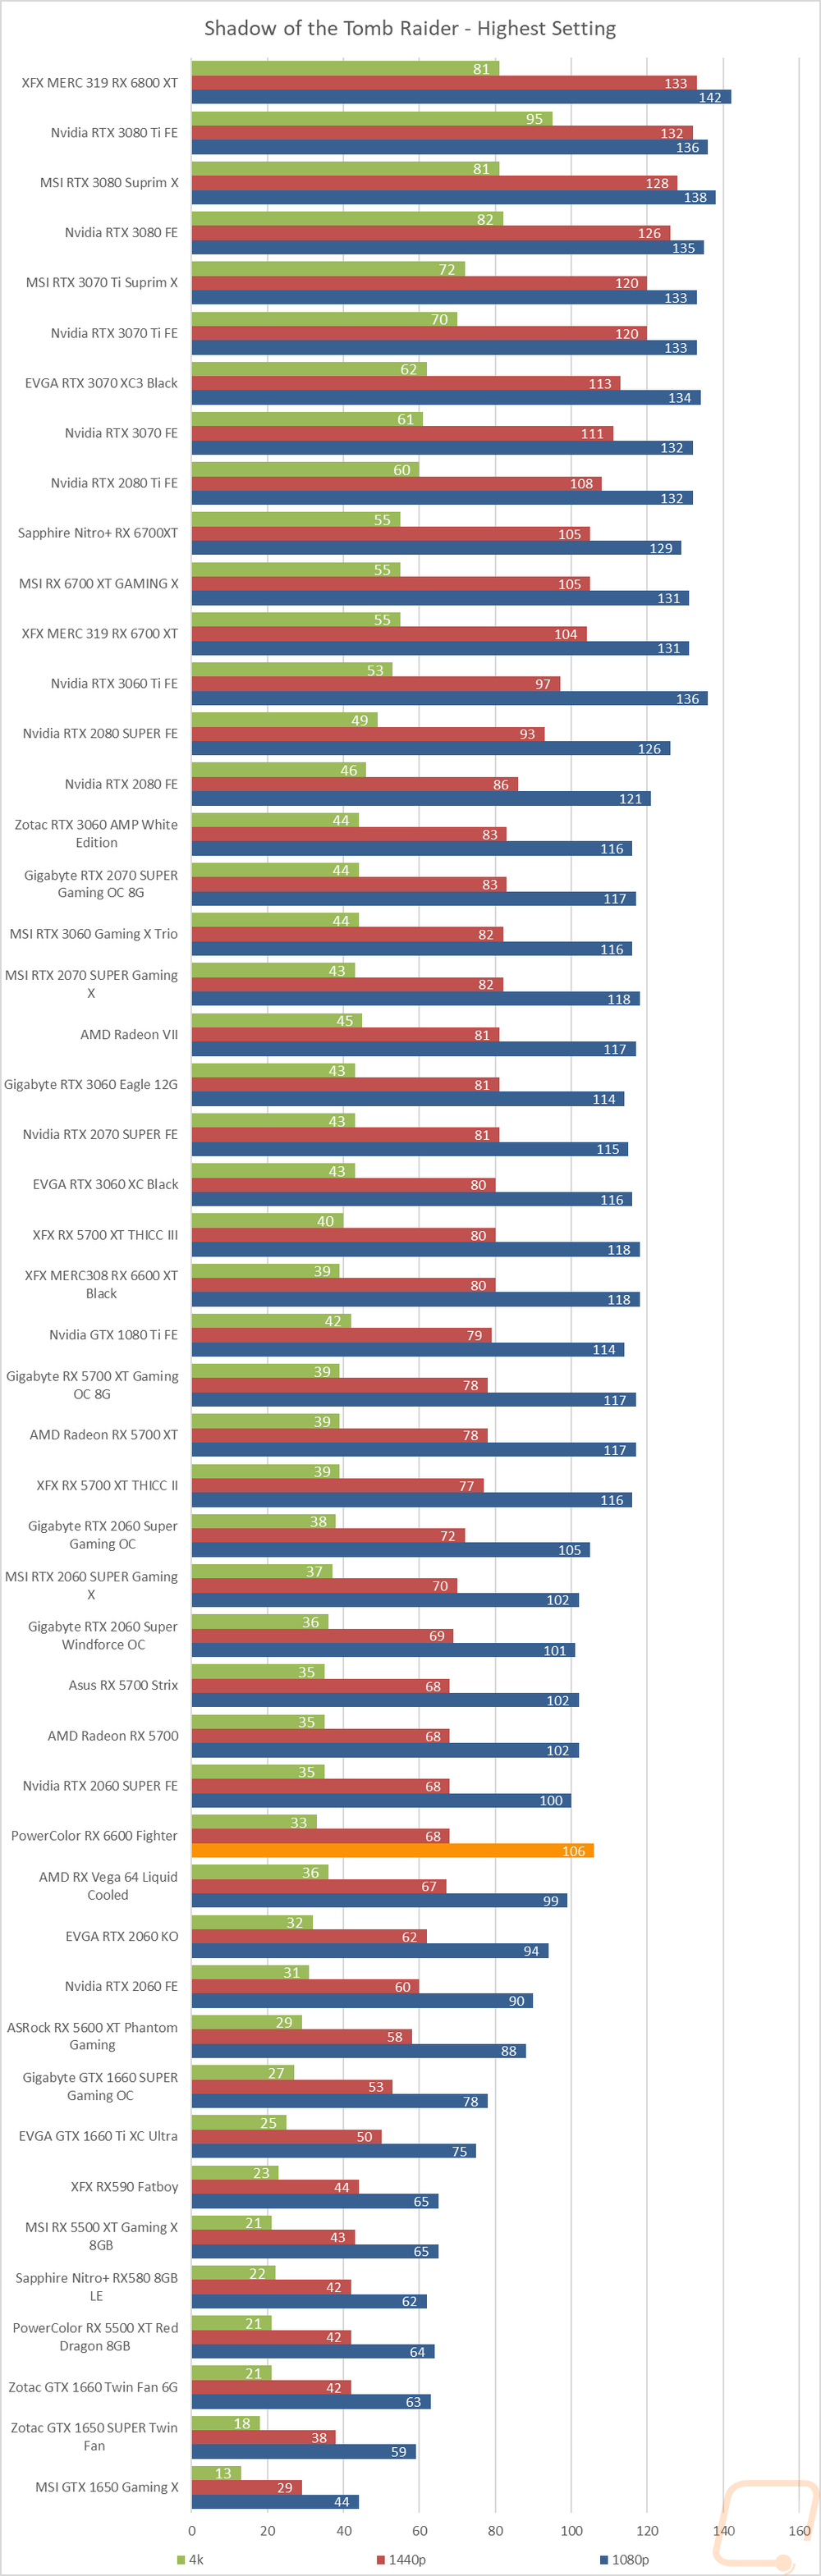
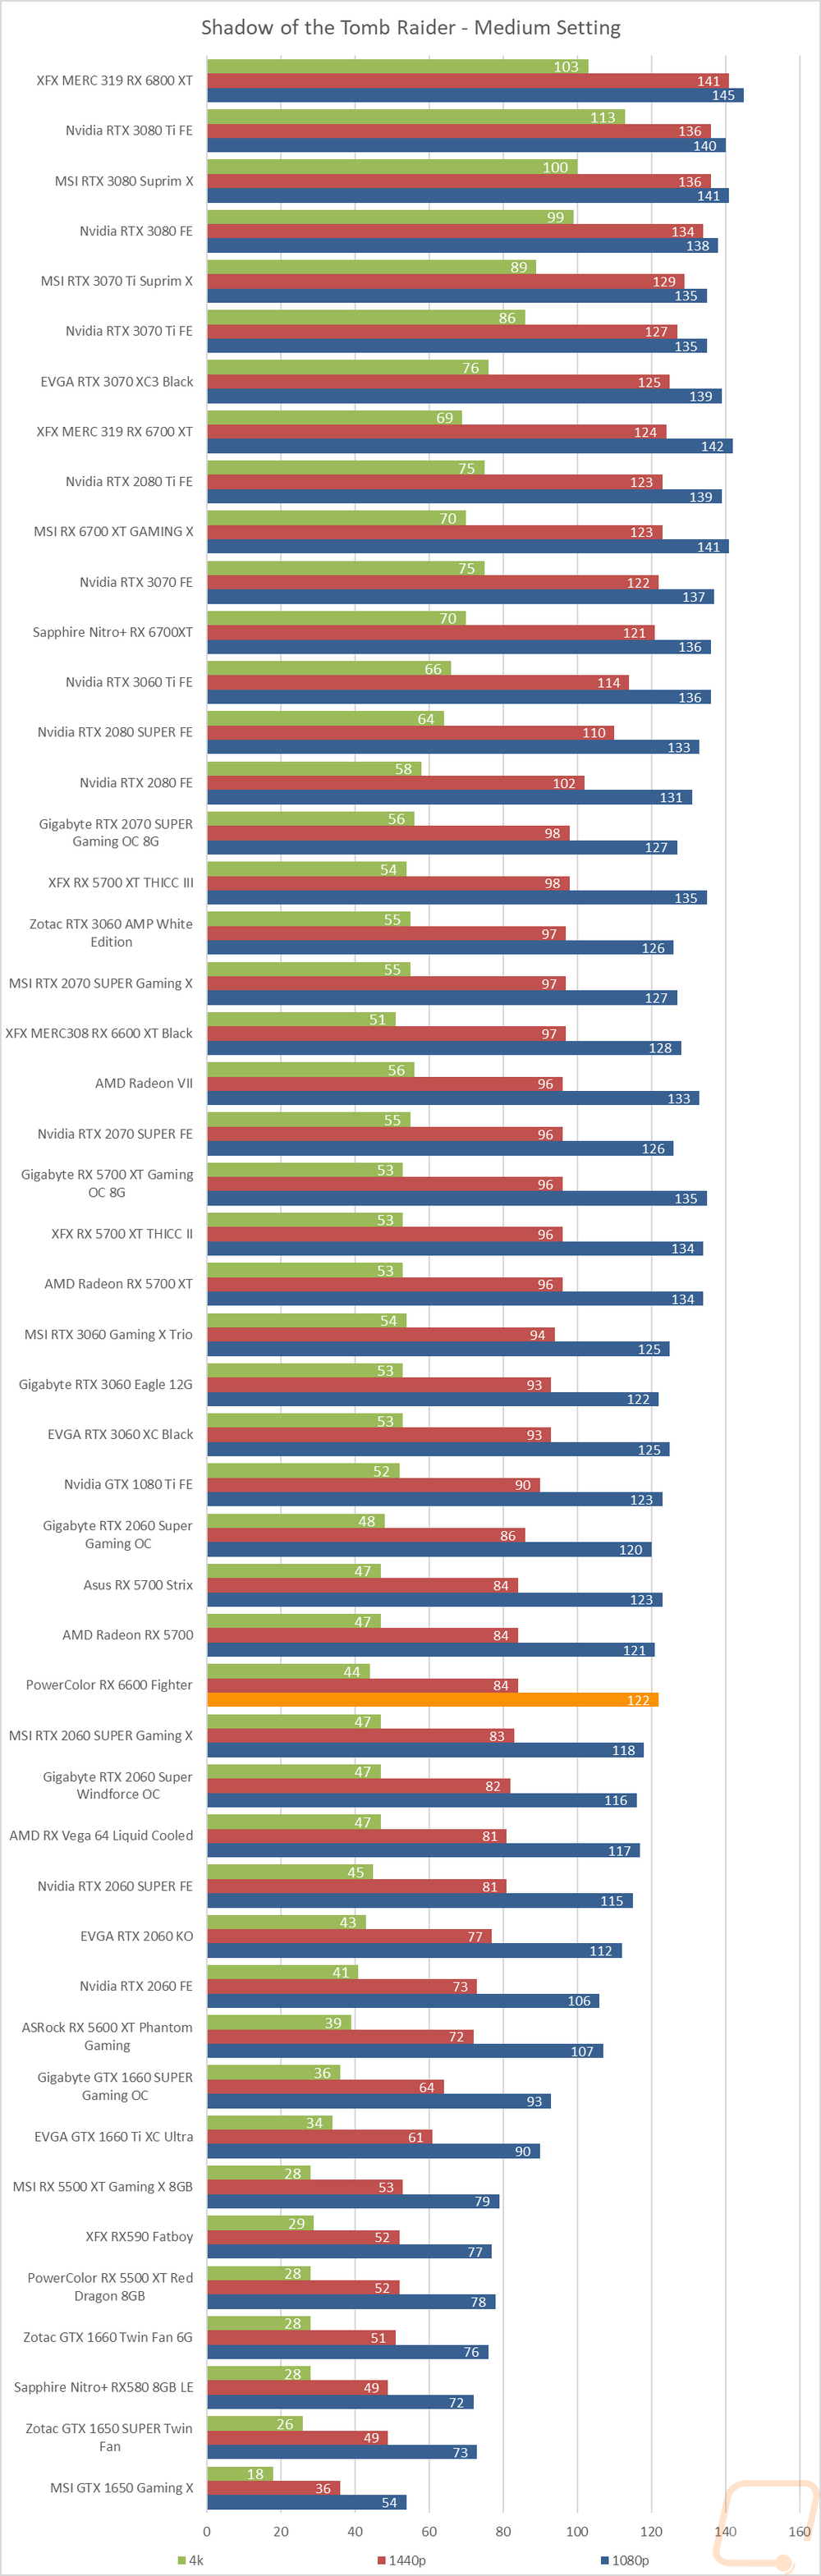
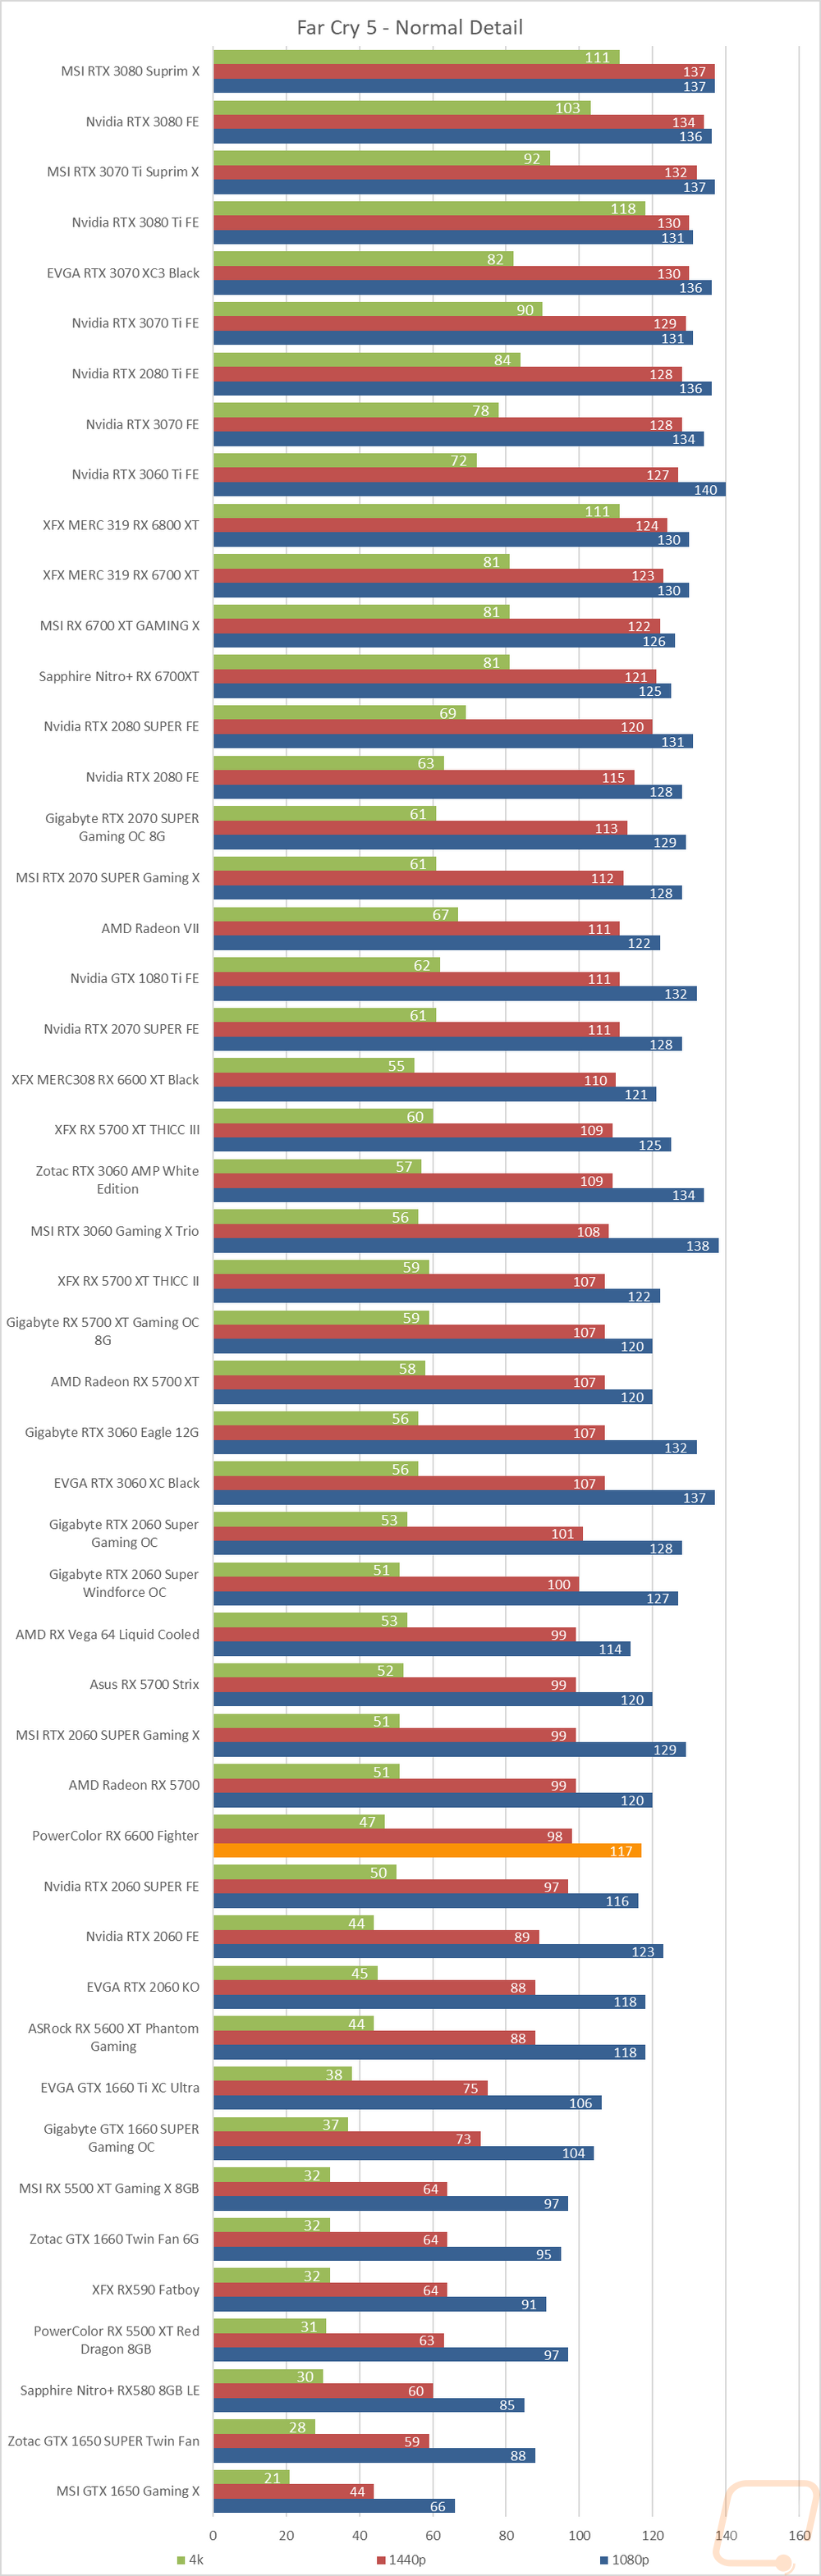
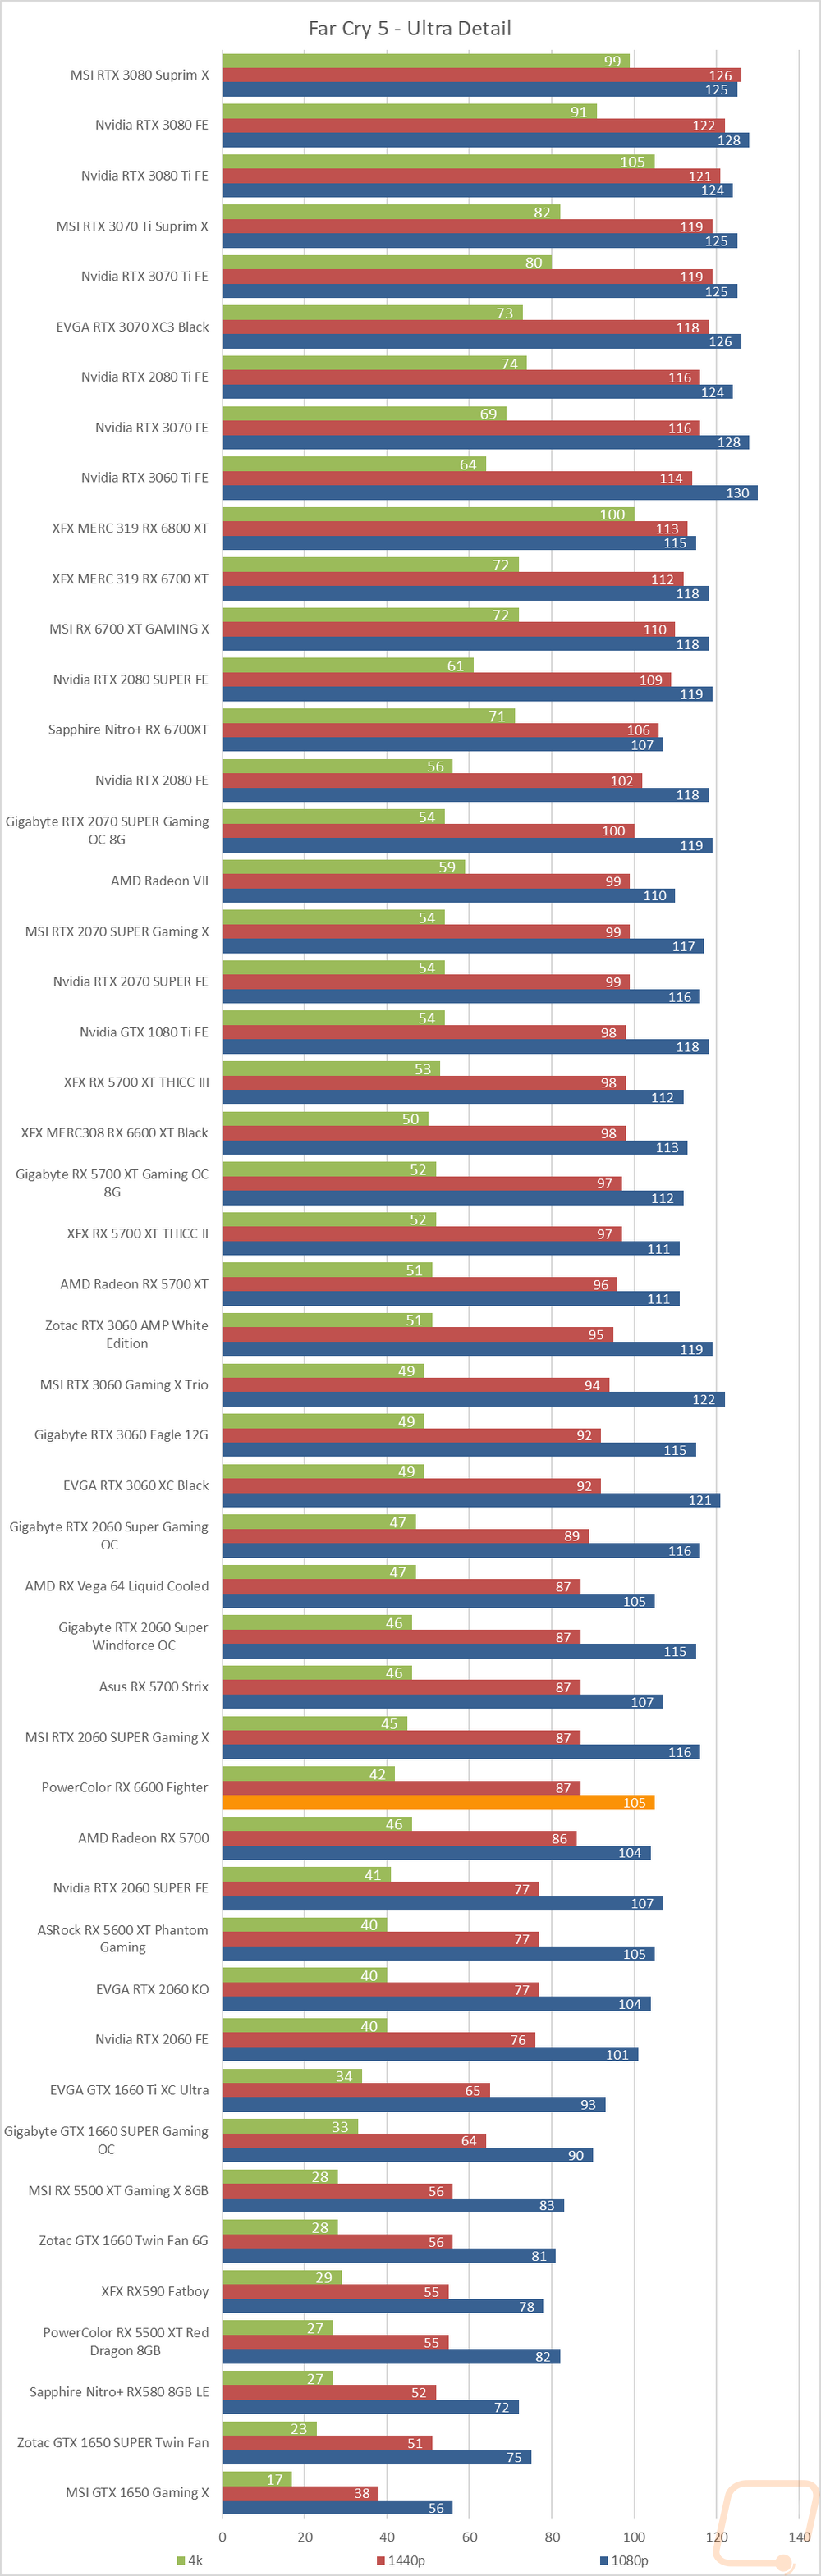
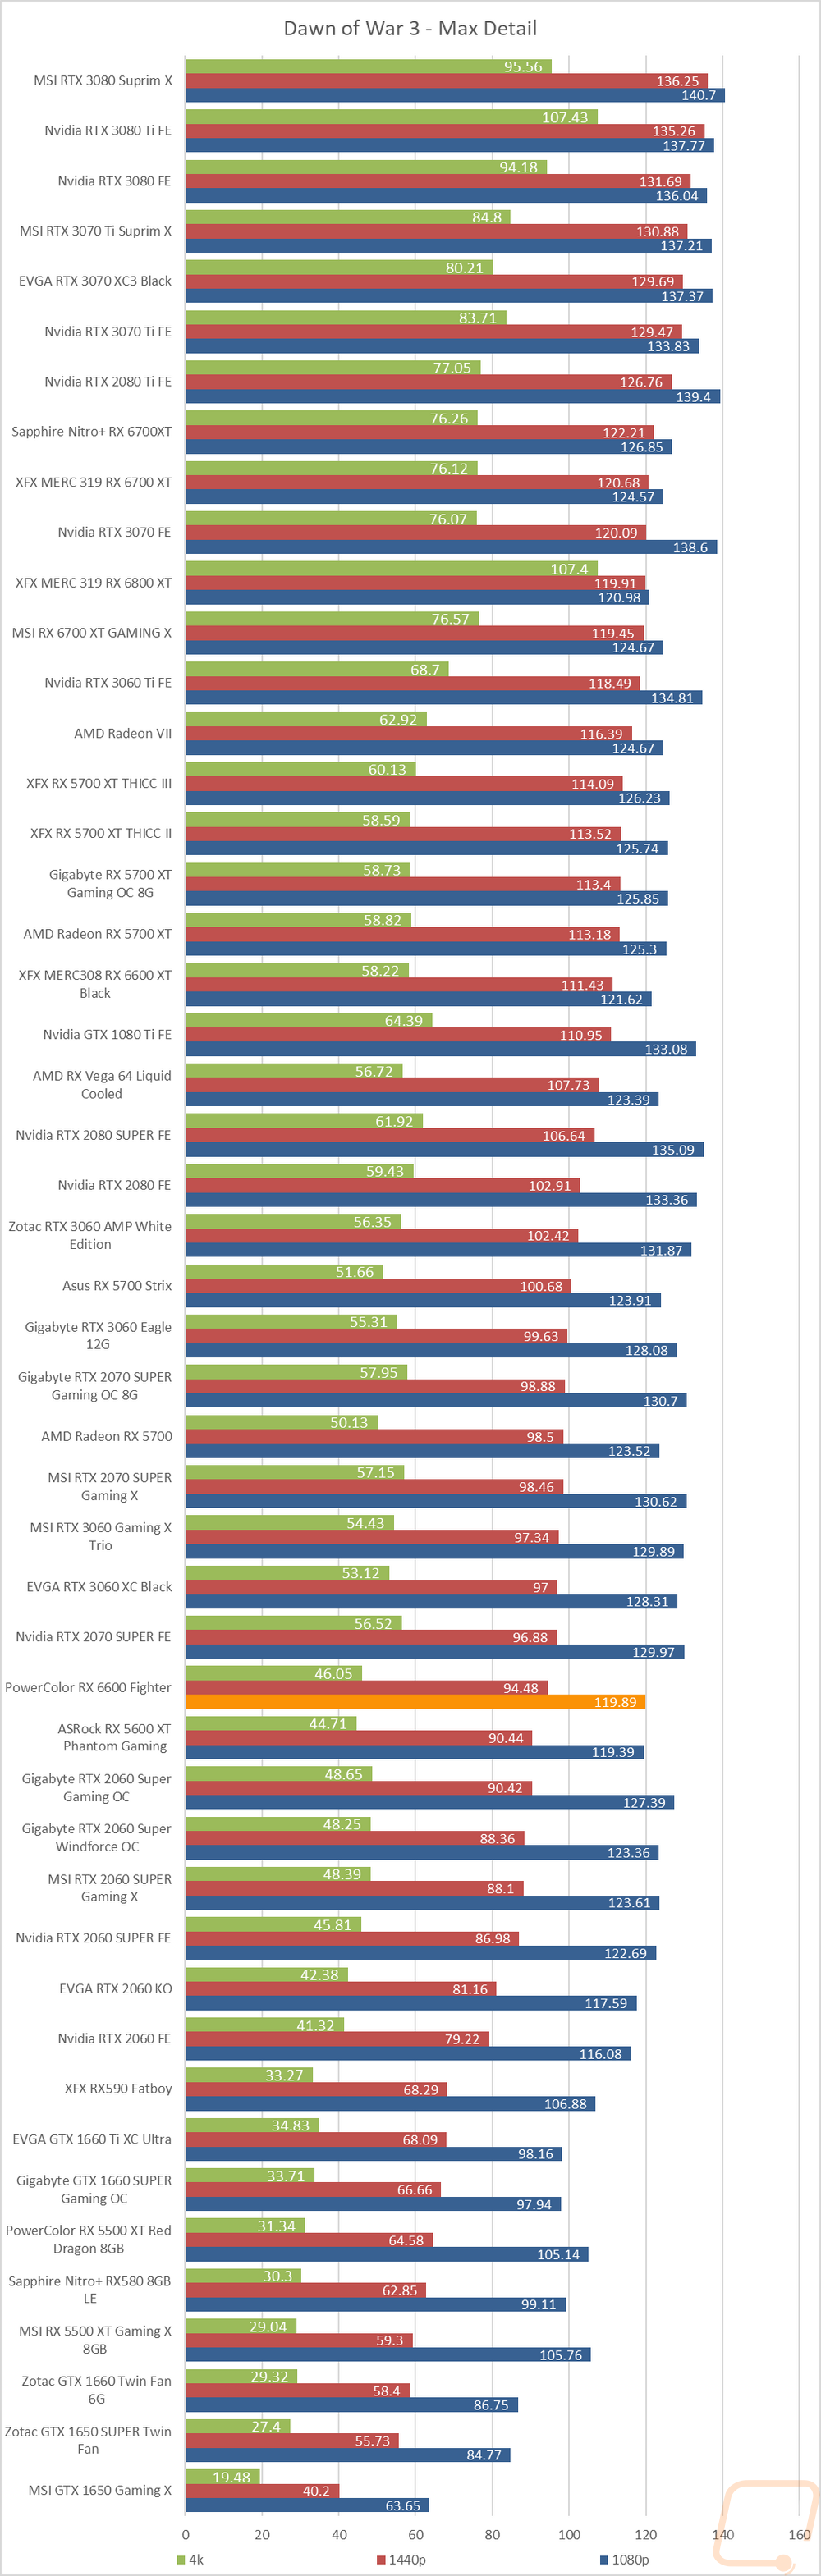
Of course, I have all of the actual in game results as well for anyone who wants to sort through the wall of graphs below. For starters, I should point out that these graphs are sorted by the 1440p results but I am focused the most on the 1080p results. The highest ends cards get a little flat at 1080p as they get CPU limited, sorting by 1080p can make for some confusing results when you see cards like the 3080 Ti on par with cards that cost half as much. The first results in Watch Dogs for example show that the PowerColor RX 6600 Fighter is a few FPS behind the RTX 3060 at 1440p, but the PowerColor RX 6600 Fighter is faster at 1080p, the AMD cards perform a lot better at 1080 in Watch Dogs. But the performance gap between the 6600 and the 6600 XT is also really clear, especially in those early tests. Diving in more we see a lot of the same things that we saw in the synthetics. The PowerColor RX 6600 Fighter stays out ahead of the RTX 2060 and trades blows with the RX 5700 but stays behind the RTX 3060. There are a few exceptions like in Total War where it comes in behind the RTX 2060. In Shadow of the Tomb Raider, it is even running right with the RTX 2060 SUPERs.