Cooling Noise and Power
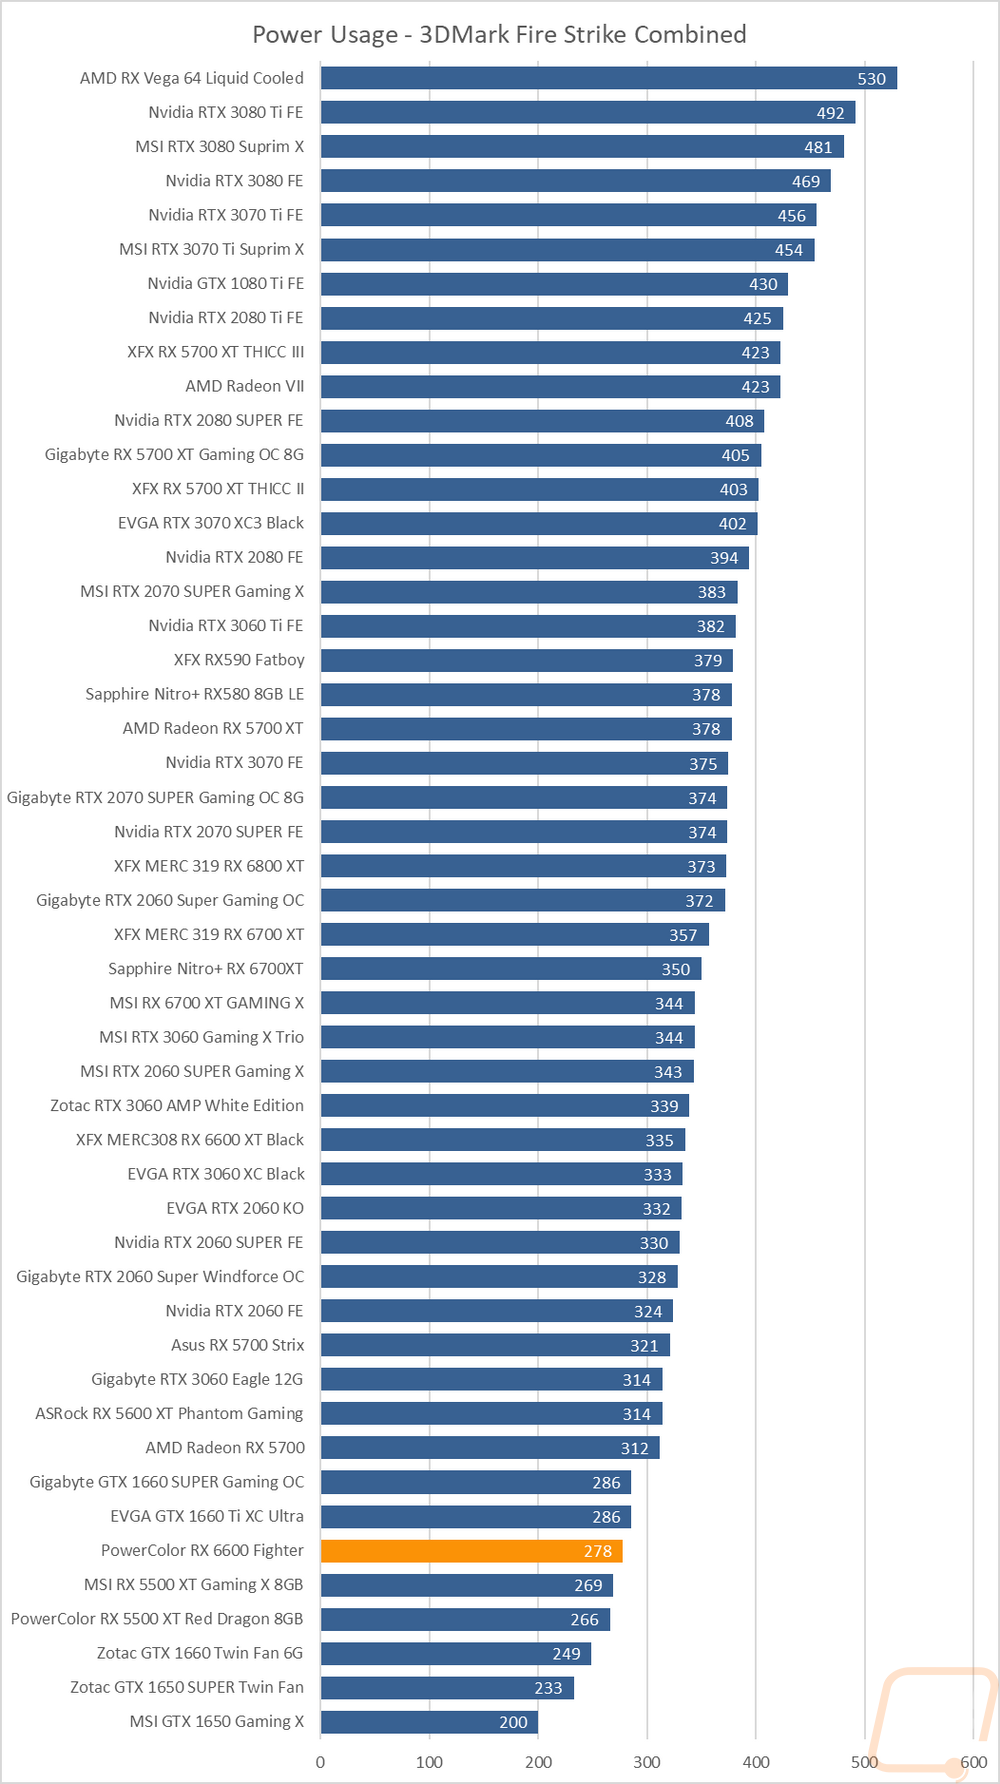
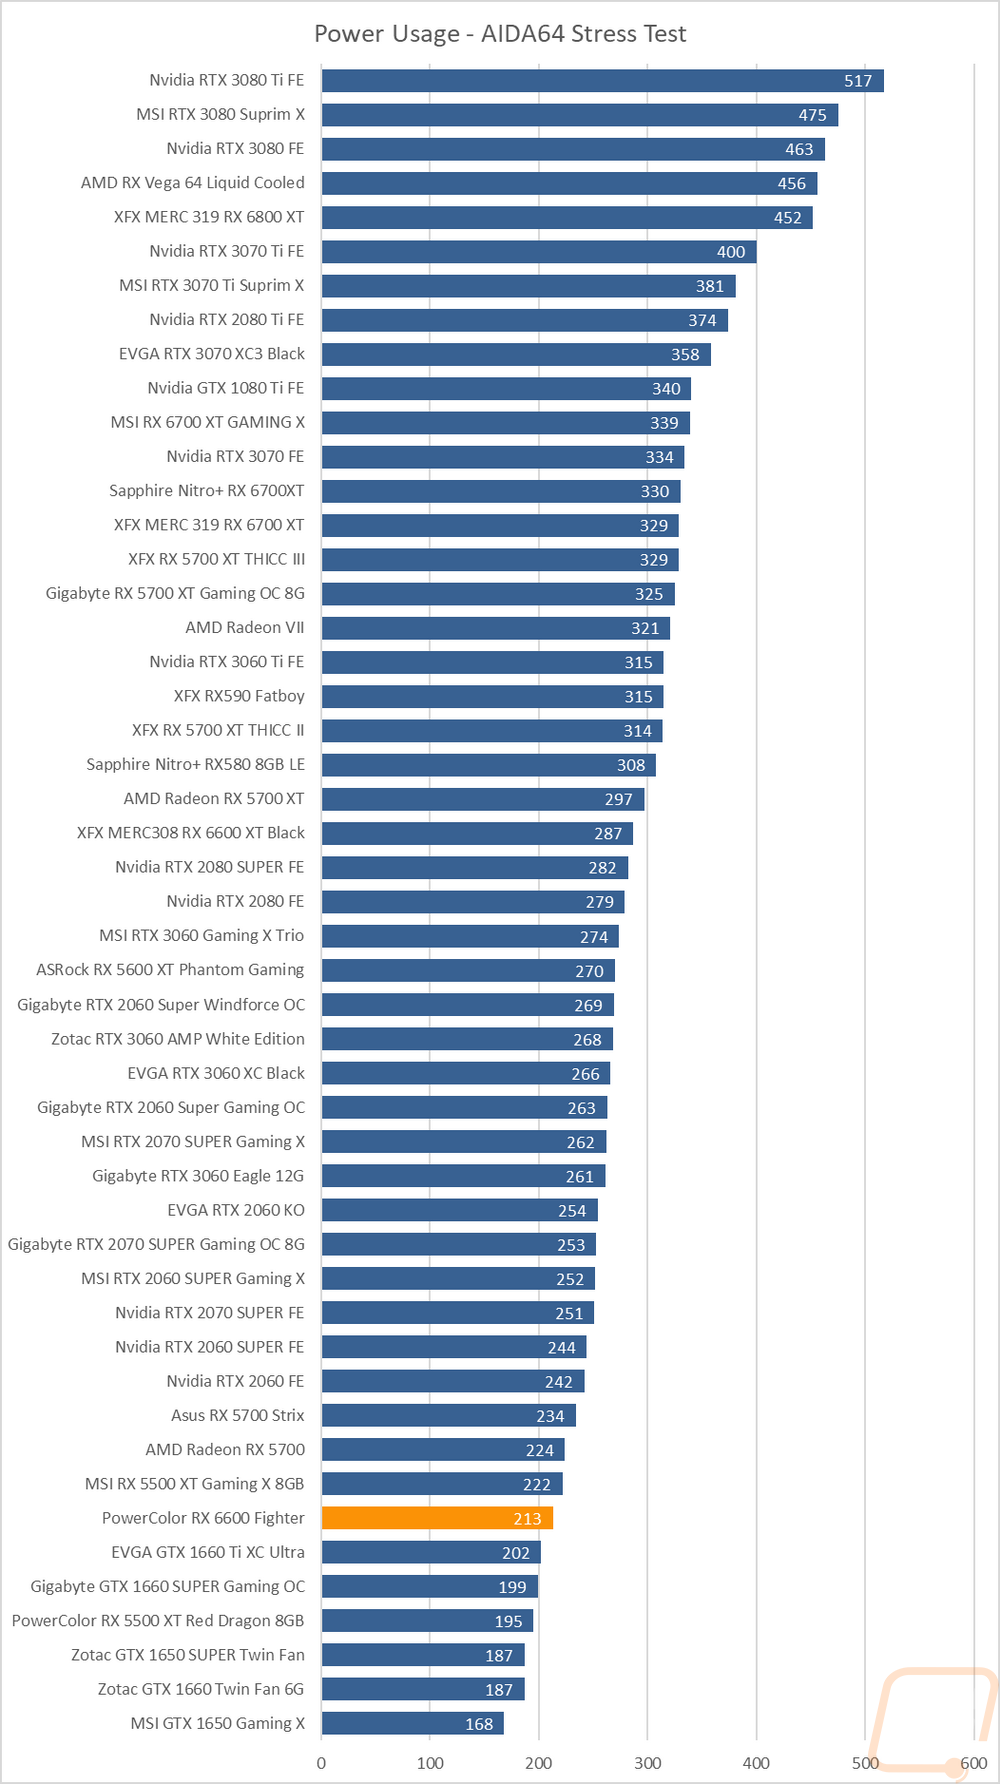
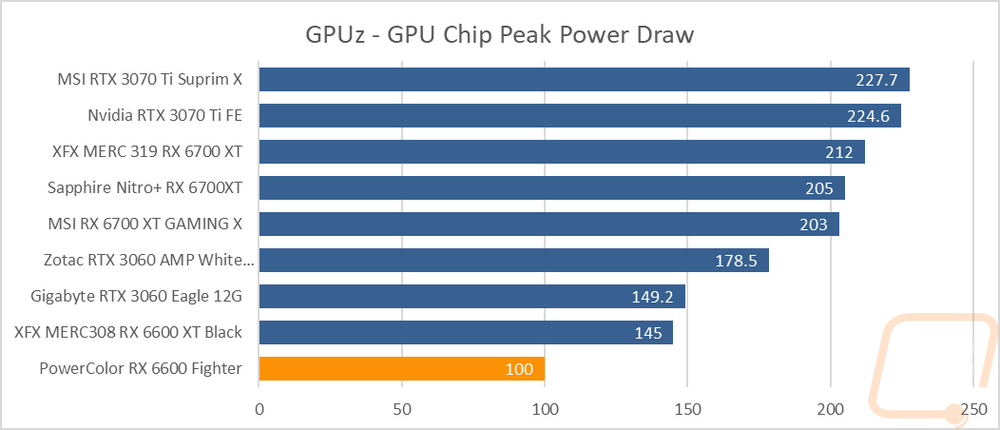
For my last few tests, rather than focusing on in game performance, I like to check out other aspects of performance. These are also the most important ways to differentiate the performance between cards that have the same GPU. To start things off I took a look at power usage. For this, I use our Kill-A-Watt hooked up to the test bench to record the total wattage of the system. I ran two tests with the first using 3DMark Fire Strike to put the system under a load similar to normal in game performance. Here our test system with the PowerColor RX 6600 Fighter pulled a total of 278 watts which was 43 watts lower than even the RX 5700 and 57 below the RX 6600 XT which has the same GPU with more cores and a higher clock speed. With the AIDA64 stress test and without the CPU being loaded that number dropped down to 213 which was 116 watts lower than the overclocked 6600 XT that I tested. Then back to 3DMark again using GPUz we could see that the peak power draw on the chip was registering at a solid 100 watts when under load, only 45 less than the 6600 XT.
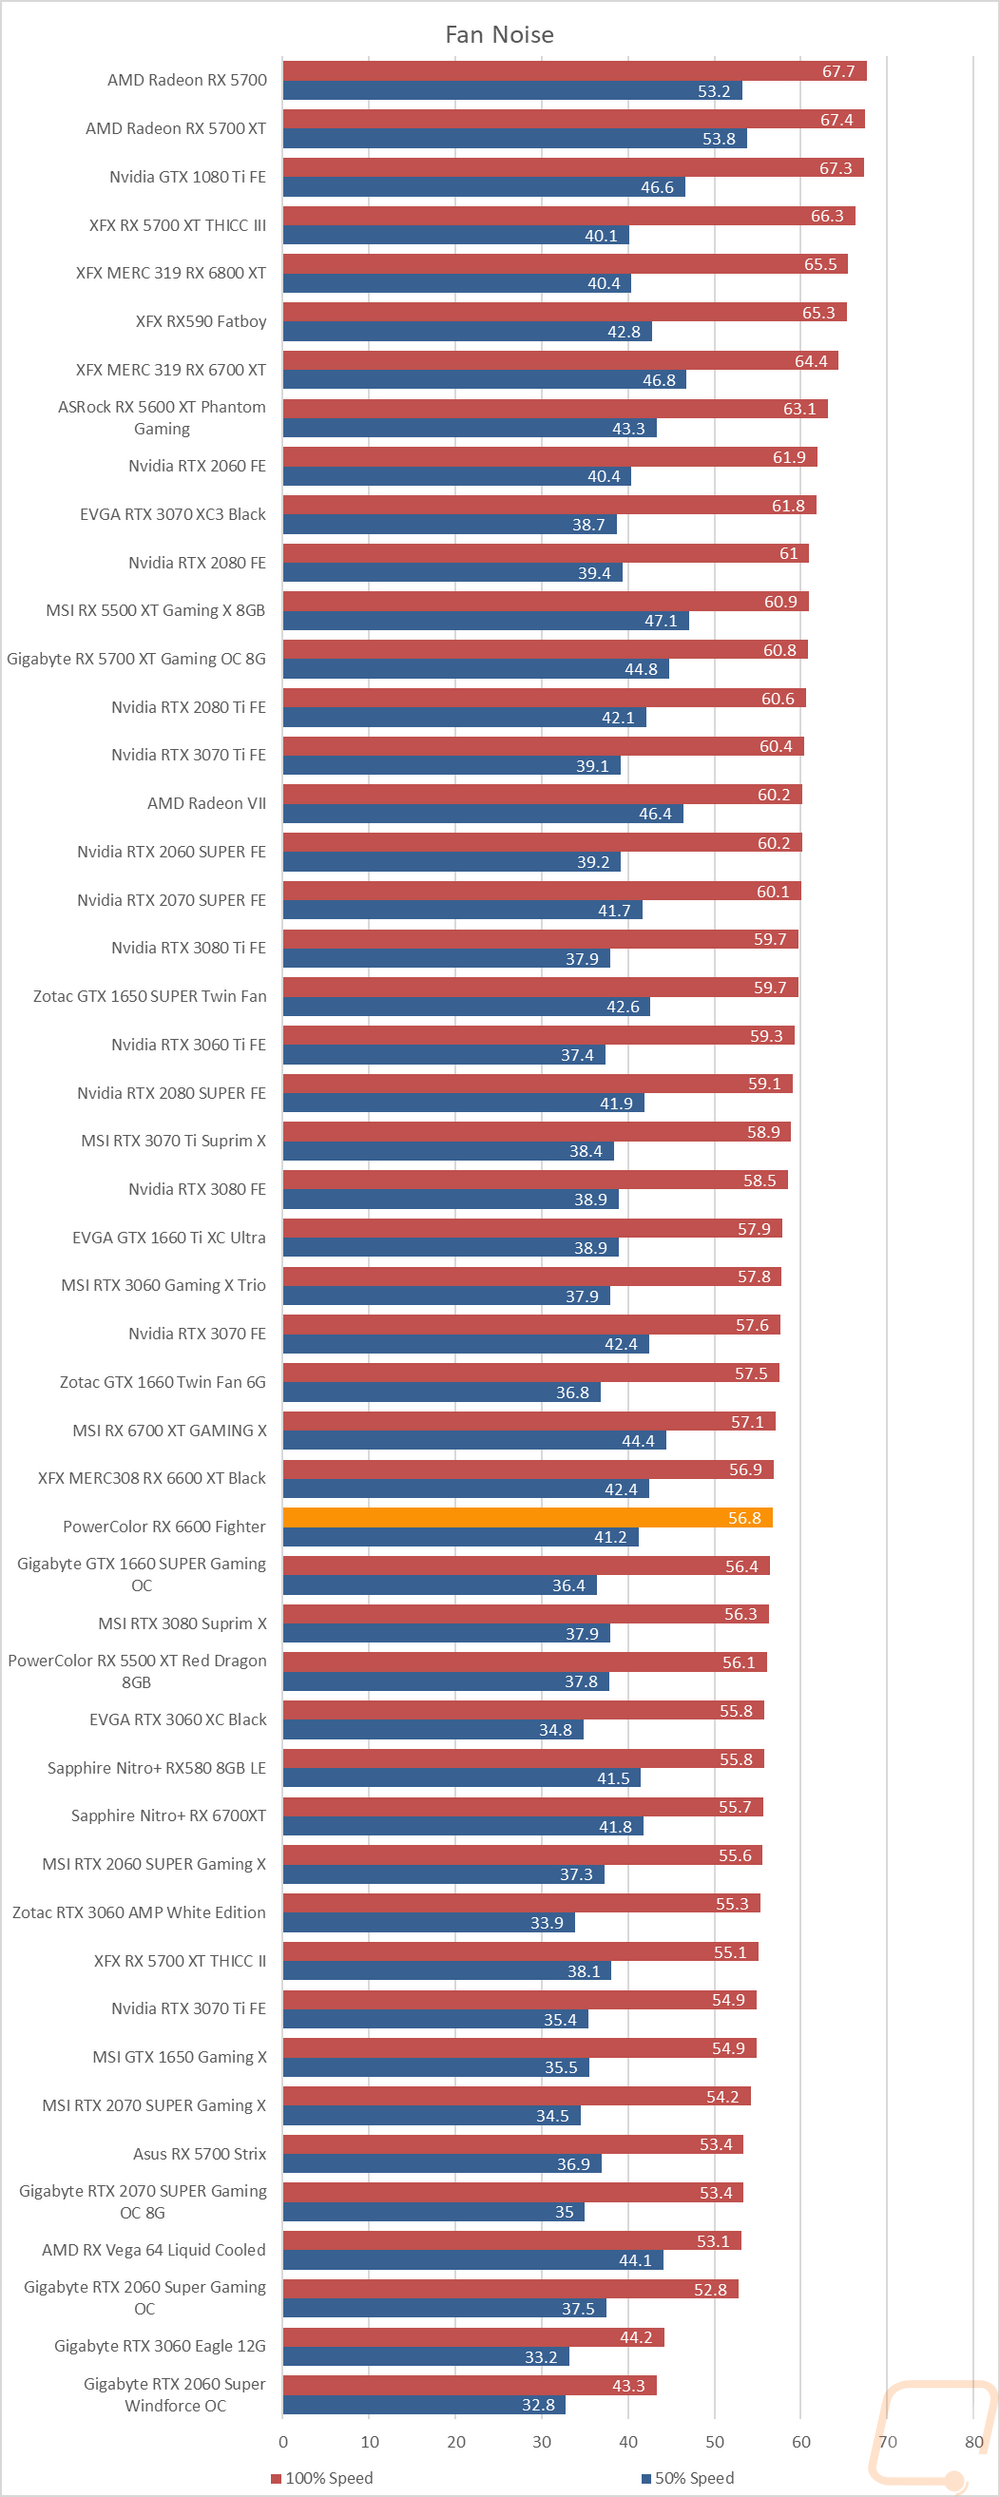
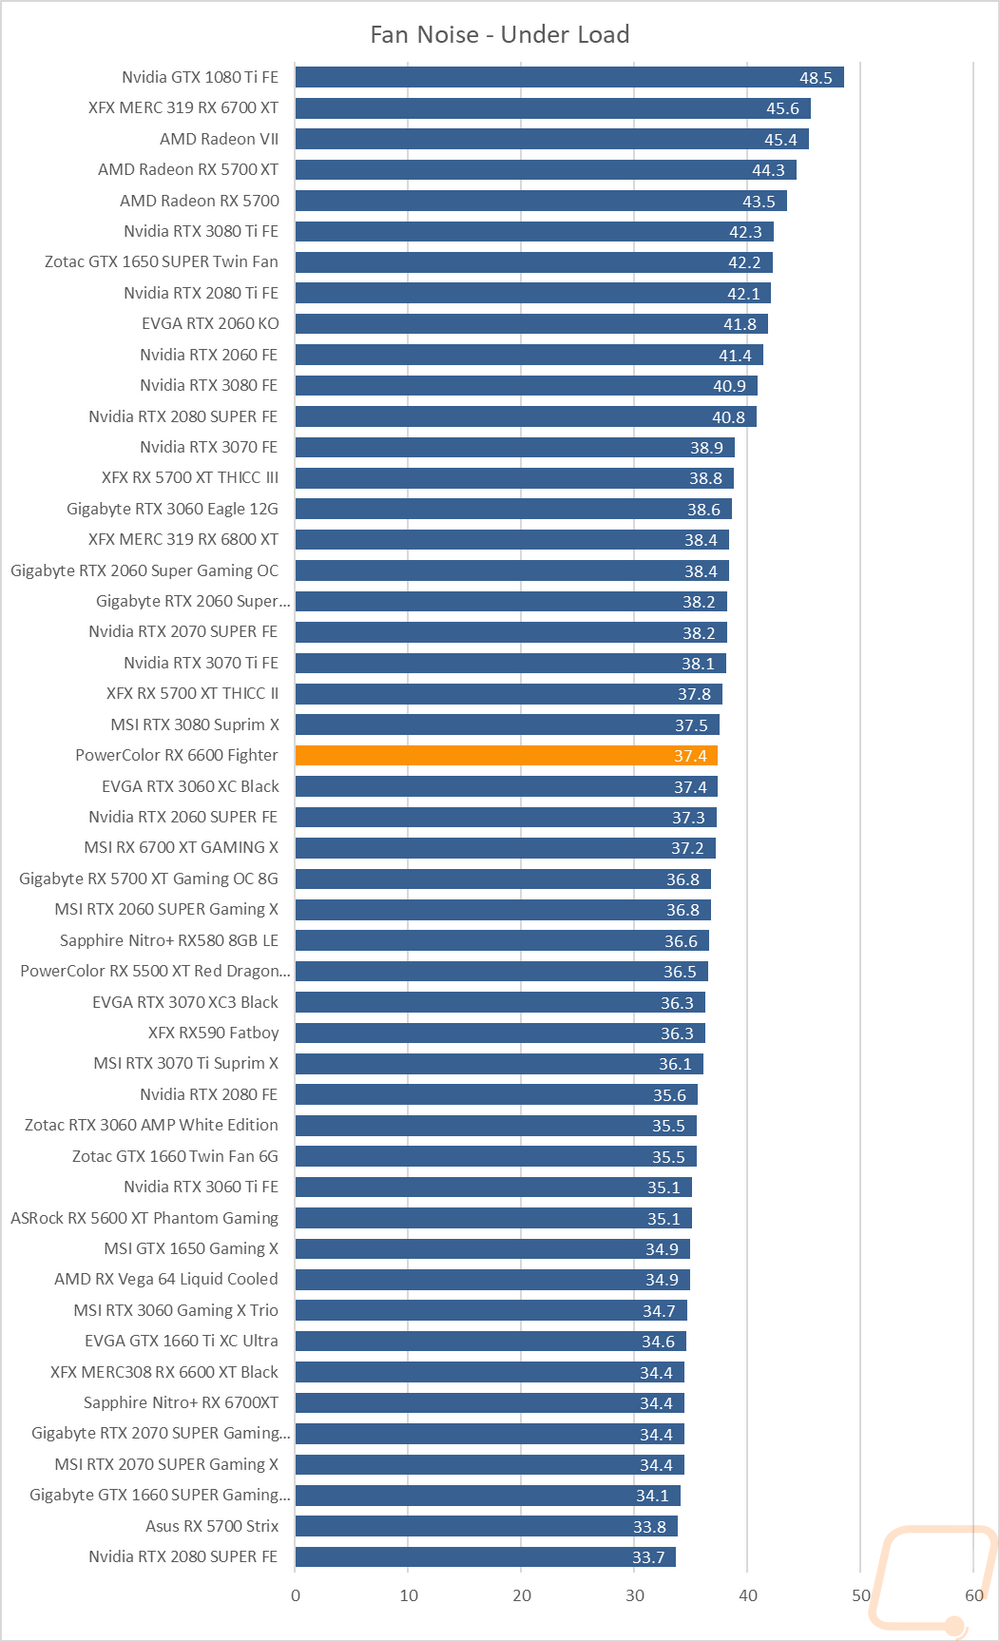
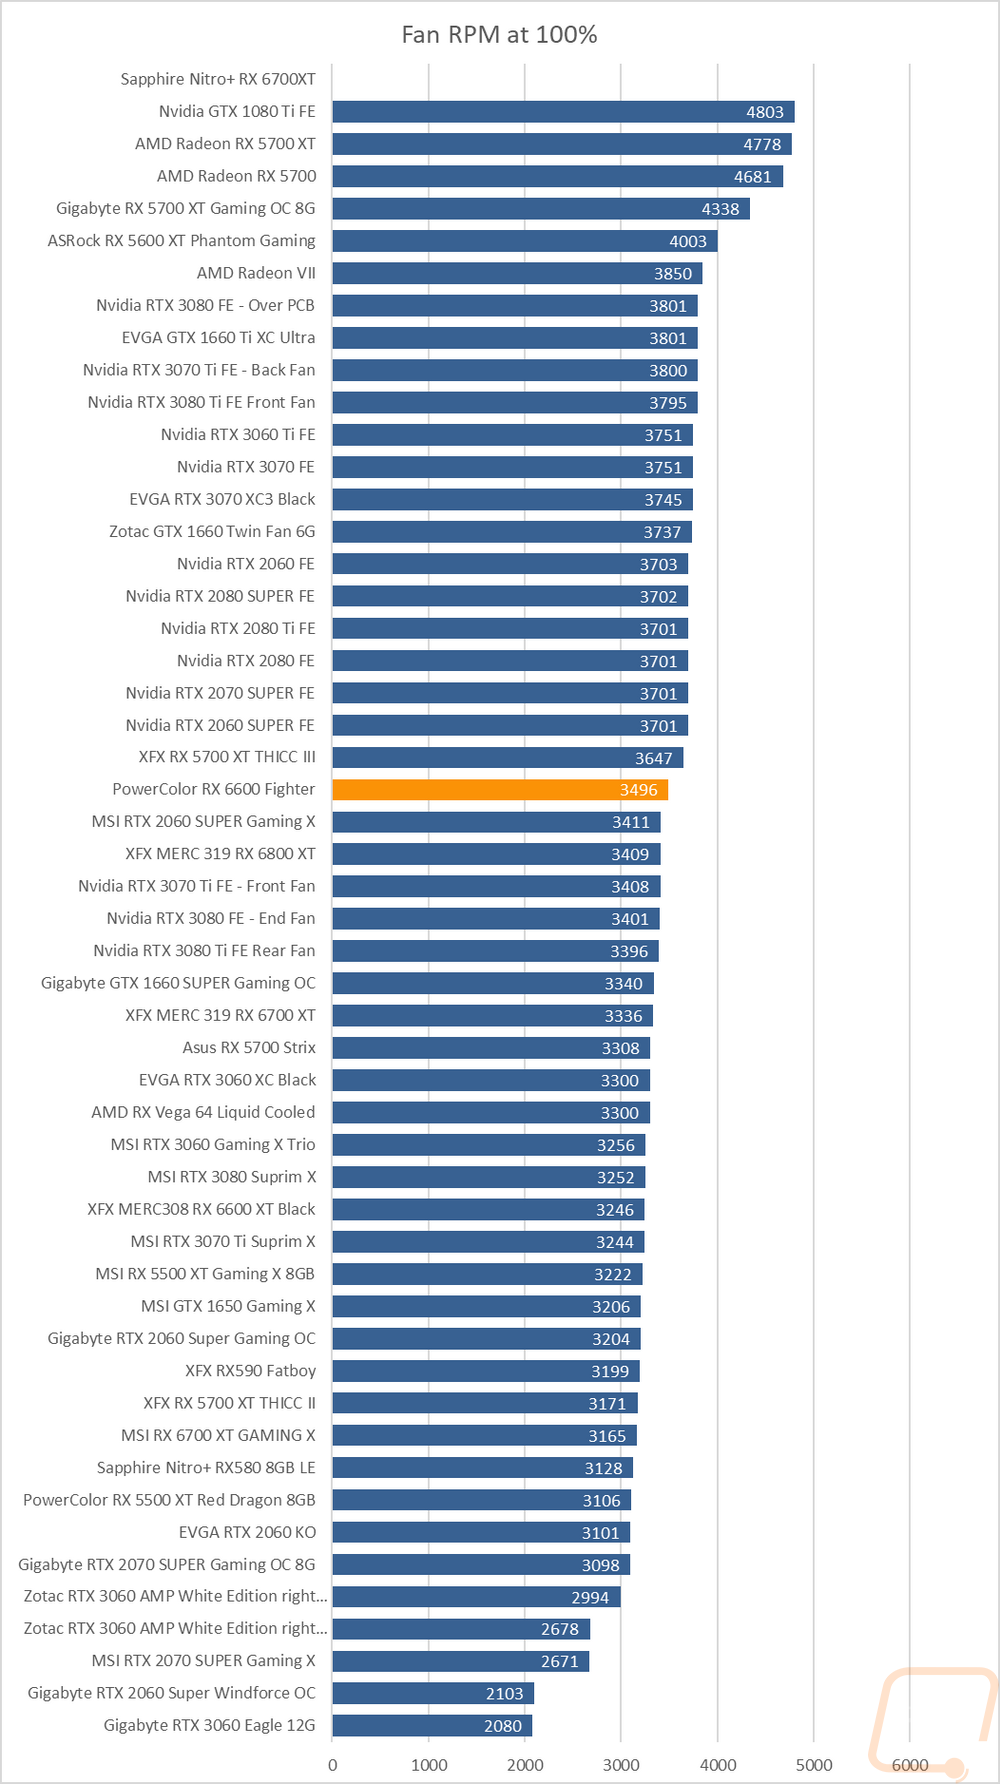
My next round of tests were looking at noise levels. These are especially important to me because I can’t stand to listen to my PC whirling. Especially when I’m not in game and other applications are using the GPU. For my testing, though I first tested with the fan cranked up to 100% to get an idea of how loud it can get, then again at 50% to get an idea of its range. The PowerColor RX 6600 Fighter with its dual fans running at 100% was almost dead even with the XFX 6600 XT that I had previously tested and was in the 1/3 to ½ range on our charts. Testing the noise levels after letting the PowerColor RX 6600 Fighter run using AIDA64 for a half-hour with the stock fan profile had the PowerColor RX 6600 Fighter higher up in the charts at around the halfway point, however. The 100% fan speed results do better than the RPM chart indicates that it should at least with it around halfway up the chart at 3496 RPM.
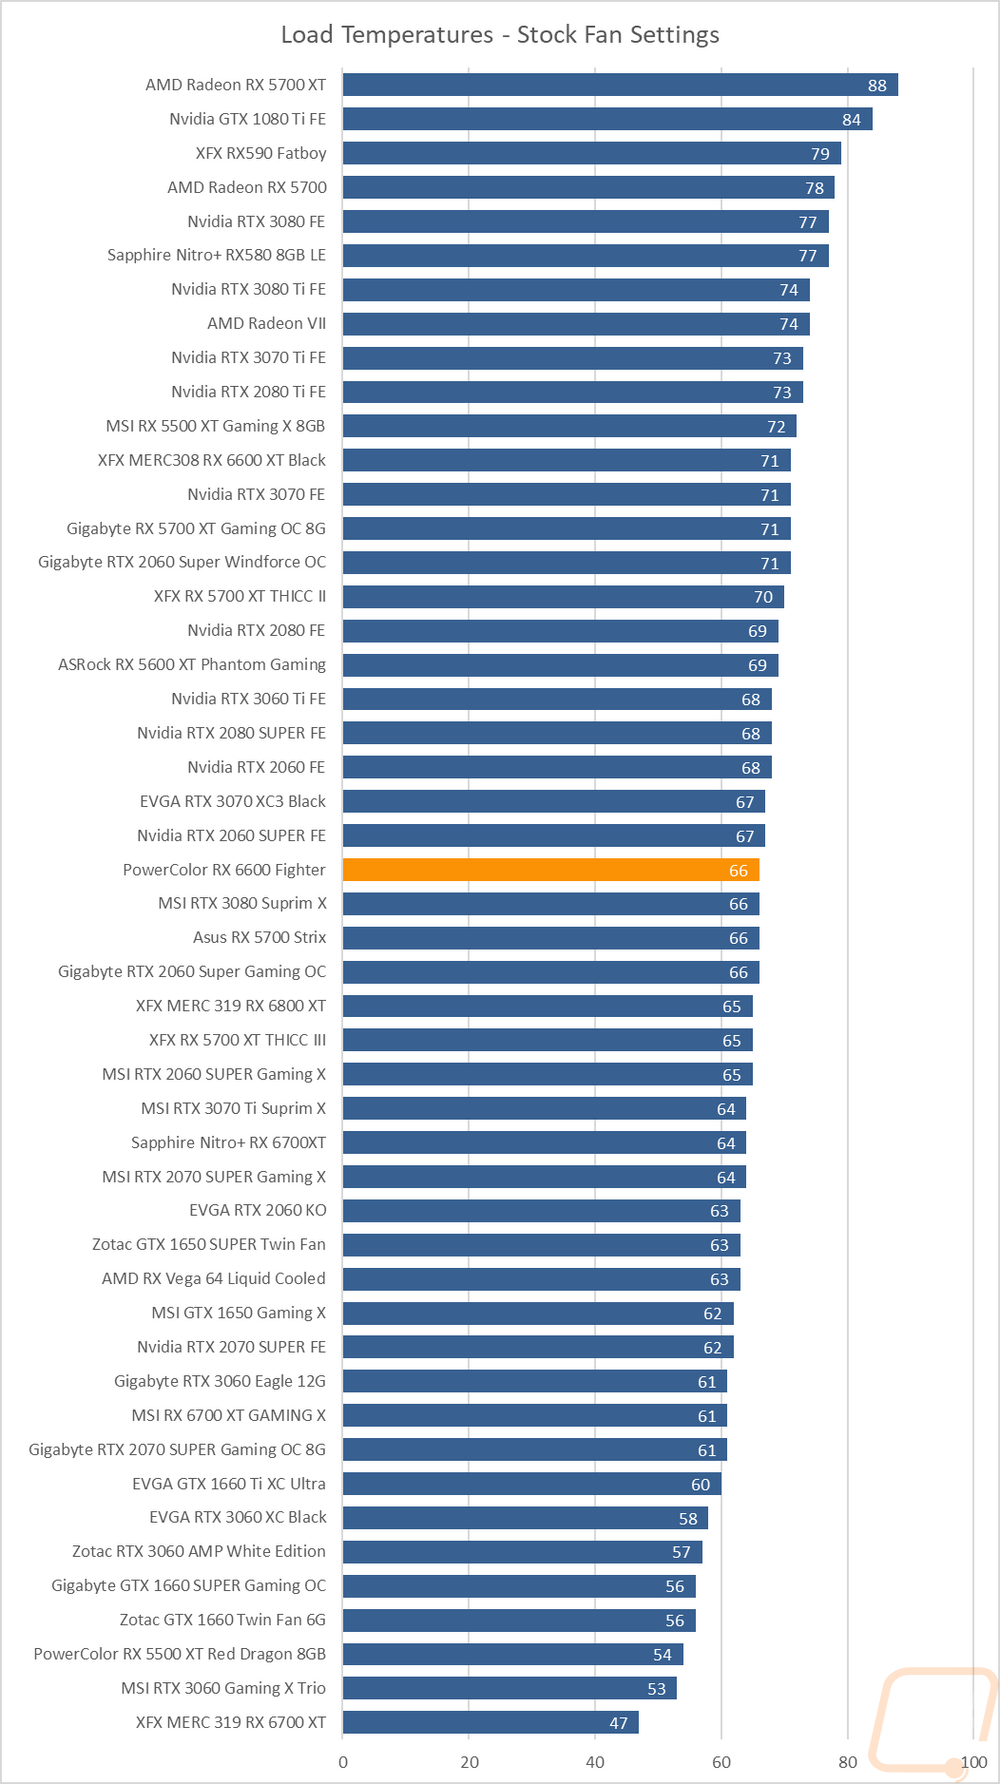
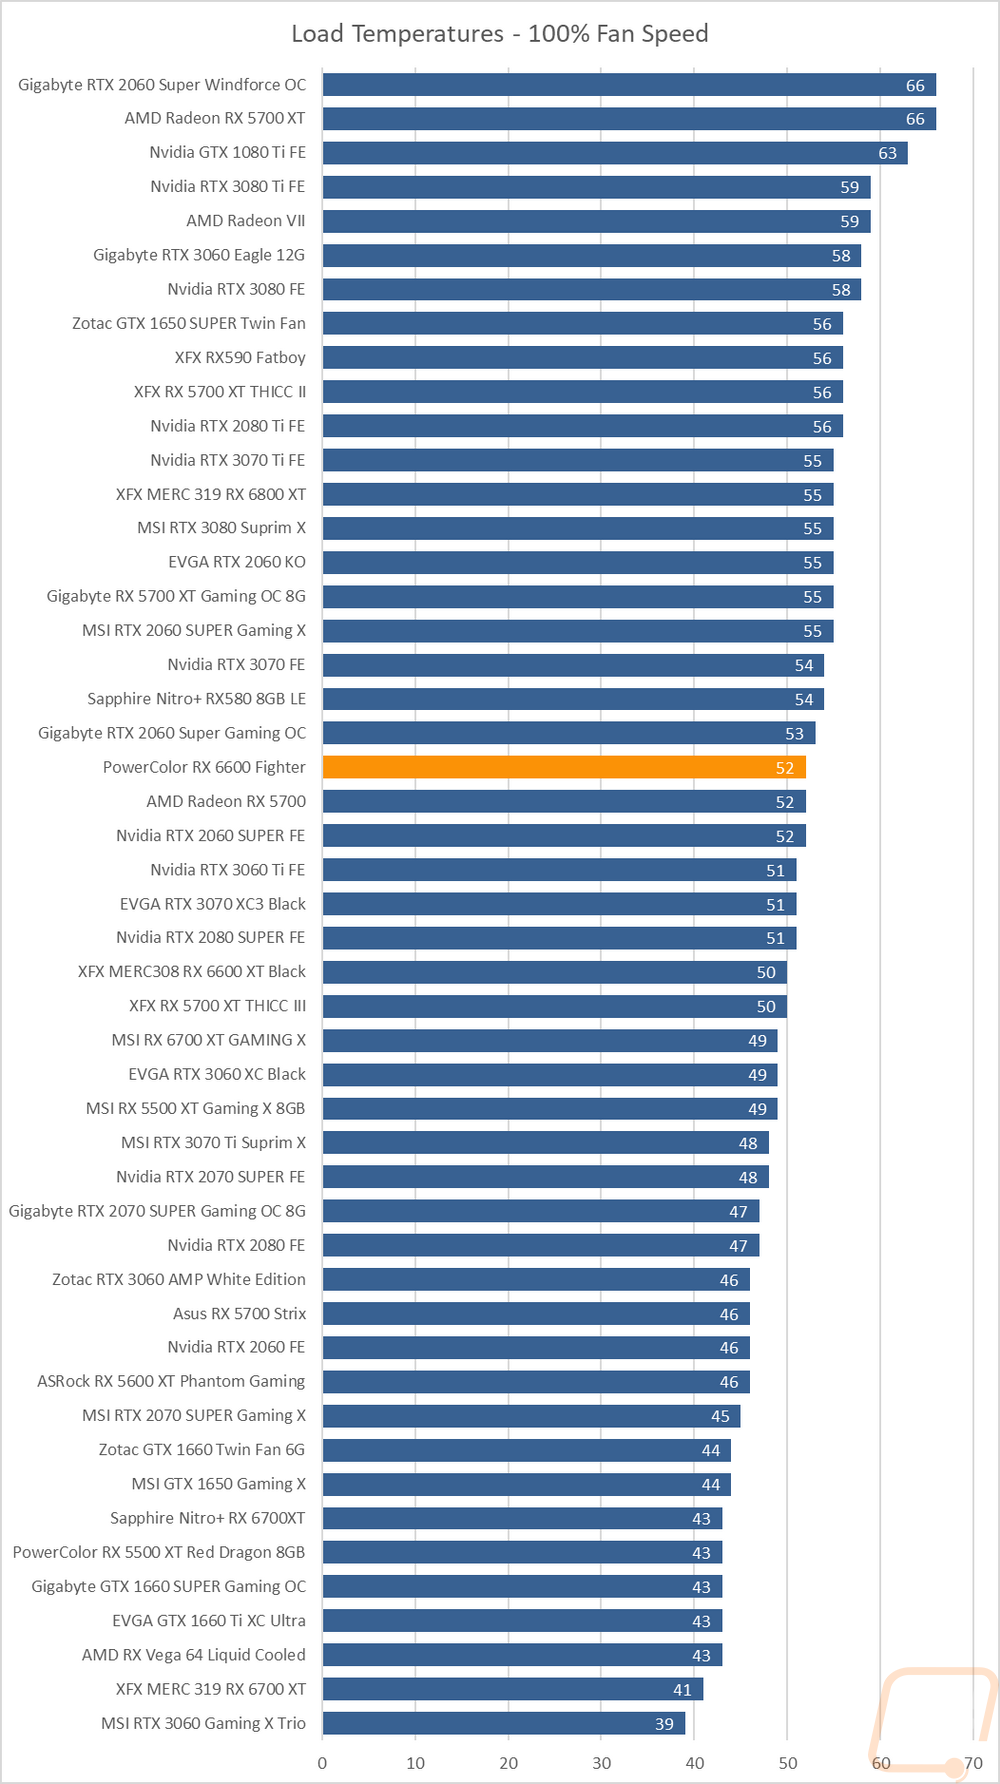
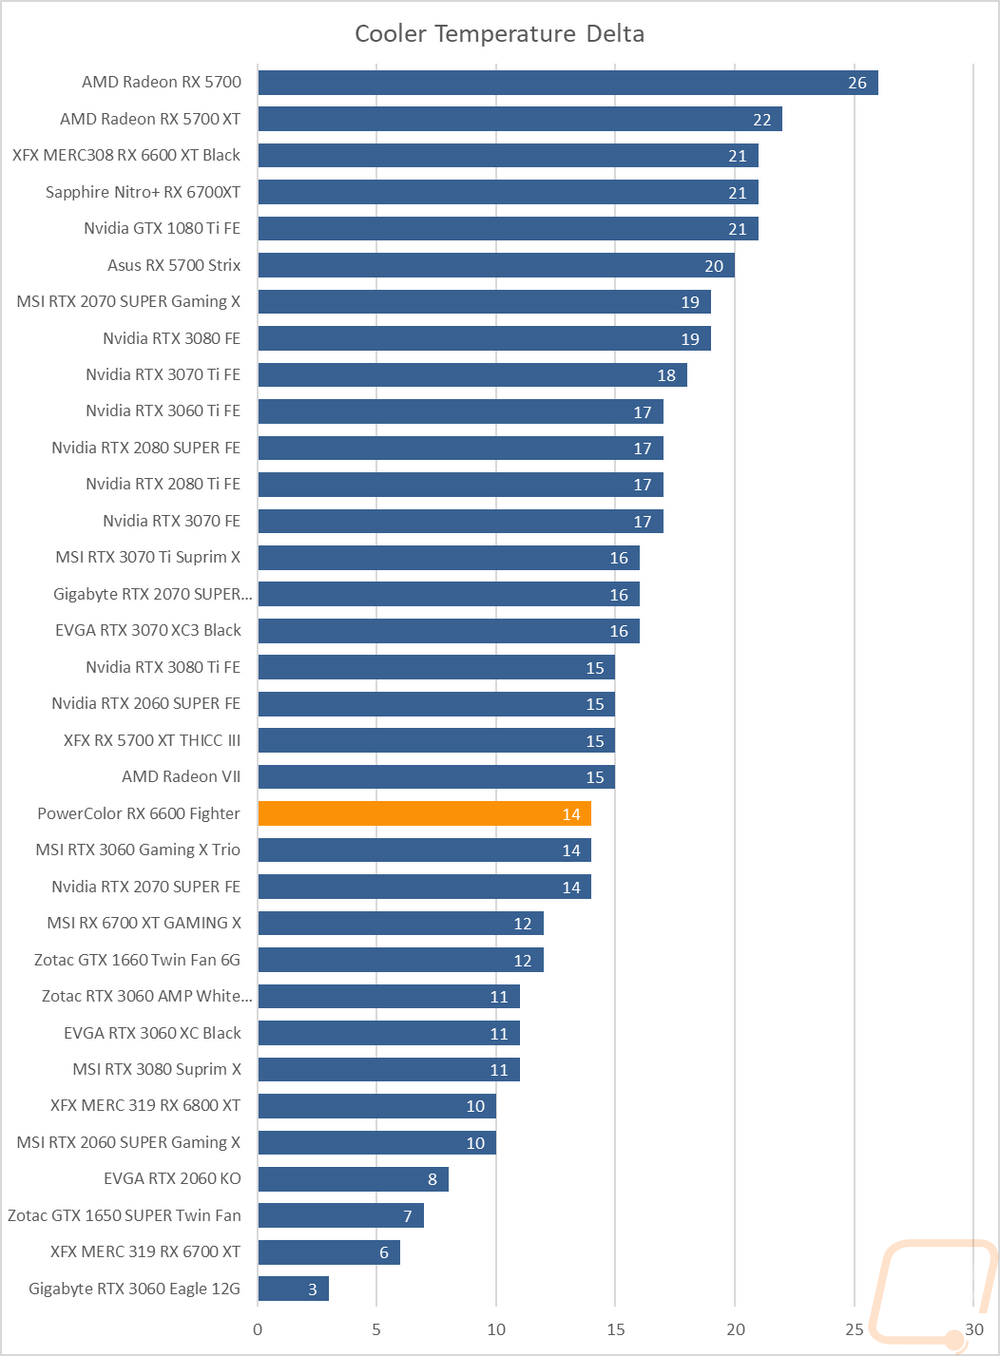
To finish up my testing I of course had to check out the cooling performance. To do this I ran two different tests. I used AIDA64’s Stress Test run for a half-hour each to warm things up. Then I documented what temperature the GPU leveled out at with the stock fan profile and then again with the fans cranked up to 100%. With the stock profile, the PowerColor RX 6600 Fighter came in at 66c. Without another RX 6600 to compare things too it is hard to see just how well the PowerColor cooler is performing, but we do know that their fan profile has the dual fan card running 4 degrees less than the XFX 6600 XT. With the fans cranked up to 100% fan speed that number dropped down to 52c but the card itself stayed right in the middle of the chart. Given how low the PowerColor RX 6600 Fighter was on the power charts it shows that the Fighter cooler isn’t the best possible solution. But that isn’t a big surprise given the more budget-friendly focus on its design as well as the thin heatsink. 66c with the stock profile and 52c at full speed however is more than enough cooling for most people unless you plan on doing heavy overclocking and the 14c delta does still show there is some room in the cooler above the stock fan profile that PowerColor has given the card.
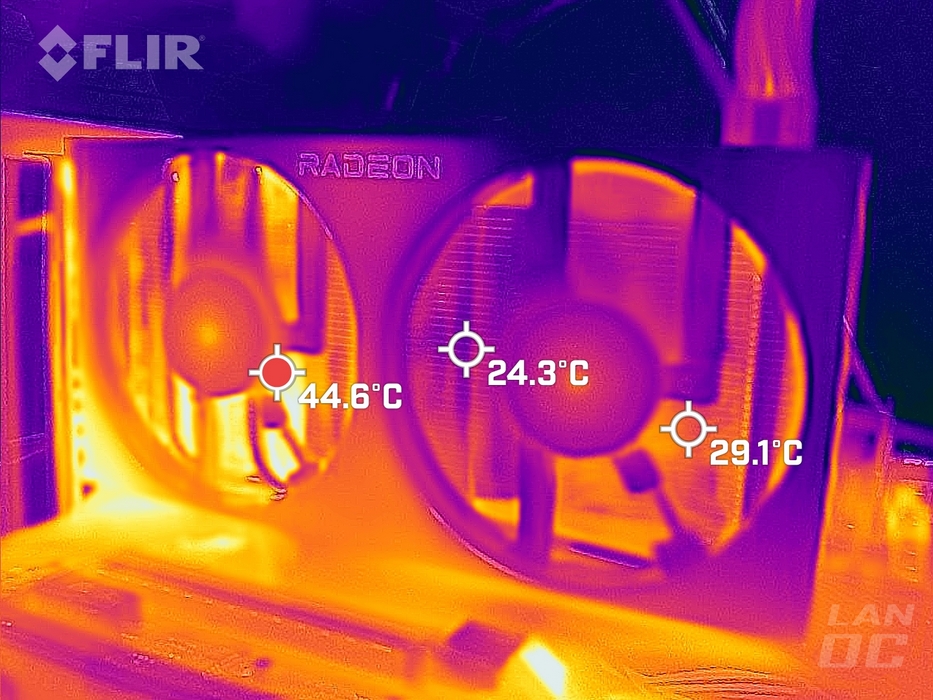
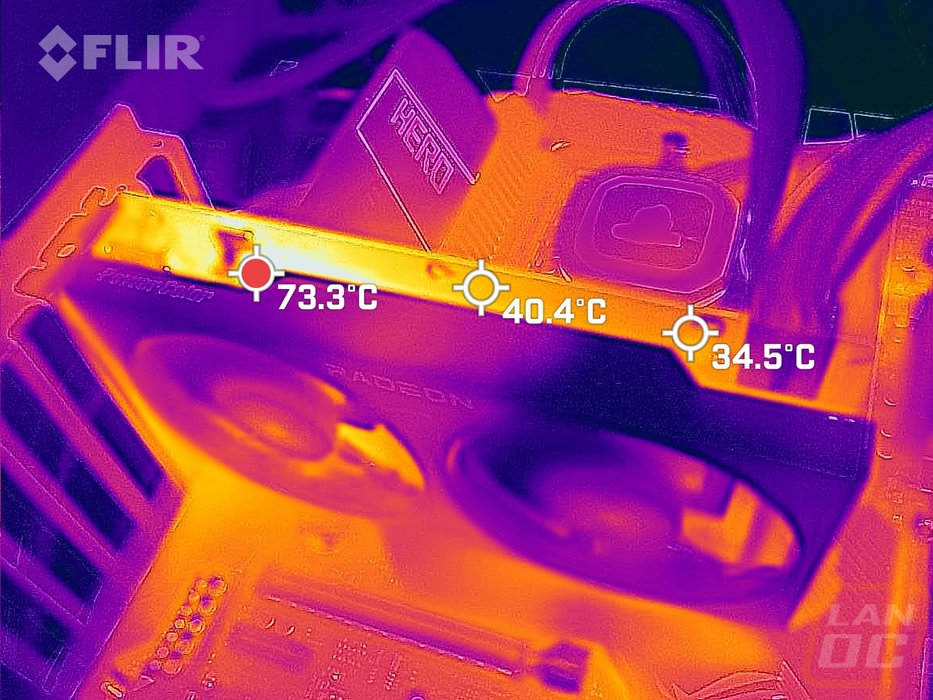
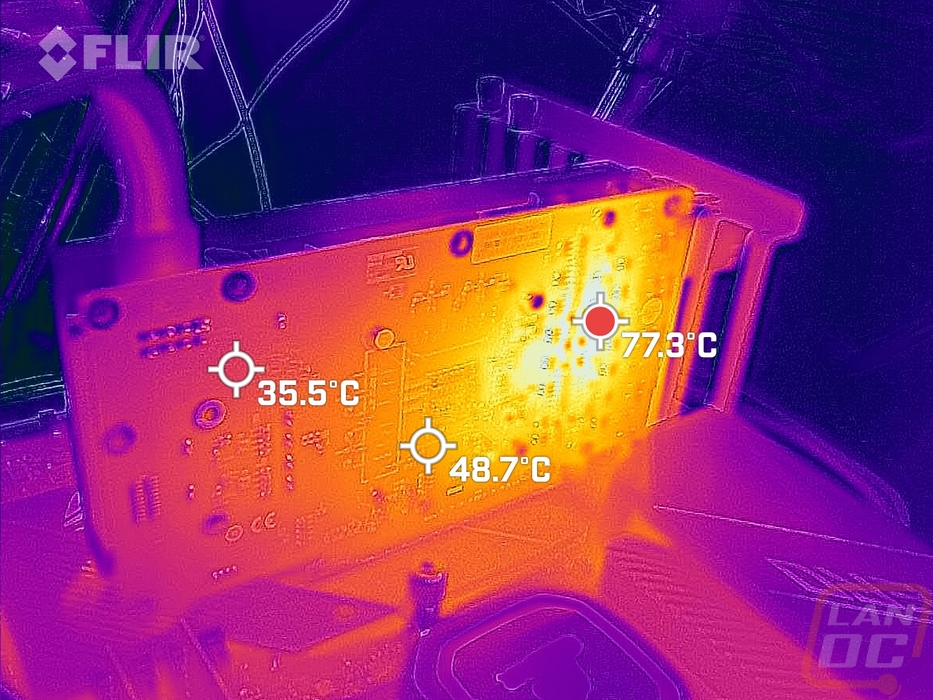
While running the stock fan profile testing I also took the time to get a few thermal images so we could see what is going on. The left side or the fan side of the card has its hottest point just under the left fan. The VRMs are on that side of the GPU and they are close to the GPU itself which puts a lot of heat in that one area. Combine that with the horizontal heatsink layout that is pushing the warm air in that direction I’m not too surprised. The other fan is almost half the temperature and isn’t having any trouble keeping things cool. I do have to wonder if the heatpipe layout shouldn’t have head the double piped side be on the side that doesn’t also have to handle the VRMs. The top-down view shows more of the same with even hotter temperatures on that left side of the card on the direct PCB. The same goes for the back where you can see exactly where it is getting the hottest right in the middle of those VRMs and over near the GPU.